You are not logged in.
This means you
CAN ONLY VIEW reports that were published prior to Monday, April 14, 2025.
You
MUST UPGRADE YOUR MEMBERSHIP if you want to see any current reports.
AFTER MARKET UPDATE - THURSDAY, JUNE 30TH, 2011
Previous After Market Report Next After Market Report >>>
|
|
|
|
DOW |
+152.92 |
12,414.34 |
+1.25% |
|
Volume |
994,085,440 |
+9% |
|
Volume |
1,808,594,000 |
+3% |
|
NASDAQ |
+33.03 |
2,773.52 |
+1.21% |
|
Advancers |
2,210 |
71% |
|
Advancers |
1,832 |
68% |
|
S&P 500 |
+13.23 |
1,320.64 |
+1.01% |
|
Decliners |
820 |
26% |
|
Decliners |
767 |
28% |
|
Russell 2000 |
+7.51 |
827.43 |
+0.92% |
|
52 Wk Highs |
113 |
|
|
52 Wk Highs |
103 |
|
|
S&P 600 |
+5.02 |
444.69 |
+1.14% |
|
52 Wk Lows |
12 |
|
|
52 Wk Lows |
35 |
|
|
 |
Major Indices Collectively Rallied Above 50-Day Averages
Kenneth J. Gruneisen - Passed the CAN SLIM® Master's Exam
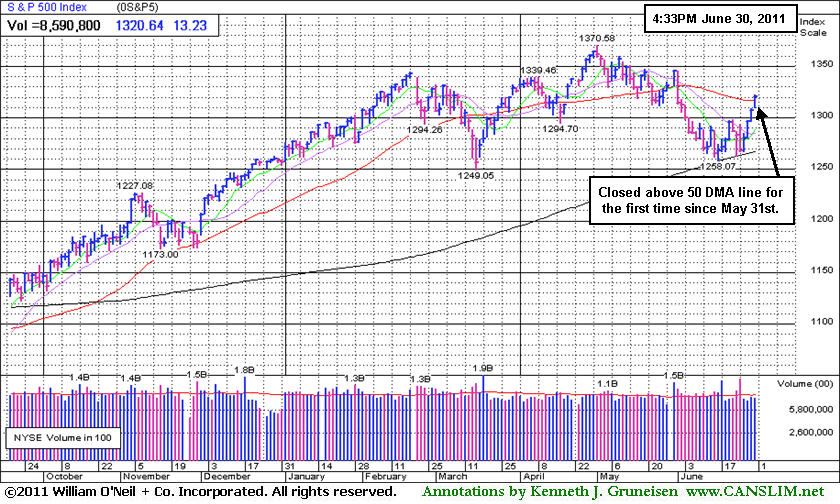
The major averages collectively rallied for their 4th consecutive gains, and the indices' gains allowed them all to close above their 50-day moving average lines as the month and the second quarter were concluded. Thursday's volume totals were reported higher than the prior session on the Nasdaq exchange and on the NYSE, a reassuring sign that institutional buying demand was on the rise. Advancing issues beat decliners by nearly 3-1 on the NYSE and by 9-4 on the Nasdaq exchange. New 52-week highs outnumbered new 52-week lows on both the Nasdaq exchange and the NYSE. There were 74 high-ranked companies from the CANSLIM.net Leaders List that made new 52-week highs and appeared on the CANSLIM.net BreakOuts Page, up from the total of 71 on the prior session. There were 10 gainers out of the 14 high-ranked leaders currently included on the Featured Stocks Page.
Unemployment claims only fell by 1,000 last week to 428,000, suggesting little progress in the labor market. Reports on business activity in the Chicago area were much better than expected, Led by a jump in new orders. The markets ended the second quarter on a high note, and the S&P 500 Index enjoyed its best four-day advance since December. Greece cleared the final hurdle to a European bailout as its leaders approved a bill to keep rescue aid flowing and Germany's government and its biggest banks agreed on a proposal to roll over Greek debt holdings.
Fertilizer producers declined after the U.S. Department of Agriculture said farmers sowed more acres with corn than forecast in March and inventories at the beginning of this month were larger than analysts expected. CF Industries Holdings Inc (CF -5.14%) loss was among the biggest in the S&P 500.
First Solar Inc (FSLR +2.2%) rose after the Energy Department awarded the company $4.5 billion in loan guarantees for a new energy project. EBay Inc (EBAY +4.57%) benefited from several analyst upgrades and the shares rose.
The Q2 2011 CANSLIM.net Webcast is available "ON DEMAND" now to UPGRADED MEMBERS ONLY - (CLICK HERE). Our July 2011 issue of CANSLIM.net News is due to be released soon!
PICTURED: The S&P 500 Index rallied and closed above its 50-day moving average (DMA) line for the first time since May 31st.
|
 Kenneth J. Gruneisen started out as a licensed stockbroker in August 1987, a couple of months prior to the historic stock market crash that took the Dow Jones Industrial Average down -22.6% in a single day. He has published daily fact-based fundamental and technical analysis on high-ranked stocks online for two decades. Through FACTBASEDINVESTING.COM, Kenneth provides educational articles, news, market commentary, and other information regarding proven investment systems that work in good times and bad.
Comments contained in the body of this report are technical opinions only and are not necessarily those of Gruneisen Growth Corp. The material herein has been obtained from sources believed to be reliable and accurate, however, its accuracy and completeness cannot be guaranteed. Our firm, employees, and customers may effect transactions, including transactions contrary to any recommendation herein, or have positions in the securities mentioned herein or options with respect thereto. Any recommendation contained in this report may not be suitable for all investors and it is not to be deemed an offer or solicitation on our part with respect to the purchase or sale of any securities. |
|
 |
Energy Group and Tech Indexes Led Gainers
Kenneth J. Gruneisen - Passed the CAN SLIM® Master's Exam
Energy-related shares were standout gainers as the Integrated Oil Index ($XOI +1.69%) and Oil Services Index ($OSX +1.70%) spurted higher for their 4th consecutive big gains. They've each rallied from near or below their 200-day moving average (DMA) lines to quickly rise above their 50 DMA lines. The Gold & Silver Index ($XAU +0.85%) and Retail Index ($RLX +0.55%) each posted modest gains, meanwhile tech shares set a stronger pace as the Networking Index ($NWX +1.07%) and Internet Index ($IIX +1.35%) showed even better gains. The Broker/Dealer Index ($XBD +0.01%) finished flat and the Bank Index ($BKX +0.29%) barely inched higher. The Healthcare Index ($HMO -0.46%) and Biotechnology Index ($BTK -0.14%) finished with small losses.
Charts courtesy www.stockcharts.com
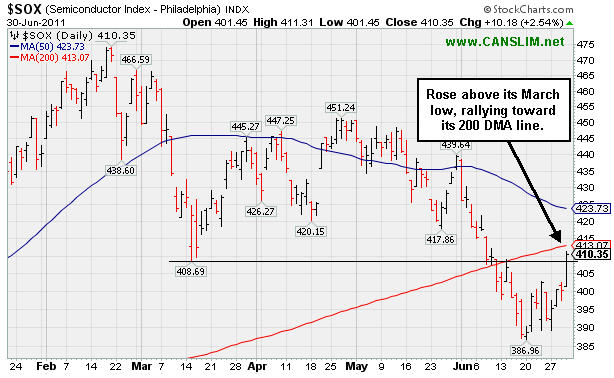
PICTURED: The Semiconductor Index ($SOX +2.54%) led the tech sector's advance as it rose above its March lows, rallying toward its 200 DMA line.
| Oil Services |
$OSX |
268.05 |
+4.47 |
+1.70% |
+9.35% |
| Healthcare |
$HMO |
2,440.51 |
-11.27 |
-0.46% |
+44.24% |
| Integrated Oil |
$XOI |
1,304.31 |
+21.67 |
+1.69% |
+7.51% |
| Semiconductor |
$SOX |
410.35 |
+10.18 |
+2.54% |
-0.36% |
| Networking |
$NWX |
302.87 |
+3.20 |
+1.07% |
+7.95% |
| Internet |
$IIX |
310.66 |
+4.15 |
+1.35% |
+0.95% |
| Broker/Dealer |
$XBD |
107.15 |
+0.02 |
+0.01% |
-11.82% |
| Retail |
$RLX |
529.96 |
+2.88 |
+0.55% |
+4.24% |
| Gold & Silver |
$XAU |
201.13 |
+1.69 |
+0.85% |
-11.23% |
| Bank |
$BKX |
48.32 |
+0.14 |
+0.29% |
-7.45% |
| Biotech |
$BTK |
1,460.63 |
-2.10 |
-0.14% |
+12.56% |
|
|
|
 |
50-Day Moving Average Still Acting as Resistance
Kenneth J. Gruneisen - Passed the CAN SLIM® Master's Exam
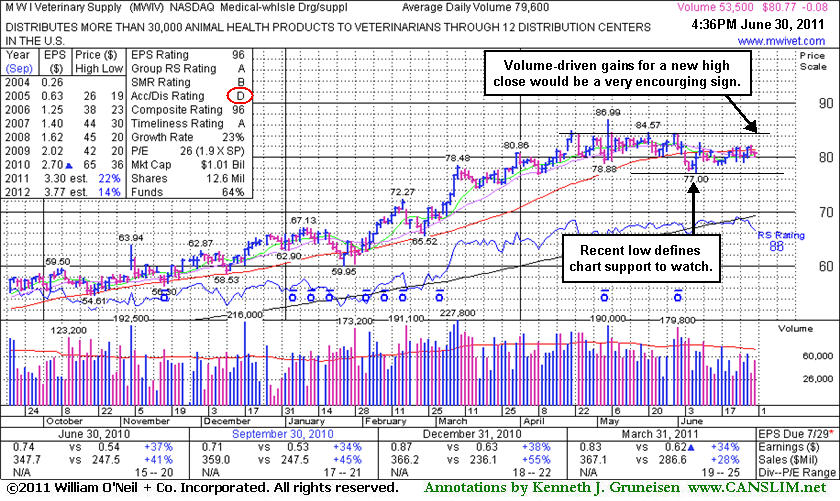
M W I Veterinary Supply (MWIV -$0.34 or -0.42% to $80.51) may be forming a new base, however gains in recent weeks have lacked volume conviction. Its Accumulation/Distribution Rating (see red circle) of D remains a cause for concern. After its last appearance in this FSU section with an annotated graph on 6/09/11 under the headline, "Quiet Gains Following Technically Damaging Distribution", its 50-day moving average (DMA) line has been acting as a stubborn resistance level.
Sales revenues acceleration (bigger percentage increases sequentially, +34%, +41%, +45% and +55% in the Mar, Jun, Sep, and Dec '10 quarterly comparisons versus the year earlier) was noted as a very reassuring sign. For the latest period ended March 31, 2011 its +28% sales revenues increase was still was very strong, but it broke the sequential streak of bigger sales increases. Acceleration suggests increasing demand for the company's products, which, along with the price recently hitting new highs, solidly satisfied the N criteria.
Its solid quarterly and annual earnings history satisfies the C and A criteria. Its small supply (S criteria) of only 12.6 million shares outstanding could contribute to greater volatility in the event of institutional buying or selling. The number of top-rated funds owning its shares rose from 255 in Mar '10 to 280 in Mar '11, a reassuring sign of support from the institutional (I criteria) crowd. Since it was first featured in yellow at $52.05 on 7/29/10 it traded as much as +67.1% higher in about 9 months. It has the look of a sound new base forming, and although a new pivot point is not being cited, subsequent volume-driven gains for a new high close (above the $84.30 close from 5/31/11) would be considered a very encouraging sign. Disciplined investors would watch for a sound base to be noted and wait for market conditions (the M criteria) to signal that odds are more favorable. Keep in mind that during market corrections, the M criteria argues against new buying efforts, since 3 out of 4 stocks typically go in the same direction of the broader market.
 |
|
|
Color Codes Explained :
Y - Better candidates highlighted by our
staff of experts.
G - Previously featured
in past reports as yellow but may no longer be buyable under the
guidelines.
***Last / Change / Volume data in this table is the closing quote data***
Symbol/Exchange
Company Name
Industry Group |
PRICE |
CHANGE
(%Change) |
Day High |
Volume
(% DAV)
(% 50 day avg vol) |
52 Wk Hi
% From Hi |
Featured
Date |
Price
Featured |
Pivot Featured |
|
Max Buy |
CACC
-
NASDAQ
Credit Acceptance Corp
FINANCIAL SERVICES - Credit Services
|
$84.47
|
+3.51
4.34% |
$84.50
|
63,444
152.51% of 50 DAV
50 DAV is 41,600
|
$82.29
2.65%
|
6/2/2011
|
$76.10
|
PP = $82.39
|
|
MB = $86.51
|
 Most Recent Note - 6/30/2011 12:06:36 PM
Y - A volume-driven gain and strong finish may trigger a technical buy signal for this high-ranked leader in the Finance - Consumer Loans industry. It hit a new all-time high today, rising above its pivot point for a 4th consecutive gain. Recent lows near $75 define important support to watch below initial support at its 50 DMA line.
>>> The latest Featured Stock Update with an annotated graph appeared on 6/27/2011. Click here.
View all notes |
Alert me of new notes |
CANSLIM.net Company Profile |
SEC |
Zacks Reports |
StockTalk |
News |
Chart |
Request a new note
C
A N
S L
I M


|
CMG
-
NYSE
Chipotle Mexican Grill
LEISURE - Restaurants
|
$308.19
|
+3.73
1.23% |
$308.55
|
606,198
58.65% of 50 DAV
50 DAV is 1,033,600
|
$308.93
-0.24%
|
4/1/2011
|
$274.00
|
PP = $275.10
|
|
MB = $288.86
|
Most Recent Note - 6/29/2011 5:40:25 PM
G - Touched another new all-time high today then erased its gain. After 4 consecutive gains it is clear of all resistance due to overhead supply, but it has not formed a sound new base pattern. The upward trendline connecting its July 2010 and May 2011 lows defines an initial technical support level to watch.
>>> The latest Featured Stock Update with an annotated graph appeared on 6/15/2011. Click here.
View all notes |
Alert me of new notes |
CANSLIM.net Company Profile |
SEC |
Zacks Reports |
StockTalk |
News |
Chart |
Request a new note
C
A N
S L
I M
|
EZPW
-
NASDAQ
Ezcorp Inc Cl A
SPECIALTY RETAIL - Specialty Retail, Other
|
$35.58
|
+0.23
0.64% |
$35.98
|
363,568
98.42% of 50 DAV
50 DAV is 369,400
|
$35.74
-0.46%
|
6/13/2011
|
$31.18
|
PP = $33.41
|
|
MB = $35.08
|
Most Recent Note - 6/29/2011 1:09:13 PM
G - Getting more extended from its prior base today with a 5th consecutive volume-driven gain. Prior highs in the $33 area define support to watch on pullbacks.
>>> The latest Featured Stock Update with an annotated graph appeared on 6/13/2011. Click here.
View all notes |
Alert me of new notes |
CANSLIM.net Company Profile |
SEC |
Zacks Reports |
StockTalk |
News |
Chart |
Request a new note
C
A N
S L
I M
|
FCFS
-
NASDAQ
First Cash Financial Svs
SPECIALTY RETAIL - Specialty Retail, Other
|
$41.99
|
+0.44
1.06% |
$42.75
|
226,116
120.15% of 50 DAV
50 DAV is 188,200
|
$42.36
-0.87%
|
5/31/2011
|
$42.00
|
PP = $40.23
|
|
MB = $42.24
|
Most Recent Note - 6/28/2011 3:32:45 PM
Y - Gapped up today, challenging its best-ever close. Color code is changed to yellow based on recent resilience after negating its prior breakout yet finding great support at its 50 DMA line. A new pivot point is not cited, however some may consider its latest consolidation a new "square box" type base pattern. Prior lows in the $37 area define support to watch.
>>> The latest Featured Stock Update with an annotated graph appeared on 6/22/2011. Click here.
View all notes |
Alert me of new notes |
CANSLIM.net Company Profile |
SEC |
Zacks Reports |
StockTalk |
News |
Chart |
Request a new note
C
A N
S L
I M
|
FOSL
-
NASDAQ
Fossil Inc
CONSUMER DURABLES - Recreational Goods, Other
|
$117.72
|
+0.90
0.77% |
$119.46
|
929,313
126.83% of 50 DAV
50 DAV is 732,700
|
$118.56
-0.71%
|
2/1/2011
|
$73.30
|
PP = $74.44
|
|
MB = $78.16
|
Most Recent Note - 6/28/2011 3:34:50 PM
G - Hit another new all-time high today, getting extended while gradually wedging higher after 5 weeks of trading in a tight range forming a "late-stage" base. Recent lows near $99 define important support to watch just below its 50 DMA line.
>>> The latest Featured Stock Update with an annotated graph appeared on 6/28/2011. Click here.
View all notes |
Alert me of new notes |
CANSLIM.net Company Profile |
SEC |
Zacks Reports |
StockTalk |
News |
Chart |
Request a new note
C
A N
S L
I M
|
Symbol/Exchange
Company Name
Industry Group |
PRICE |
CHANGE
(%Change) |
Day High |
Volume
(% DAV)
(% 50 day avg vol) |
52 Wk Hi
% From Hi |
Featured
Date |
Price
Featured |
Pivot Featured |
|
Max Buy |
HS
-
NYSE
Healthspring Inc
HEALTH SERVICES - Health Care Plans
|
$46.11
|
-0.15
-0.32% |
$46.65
|
670,114
76.06% of 50 DAV
50 DAV is 881,000
|
$47.78
-3.50%
|
6/16/2011
|
$42.44
|
PP = $45.21
|
|
MB = $47.47
|
Most Recent Note - 6/29/2011 5:42:32 PM
Y - Holding its ground stubbornly, and prior resistance defines support after its recent streak of gains with above average volume to new all-time highs.
>>> The latest Featured Stock Update with an annotated graph appeared on 6/16/2011. Click here.
View all notes |
Alert me of new notes |
CANSLIM.net Company Profile |
SEC |
Zacks Reports |
StockTalk |
News |
Chart |
Request a new note
C
A N
S L
I M
|
INFA
-
NASDAQ
Informatica Corp
COMPUTER SOFTWARE and SERVICES - Business Software and Services
|
$58.43
|
+0.14
0.24% |
$58.86
|
1,165,817
91.96% of 50 DAV
50 DAV is 1,267,700
|
$59.98
-2.58%
|
3/24/2011
|
$50.04
|
PP = $49.86
|
|
MB = $52.35
|
Most Recent Note - 6/28/2011 3:48:39 PM
G - Recently found support near its 50 DMA line, and it is quietly wedging up today, rising near its prior high close and 52-week high. This high-ranked Computer Software - Database firm faces no overhead supply to hinder its progress, but it has not formed a sound new base pattern.
>>> The latest Featured Stock Update with an annotated graph appeared on 6/17/2011. Click here.
View all notes |
Alert me of new notes |
CANSLIM.net Company Profile |
SEC |
Zacks Reports |
StockTalk |
News |
Chart |
Request a new note
C
A N
S L
I M
|
LULU
-
NASDAQ
Lululemon Athletica
MANUFACTURING - Textile Manufacturing
|
$111.82
|
+0.14
0.13% |
$113.25
|
1,958,322
94.93% of 50 DAV
50 DAV is 2,062,900
|
$114.20
-2.08%
|
6/21/2011
|
$102.95
|
PP = $101.14
|
|
MB = $106.20
|
Most Recent Note - 6/28/2011 1:14:18 PM
G - Gapped up today, surging again to new 52-week and all-time highs, getting more extended from its latest base. Disciplined investors avoid chasing extended stocks. Prior highs define important chart support to watch.
>>> The latest Featured Stock Update with an annotated graph appeared on 6/21/2011. Click here.
View all notes |
Alert me of new notes |
CANSLIM.net Company Profile |
SEC |
Zacks Reports |
StockTalk |
News |
Chart |
Request a new note
C
A N
S L
I M
|
MWIV
-
NASDAQ
M W I Veterinary Supply
HEALTH SERVICES - Medical Instruments and; Supplies
|
$80.77
|
-0.08
-0.10% |
$81.10
|
55,508
69.73% of 50 DAV
50 DAV is 79,600
|
$86.99
-7.15%
|
11/4/2010
|
$61.79
|
PP = $59.60
|
|
MB = $62.58
|
Most Recent Note - 6/28/2011 3:52:35 PM
G - It may be forming a new base, however gains in recent weeks have lacked volume conviction and its 50 DMA line has been acting as a stubborn resistance level.
>>> The latest Featured Stock Update with an annotated graph appeared on 6/30/2011. Click here.
View all notes |
Alert me of new notes |
CANSLIM.net Company Profile |
SEC |
Zacks Reports |
StockTalk |
News |
Chart |
Request a new note
C
A N
S L
I M
|
OPNT
-
NASDAQ
Opnet Technologies
INTERNET - Internet Software and Services
|
$40.94
|
-0.36
-0.87% |
$41.92
|
68,323
57.66% of 50 DAV
50 DAV is 118,500
|
$42.51
-3.69%
|
6/28/2011
|
$40.87
|
PP = $42.61
|
|
MB = $44.74
|
Most Recent Note - 6/28/2011 3:25:38 PM
Y - Rising near its best-ever close with today's 4th consecutive gain. Color code is changed to yellow and a new pivot point cited is based on its 52-week high plus ten cents. Disciplined investors watch for a confirming technical buy signal before taking action. Recent lows near $36 define important near-term chart support.
>>> The latest Featured Stock Update with an annotated graph appeared on 6/10/2011. Click here.
View all notes |
Alert me of new notes |
CANSLIM.net Company Profile |
SEC |
Zacks Reports |
StockTalk |
News |
Chart |
Request a new note
C
A N
S L
I M
|
Symbol/Exchange
Company Name
Industry Group |
PRICE |
CHANGE
(%Change) |
Day High |
Volume
(% DAV)
(% 50 day avg vol) |
52 Wk Hi
% From Hi |
Featured
Date |
Price
Featured |
Pivot Featured |
|
Max Buy |
OTEX
-
NASDAQ
Open Text Corp
INTERNET - Internet Software and Services
|
$64.02
|
+1.32
2.11% |
$64.28
|
356,477
112.60% of 50 DAV
50 DAV is 316,600
|
$67.08
-4.56%
|
6/1/2011
|
$65.86
|
PP = $67.18
|
|
MB = $70.54
|
Most Recent Note - 6/30/2011 3:58:17 PM
Y - Today's 4th consecutive gain has it rising above its 50 DMA line to within -4.8% of its 52-week high. Color code is changed to yellow after its recent resilience, yet volume-driven gains above the previously cited pivot point are necessary to trigger a technical buy signal.
>>> The latest Featured Stock Update with an annotated graph appeared on 6/24/2011. Click here.
View all notes |
Alert me of new notes |
CANSLIM.net Company Profile |
SEC |
Zacks Reports |
StockTalk |
News |
Chart |
Request a new note
C
A N
S L
I M
|
SWI
-
NYSE
Solarwinds Inc
COMPUTER SOFTWARE and SERVICES - Application Software
|
$26.14
|
+0.17
0.65% |
$26.29
|
677,895
82.36% of 50 DAV
50 DAV is 823,100
|
$26.68
-2.02%
|
6/7/2011
|
$24.22
|
PP = $25.05
|
|
MB = $26.30
|
Most Recent Note - 6/28/2011 1:21:00 PM
Y - Rising back above its pivot point today with slightly higher volume behind its gain. Prior resistance in the $24-25 area defines support, and a subsequent close under its old high close ($24.77 on 4/25/11) would raise concerns by negating its recent breakout.
>>> The latest Featured Stock Update with an annotated graph appeared on 6/29/2011. Click here.
View all notes |
Alert me of new notes |
CANSLIM.net Company Profile |
SEC |
Zacks Reports |
StockTalk |
News |
Chart |
Request a new note
C
A N
S L
I M
|
ULTA
-
NASDAQ
Ulta Salon Cosm & Frag
SPECIALTY RETAIL - Specialty Retail, Other
|
$64.58
|
+1.23
1.94% |
$65.27
|
644,290
77.15% of 50 DAV
50 DAV is 835,100
|
$64.89
-0.48%
|
1/6/2011
|
$36.12
|
PP = $37.34
|
|
MB = $39.21
|
Most Recent Note - 6/30/2011 3:52:28 PM
G - Hit another new all-time high today, getting more extended from any sound base pattern. It may produce more climactic gains, but disciplined investors avoid chasing extended stocks.
>>> The latest Featured Stock Update with an annotated graph appeared on 6/20/2011. Click here.
View all notes |
Alert me of new notes |
CANSLIM.net Company Profile |
SEC |
Zacks Reports |
StockTalk |
News |
Chart |
Request a new note
C
A N
S L
I M
|
ZAGG
-
NASDAQ
Zagg Inc
SPECIALTY RETAIL - Specialty Retail, Other
|
$13.40
|
-0.35
-2.55% |
$14.11
|
3,231,761
185.85% of 50 DAV
50 DAV is 1,738,900
|
$15.85
-15.46%
|
6/1/2011
|
$10.92
|
PP = $10.59
|
|
MB = $11.12
|
Most Recent Note - 6/30/2011 4:00:05 PM
G - Today marks its 4th loss with above average volume in the span of 5 sessions while consolidating from its all-time high. After a spurt of volume-driven gains it is extended from a sound base. Prior highs define initial support to watch on pullbacks.
>>> The latest Featured Stock Update with an annotated graph appeared on 6/23/2011. Click here.
View all notes |
Alert me of new notes |
CANSLIM.net Company Profile |
SEC |
Zacks Reports |
StockTalk |
News |
Chart |
Request a new note
C
A N
S L
I M
|
|
|
|
THESE ARE NOT BUY RECOMMENDATIONS!
Comments contained in the body of this report are technical
opinions only. The material herein has been obtained
from sources believed to be reliable and accurate, however,
its accuracy and completeness cannot be guaranteed.
This site is not an investment advisor, hence it does
not endorse or recommend any securities or other investments.
Any recommendation contained in this report may not
be suitable for all investors and it is not to be deemed
an offer or solicitation on our part with respect to
the purchase or sale of any securities. All trademarks,
service marks and trade names appearing in this report
are the property of their respective owners, and are
likewise used for identification purposes only.
This report is a service available
only to active Paid Premium Members.
You may opt-out of receiving report notifications
at any time. Questions or comments may be submitted
by writing to Premium Membership Services 665 S.E. 10 Street, Suite 201 Deerfield Beach, FL 33441-5634 or by calling 1-800-965-8307
or 954-785-1121.
|
|
|

