You are not logged in.
This means you
CAN ONLY VIEW reports that were published prior to Monday, April 14, 2025.
You
MUST UPGRADE YOUR MEMBERSHIP if you want to see any current reports.
AFTER MARKET UPDATE - TUESDAY, JUNE 30TH, 2009
Previous After Market Report Next After Market Report >>>
|
|
|
|
DOW |
-82.38 |
8,447.00 |
-0.97% |
|
Volume |
1,327,349,850 |
+25% |
|
Volume |
2,190,668,240 |
+5% |
|
NASDAQ |
-9.02 |
1,835.04 |
-0.49% |
|
Advancers |
1,279 |
41% |
|
Advancers |
1,195 |
42% |
|
S&P 500 |
-7.91 |
919.32 |
-0.85% |
|
Decliners |
1,689 |
54% |
|
Decliners |
1,538 |
54% |
|
Russell 2000 |
-2.33 |
508.28 |
-0.46% |
|
52 Wk Highs |
22 |
|
|
52 Wk Highs |
24 |
|
|
S&P 600 |
-1.04 |
268.32 |
-0.39% |
|
52 Wk Lows |
4 |
|
|
52 Wk Lows |
5 |
|
|
 |
Major Averages Close First Half Of 2009 Up Impressively From March Lows
Adam Sarhan, Contributing Writer,
The major averages ended the last day of the second quarter lower as consumer confidence unexpectedly fell and home delinquencies more than doubled. Volume totals were reported higher on the NYSE and very near the prior session total on the Nasdaq exchange. Decliners led advancers by nearly a 7-to-5 ratio on the NYSE and by a 5-to-4 ratio on the Nasdaq exchange. There were only 7 high-ranked companies from the CANSLIM.net Leaders List that made a new 52-week high and appeared on the CANSLIM.net BreakOuts Page, lower than the 17 issues that appeared on the prior session. There had been a welcome improvement in recent days, yet an even greater expansion in the new highs list in the weeks ahead would offer more encouraging news for growth oriented investors.
The major averages ended lower on the last trading day for the month and quarter. The major averages have enjoyed strong gains during the second quarter after a flurry of economic data came in stronger than expected. On March 12, 2009, the same day Bernard Madoff pleaded guilty to the largest ponzi scheme in the history of the world, each of the market averages produced a sound follow-through day which confirmed the current rally which began in early March. Over the 17 weeks that have followed, the major averages tacked on sizeable gains before encountering multi-year resistance.
On Tuesday economic news was mixed as the Conference Board released its consumer sentiment index. The index slid to 49.3 which was six points below the Street's forecast. The decline in consumer sentiment was largely due to the ongoing recession and a recent jump in energy prices. Elsewhere, the government released data which showed prime mortgages defaults (60 days or more past due) rose +2.9% through March 31 from +1.1% at the same time last year.
Since early March, the small cap Russell 2000 Index has emerged as the standout winner, surging a whopping +56%! The tech-heavy Nasdaq Composite Index is a close second, after vaulting +49%. Meanwhile, the S&P 500 Index raced +44% higher and the Dow Jones Industrial Average rose +37%. It is important to note that the vast majority of stocks that helped the major averages rally were beaten down, low-ranked stocks bouncing from egregiously oversold levels. Stocks such as Citigroup (C -1.66%) which bounced from $0.97 to just under $5.00, or Bank of America (BAC +0.08%) which rose from $2.53 to $15.07 a share, helped send the major averages soaring -not fresh leadership! There have been a few high-ranked stocks that triggered technical buy signals over the past 17 weeks, and the vast majority of them have technically failed or they were tremendously volatile and difficult for disciplined investors to effectively trade for profits (e.g. NFLX and TNDM). That said, until the major averages trade above their long multi-year downward trendlines, the market's sideways to lower action may likely continue. Until then, patience is king.
PICTURED: The monthly chart of the Dow Jones Industrial Average shows the prior 3 major market cycles. The bear market from 2000-2002 lasted 31 months, and the current bear market just finished its 20th month. We should also note that the current bear market has demonstrated the most severe (% decline) since WWII -damage that may require a longer time to fully "repair." The major averages are currently trading below multi-year downward trendlines which identify levels that have emerged as formidable technical resistance. Until the bulls manage to lift each of the major averages above their multi-year downward trendlines, the longer-term outlook remains rather bearish.
|
|
|
 |
Tech Sector Helping Nasdaq Lead Its Peers
Kenneth J. Gruneisen - Passed the CAN SLIM® Master's Exam
Commodity-linked areas were weak as the Gold & Silver Index ($XAU -3.22%) was a standout decliner and the Oil Services ($OSX -1.47%) and Integrated Oil ($XOI -0.74%) indexes slumped. Losses in the influential Bank ($BKX -1.46%) and Broker/Dealer ($XBD -1.12%) indexes weighed on the major averages, and did the Retail Index's ($RLX -0.73%) more modest loss. The Healthcare ($HMO -0.65%) group also fell on Tuesday's mostly negative session The Networking ($NWX -1.23%) and Internet ($IIX -0.72%) indexes lost ground while the Semiconductor Index ($SOX +0.09%) ended with a tiny gain, yet all of the tech indices are now trading above their 50-day moving average lines. The tech sector's strength has been a catalyst for the tech-heavy Nasdaq Composite Index's healthier action than its peers.
Charts courtesy www.stockcharts.com
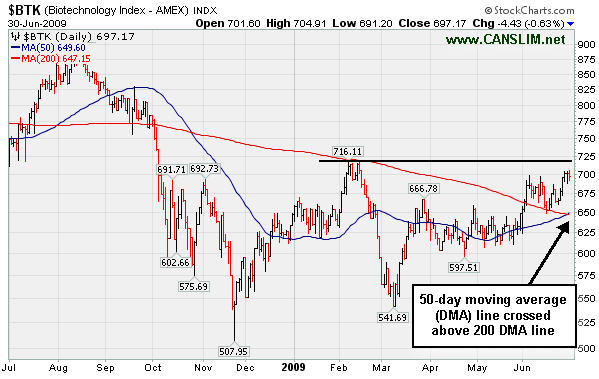
PICTURED: The Biotechnology Index ($BTK -0.63%) edged lower, yet its 50-day moving average (DMA) line has converged and crossed above its 200 DMA, which could bode well for biotech issues in the near term.
| Oil Services |
$OSX |
159.66 |
-2.39 |
-1.47% |
+31.53% |
| Healthcare |
$HMO |
1,109.53 |
-7.23 |
-0.65% |
+15.55% |
| Integrated Oil |
$XOI |
918.90 |
-6.89 |
-0.74% |
-6.20% |
| Semiconductor |
$SOX |
263.15 |
+0.23 |
+0.09% |
+24.03% |
| Networking |
$NWX |
185.12 |
-2.31 |
-1.23% |
+28.65% |
| Internet |
$IIX |
186.75 |
-1.36 |
-0.72% |
+39.61% |
| Broker/Dealer |
$XBD |
98.73 |
-1.12 |
-1.12% |
+27.44% |
| Retail |
$RLX |
322.55 |
-2.36 |
-0.73% |
+15.50% |
| Gold & Silver |
$XAU |
139.02 |
-4.62 |
-3.22% |
+12.25% |
| Bank |
$BKX |
36.45 |
-0.54 |
-1.46% |
-17.76% |
| Biotech |
$BTK |
697.17 |
-4.43 |
-0.63% |
+7.73% |
|
|
|
 |
Continued Consolidation Above Important Support Levels
Kenneth J. Gruneisen - Passed the CAN SLIM® Master's Exam
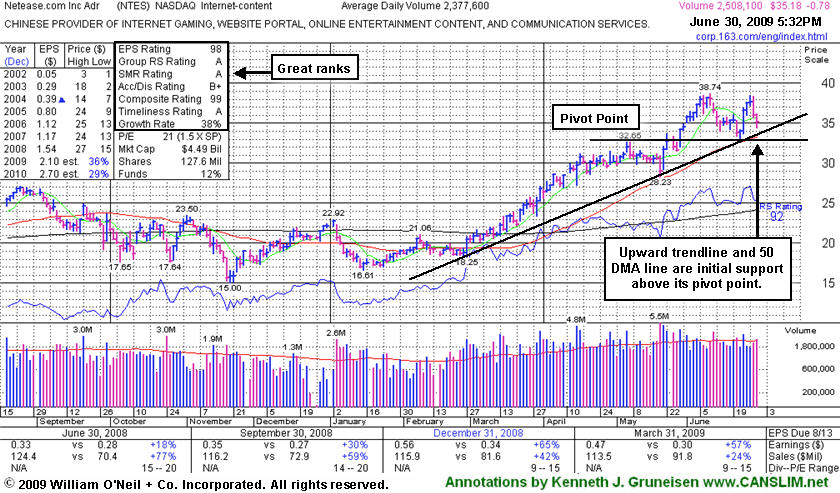
Netease.com Inc (NTES -$0.78 or -2.17% to $35.18) is consolidating above its 50-day moving average (DMA) line and an upward trendline connecting its chart lows in recent months. Those are important support levels to watch just above its most recent pivot point - which it rose above with its 5/28/09 gap up and considerable gain with +79% above average volume, confirming a technical buy signal from a second-stage base. This a high-ranked leader may need to spend more time consolidating before a sound new base might form and offer another ideal entry point. Meanwhile, subsequent violations of support might prompt investors with a profitable interest in NTES to lock in their profits. Deterioration back into its prior base would obviously raise concerns and trigger technical sell signals.
Indications of institutional buying demand have been noted after earnings news on 5/20/09 caused a "shakeout" that tested support near its 50 DMA line -and it found prompt support near that short-term average. The number of top-rated funds owning an interest in its shares increased from 18 in June '08 to 67 in March '09, which is very reassuring news in respect to the I criteria. In its last appearance in this Featured Stock Update section on June 19th an annotated graph helped investors identify support under the headline "Prior Highs and 50 DMA Line Are Important Support To Watch" (read here). NTES was first featured at $26.75 in the 3/31/09 CANSLIM.net Mid-Day Breakouts Report (read here). This high-ranked Chinese Internet - Content firm was also summarized in greater detail including an annotated graph in the April 2009 issue of CANSLIM.net News (read here).
|
|
|
Color Codes Explained :
Y - Better candidates highlighted by our
staff of experts.
G - Previously featured
in past reports as yellow but may no longer be buyable under the
guidelines.
***Last / Change / Volume quote data in this table corresponds with the timestamp on the note***
Symbol/Exchange
Company Name
Industry Group |
Last |
Chg. |
Vol
% DAV |
Date Featured |
Price Featured |
Latest Pivot Point
Featured |
Status |
| Latest Max Buy Price |
GMCR
- NASDAQ
Green Mtn Coffee Roastrs
FOOD & BEVERAGE - Processed & Packaged Goods
|
$59.12
|
N/A
|
N/A
N/A
|
1/1/2008
(Date
Featured) |
$27.13
(Price
Featured) |
PP = $28.66 |
G |
| MB = $30.09 |
Most Recent Note - 6/30/2009 5:16:20 PM
G - Consolidating above its 50 DMA line -important support to watch. On 6/09/09 it reached a new all-time high with a gain on light volume as a 3:2 stock split took effect. GMCR traded up more than +144% since appearing with an annotated graph under the headline "It May Soon Be Time To Go Green" when featured in the January 2009 CANSLIM.net News (read here).
>>> The latest Featured Stock Update with an annotated graph appeared on 6/22/2009. click here.
|
|
C
A
S
I |
News |
Chart |
SEC
View all notes Alert
me of new notes
Company
Profile
|
HMSY
- NASDAQ
H M S Holdings Corp
COMPUTER SOFTWARE & SERVICES - Healthcare Information Service
|
$40.72
|
N/A
|
N/A
N/A
|
2/20/2009
(Date
Featured) |
$34.08
(Price
Featured) |
PP = $38.38 |
G |
| MB = $40.30 |
Most Recent Note - 6/30/2009 5:18:37 PM
G - A small loss on very light volume today, holding its ground near all-time highs above its "max buy" level. Color code was changed to green after rising up more than +5% from its latest base. Prior chart highs near $38 are an important support level to watch, where deterioration into its prior base would raise concerns. Gap up gain on 6/16/09 with heavy volume triggered a technical buy signal. No overhead supply is left to hinder the progress for this Commercial Services - Healthcare firm.
>>> The latest Featured Stock Update with an annotated graph appeared on 6/29/2009. click here.
|
|
C
A
S
I |
News |
Chart |
SEC
View all notes Alert
me of new notes
Company
Profile
|
LFT
-
|
$24.56
|
N/A
|
N/A
N/A
|
4/2/2009
(Date
Featured) |
$22.19
(Price
Featured) |
PP = $21.81 |
G |
| MB = $22.90 |
Most Recent Note - 6/30/2009 5:20:20 PM
G - Loss today on very light volume, staying under its 50 DMA line, raising concerns. Its progress could be hindered by future share offerings. This Chinese Computer Software firm recently filed a registration of approximately 16 million shares for resale, and it also revealed a planned acquisition of another Chinese service provider.
>>> The latest Featured Stock Update with an annotated graph appeared on 6/18/2009. click here.
|
|
C
A
S
I |
News |
Chart |
SEC
View all notes Alert
me of new notes
Company
Profile
|
NTES
- NASDAQ
Netease Inc Adr
INTERNET - Internet Information Providers
|
$35.18
|
N/A
|
N/A
N/A
|
5/21/2009
(Date
Featured) |
$31.19
(Price
Featured) |
PP = $32.75 |
G |
| MB = $34.39 |
Most Recent Note - 6/30/2009 5:22:44 PM
G - Consolidating toward its 50 DMA line and upward trendline, important support to watch above its prior chart highs in the $32 area. Its 5/28/09 gap up and considerable gain with +79% above average volume confirmed a technical buy signal as it rose above its pivot point. Indications of institutional (the I criteria) buying demand have been noted after earnings news on 5/20/09 a shakeout tested support near its 50 DMA line. First featured at $26.75 in the 3/31/09 CANSLIM.net Mid-Day Breakouts Report (read here). This high-ranked Chinese Internet - Content firm was also summarized in greater detail including an annotated graph in the April 2009 issue of CANSLIM.net News (read here).
>>> The latest Featured Stock Update with an annotated graph appeared on 6/30/2009. click here.
|
|
C
A
S
I |
News |
Chart |
SEC
View all notes Alert
me of new notes
Company
Profile
|
NVEC
- NASDAQ
N V E Corp
ELECTRONICS - Semiconductor - Specialized
|
$48.60
|
N/A
|
N/A
N/A
|
3/13/2009
(Date
Featured) |
$33.85
(Price
Featured) |
PP = $45.50 |
G |
| MB = $47.78 |
Most Recent Note - 6/30/2009 5:25:05 PM
G - Small gain on light volume today for a new high close above its "max buy" level. Color code was changed to green, and it is extended from a sound buy point. Its 6/19/09 gain with volume more than 2 times average helped it rise from an "ascending base" type pattern to a new 52-week high and multi-year high, triggering a technical buy signal. Sales increases in recent comparisons have been under the +25% guideline and still rather minuscule, leaving concerns, especially in the event of any hiccups. This is a reason to be especially disciplined about proper entries and exits.
>>> The latest Featured Stock Update with an annotated graph appeared on 6/23/2009. click here.
|
|
C
A
S
I |
News |
Chart |
SEC
View all notes Alert
me of new notes
Company
Profile
|
SNDA
-
|
$52.34
|
N/A
|
N/A
N/A
|
5/31/2009
(Date
Featured) |
$57.62
(Price
Featured) |
PP = $53.95 |
G |
| MB = $56.65 |
Most Recent Note - 6/30/2009 5:28:22 PM
G - Considerable loss today with very heavy volume indicated distributional pressure as it again violated its 50 DMA line and prior chart highs. Deterioration below its recent chart low near $50 would raise more serious concerns and trigger a worrisome technical sell signal. Detailed analysis was included when recently featured in the June 2009 issue of CANSLIM.net News. Be sure to review the "What to Look Out For" section and entire detailed summary - read here).
>>> The latest Featured Stock Update with an annotated graph appeared on 6/25/2009. click here.
|
|
C
A
S
I |
News |
Chart |
SEC
View all notes Alert
me of new notes
Company
Profile
|
SYNA
- NASDAQ
Synaptics Inc
COMPUTER SOFTWARE & SERVICES - Information Technology Service
|
$38.65
|
N/A
|
N/A
N/A
|
5/18/2009
(Date
Featured) |
$32.58
(Price
Featured) |
PP = $34.52 |
G |
| MB = $36.25 |
Most Recent Note - 6/30/2009 5:30:02 PM
G - Today was its 5th consecutive small gain on lighter than average volume, and has been drying up while consolidating in a tight range within close striking distance of all-time highs. Its August 2008 chart highs ($36), its 50 DMA line, and recent chart highs coincide to define an important support level. First featured in yellow in the May 18, 2009 mid-day report (read here). The number of top-rated funds owning its shares rose from 123 in June '08 to 197 in March '09, which is good news concerning the I criteria. Its annual earnings (the A criteria) history showed a dowturn in 2006, leaving concerns, but it followed that up with strong growth the next 2 years. Its small supply of shares (the S criteria) outstanding could contribute to especially great volatility in the event of institutional accumulation or distribution.
>>> The latest Featured Stock Update with an annotated graph appeared on 6/26/2009. click here.
|
|
C
A
S
I |
News |
Chart |
SEC
View all notes Alert
me of new notes
Company
Profile
|
TNDM
- NASDAQ
Tandem Diabetes Care Inc
TELECOMMUNICATIONS - Wireless Communications
|
$29.52
|
N/A
|
N/A
N/A
|
3/2/2009
(Date
Featured) |
$18.89
(Price
Featured) |
PP = $29.85 |
G |
| MB = $31.34 |
Most Recent Note - 6/30/2009 5:32:36 PM
G - Recently rebounded above its 50 DMA line. Its choppy chart offers no sound base per the investment system's guidelines. It traded up as much as +72.42% since first featured at $18.89 in the 3/02/09 Mid-Day BreakOuts Report (read here).
>>> The latest Featured Stock Update with an annotated graph appeared on 6/24/2009. click here.
|
|
C
A
S
I |
News |
Chart |
SEC
View all notes Alert
me of new notes
Company
Profile
|
|
|
|
THESE ARE NOT BUY RECOMMENDATIONS!
Comments contained in the body of this report are technical
opinions only. The material herein has been obtained
from sources believed to be reliable and accurate, however,
its accuracy and completeness cannot be guaranteed.
This site is not an investment advisor, hence it does
not endorse or recommend any securities or other investments.
Any recommendation contained in this report may not
be suitable for all investors and it is not to be deemed
an offer or solicitation on our part with respect to
the purchase or sale of any securities. All trademarks,
service marks and trade names appearing in this report
are the property of their respective owners, and are
likewise used for identification purposes only.
This report is a service available
only to active Paid Premium Members.
You may opt-out of receiving report notifications
at any time. Questions or comments may be submitted
by writing to Premium Membership Services 665 S.E. 10 Street, Suite 201 Deerfield Beach, FL 33441-5634 or by calling 1-800-965-8307
or 954-785-1121.
|
|
|


