You are not logged in.
This means you
CAN ONLY VIEW reports that were published prior to Saturday, October 19, 2024.
You
MUST UPGRADE YOUR MEMBERSHIP if you want to see any current reports.
AFTER MARKET UPDATE - FRIDAY, JUNE 29TH, 2012
Previous After Market Report Next After Market Report >>>
|
|
|
|
DOW |
+277.83 |
12,880.09 |
+2.20% |
|
Volume |
1,094,552,740 |
+21% |
|
Volume |
1,856,744,120 |
+9% |
|
NASDAQ |
+85.56 |
2,935.05 |
+3.00% |
|
Advancers |
2,729 |
85% |
|
Advancers |
2,177 |
82% |
|
S&P 500 |
+33.12 |
1,362.16 |
+2.49% |
|
Decliners |
395 |
12% |
|
Decliners |
377 |
14% |
|
Russell 2000 |
+22.60 |
798.49 |
+2.91% |
|
52 Wk Highs |
240 |
|
|
52 Wk Highs |
138 |
|
|
S&P 600 |
+12.96 |
445.43 |
+3.00% |
|
52 Wk Lows |
13 |
|
|
52 Wk Lows |
22 |
|
|
Carefully read the bold section of this commentary which again calls attention to a very important change in stance concerning the current market direction (M criteria). Also, please accept our apology while we are currently working to repair the archive report files after a problem prevented the publication of Thursday's After Market Update and also prevented the regular delivery of the evening's email notifications. Be sure to take time to watch the Q2 2012 WEBCAST which is now available "ON DEMAND" - CLICK HERE.
|
 |
Volume Driven Gains and Expansion in Leadership Reconfirms Rally
Kenneth J. Gruneisen - Passed the CAN SLIM® Master's Exam
For the week, the Dow Jones Industrial Average rose +1.9%, the S&P 500 Index gained nearly +2.0%, and the Nasdaq Composite Index posted a +1.5% gain. On Friday's session the indices posted a large follow-through day of gains reconfirming yet another strong rally and a favorable shift concerning the M criteria again. The volume totals were reported much higher than the prior session total on the NYSE and on the Nasdaq exchange, a sign that institutional buying was clearly helping the market roar higher. Breadth was solidly positive on the NYSE as advancers led decliners by nearly a 7-1 ratio, and advancers led decliners by nearly a 6-1 ratio on the Nasdaq exchange. The total number of new 52-week highs swelled, solidly leading new 52-week lows on the NYSE and on the Nasdaq exchange while there were the most new 52-week highs on the Nasdaq exchange since 4/27/12, and the most new highs on the NYSE since 2/03/12. There were 86 high-ranked companies from the CANSLIM.net Leaders List made new 52-week highs and appeared on the CANSLIM.net BreakOuts Page, better than quadrupling the prior session total of 21 stocks. At the session's close there were unanimous gains for all 20 high-ranked companies currently included on the Featured Stocks Page.

Tepid U.S. economic data had little effect after Chicago PMI topped expectations and Consumer Sentiment unexpectedly declined. Stocks posted impressive gains in Friday's session after European leaders surpassed the lowly expectations for their summit in Brussels. In the two-day meeting, the region's policymakers laid the groundwork for more direct funding measures to eurozone banks via the EU bailout fund. This unexpected result helped lift all 10 sectors on the S&P into the green.
Industrial and tech stocks were the top performers with Caterpillar Inc (CAT +2.76%) among the many issues which extended their gains into the closing bell. Apple Inc (AAPL +2.63%) finished higher. Energy stocks Exxon Mobil Corp (XOM +2.97%) and ConocoPhillips (COP +2.48%) also rallied after crude oil surged ahead by $7.08 to $84.77 per barrel. In other news, Research In Motion Ltd (RIMM -19.06%) fell following the blackberry maker's disappointing result in quarterly earnings.
Turning to the fixed income markets, Treasuries were lower as investors moved to riskier assets. The benchmark 10-year note was off 11/16 of a point to yield 1.65%.
Friday's considerable volume-driven gains for the major averages with higher volume and a huge expansion in leadership (stocks making new 52-week highs) has reconfirmed a new upward trend concerning the M criteria. New buying efforts are again encouraged under the fact-based system only in worthy buy candidates with strong fundamental and technical characteristics matching all key investment criteria. The best buy candidates identified by CANSLIM.net's experts are always viewable on the Featured Stocks page that summarizes all high-ranked leaders which have been shown in recent reports as particularly noteworthy and action worthy. As always, disciplined investors avoid chasing extended stocks, and they limit losses if any stock ever falls more than -7% from its purchase price.
You can watch the Q2 2012 WEBCAST which is now available "ON DEMAND" - CLICK HERE (upgraded members only). Upgraded members now get access to these informative *Quarterly Webcasts included at no additional cost. (*Previously sold separately at $99 per webcast.) Links to archived webcasts and all prior reports are on the Premium Member Homepage.
PICTURED: The benchmark S&P 500 Index's considerable +2.49% gain above its 50-day moving average (DMA) line with higher volume and a great expansion in leadership (stocks hitting new 52-week highs) reconfirmed a market rally (M criteria).
|
 Kenneth J. Gruneisen started out as a licensed stockbroker in August 1987, a couple of months prior to the historic stock market crash that took the Dow Jones Industrial Average down -22.6% in a single day. He has published daily fact-based fundamental and technical analysis on high-ranked stocks online for two decades. Through FACTBASEDINVESTING.COM, Kenneth provides educational articles, news, market commentary, and other information regarding proven investment systems that work in good times and bad.
Comments contained in the body of this report are technical opinions only and are not necessarily those of Gruneisen Growth Corp. The material herein has been obtained from sources believed to be reliable and accurate, however, its accuracy and completeness cannot be guaranteed. Our firm, employees, and customers may effect transactions, including transactions contrary to any recommendation herein, or have positions in the securities mentioned herein or options with respect thereto. Any recommendation contained in this report may not be suitable for all investors and it is not to be deemed an offer or solicitation on our part with respect to the purchase or sale of any securities. |
|
 |
Commodity-Linked Groups, Tech, Financial and Retail Indexes Rallied
Kenneth J. Gruneisen - Passed the CAN SLIM® Master's Exam
Commodity-linked groups posted big gains on Friday as the Gold & Silver Index ($XAU +3.34%), Integrated Oil Index ($XOI +3.50%), and Oil Services Index ($OSX +3.85%) each rallied more than +3%. The tech sector had a strong showing too as the Semiconductor Index ($SOX +4.35%), Networking Index ($NWX +3.69%), Internet Index ($IIX +3.59%), and Biotechnology Index ($BTK +2.50%) charged higher. Gains for the Retail Index ($RLX +2.81%) and strength in financial shares rounded out a largely positive session as the Bank Index ($BKX +2.69%) and Broker/Dealer Index ($XBD +2.88%) finished Friday's session with solid gains. Meanwhile, the Healthcare Index ($HMO -1.35%) was a standout laggard.
Charts courtesy www.stockcharts.com
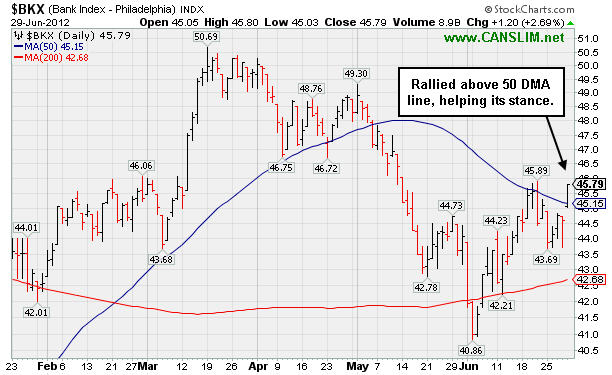
PICTURED: The Bank Index ($BKX +2.69%) rallied above its 50-day moving average (DMA) line helping its technical stance improve. This strong action bodes well as a leading indicator for the broader market.
| Oil Services |
$OSX |
201.36 |
+7.47 |
+3.85% |
-6.90% |
| Healthcare |
$HMO |
2,228.51 |
-30.61 |
-1.35% |
-2.33% |
| Integrated Oil |
$XOI |
1,165.53 |
+39.41 |
+3.50% |
-5.17% |
| Semiconductor |
$SOX |
385.46 |
+16.08 |
+4.35% |
+5.77% |
| Networking |
$NWX |
211.70 |
+7.53 |
+3.69% |
-1.61% |
| Internet |
$IIX |
300.99 |
+10.42 |
+3.59% |
+6.83% |
| Broker/Dealer |
$XBD |
87.82 |
+2.46 |
+2.88% |
+5.47% |
| Retail |
$RLX |
614.29 |
+16.78 |
+2.81% |
+17.41% |
| Gold & Silver |
$XAU |
157.54 |
+5.09 |
+3.34% |
-12.79% |
| Bank |
$BKX |
45.79 |
+1.20 |
+2.69% |
+16.28% |
| Biotech |
$BTK |
1,469.21 |
+35.88 |
+2.50% |
+34.61% |
|
|
|
 |
Confirming Gains With Volume Would Be Reassuring Sign
Kenneth J. Gruneisen - Passed the CAN SLIM® Master's Exam
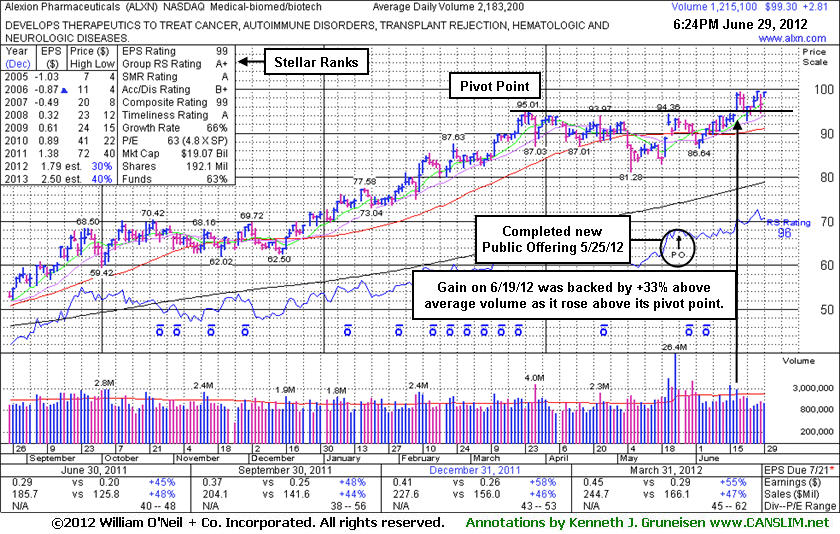
Alexion Pharmaceuticals (ALXN +$2.81 or +2.91% to $99.30) gapped up today for a gain with below average volume. It remains consolidating above its pivot point but below its "max buy" level following its 6/19/12 technical breakout with +33% above average volume, below the +40% above average volume threshold which is the bare minimum necessary to trigger a proper technical buy signal. Confirming volume-driven gains would be a welcome reassurance, however disciplined investors also know to avoid chasing stocks that get too extended from prior highs. A tactic called pyramiding which is taught in the Certification may be used to allow investors to let the market action dictate how heavily a stocks shares are accumulated while it is in the ideal range.
ALXN completed a new Public Offering on 5/25/12 and it is consolidating above its prior highs only -0.4% off its 52-week high. Prior resistance in the $94-95 area now defines initial chart support to watch. ALXN was last shown in this FSU section with an annotated graph on 5/31/12 under the headline, "Perched Near All-Time High Following Recent Share Offering". Its color code was changed to green after a subsequent loss on higher volume was a sign of distributional pressure as it violated important support at its 50-day moving average (DMA) line raising concerns and triggering a technical sell signal. However its resilience and prompt ability to rebound improved its outlook and its color code was changed to yellow again while continuing to build on its base.
The Medical - Biomed/Biotech industry group has demonstrated leadership and earned the best possible rank, 99, for its Group Relative Strength Rating, a reassuring sign concerning the L criteria. ALXN's Relative Strength Rank (96) remains high. It easily satisfies the C and A criteria with a very strong quarterly and annual earnings history which has earned it a highest possible 99 Earnings Per Share rank. The number of top-rated funds owning its shares rose from 842 in Mar '11 to 1,067 in Mar '12, a reassuring sign concerning the I criteria of the fact-based investment system. With the help of underwriters, its latest Public Offering may very likely have helped it attract additional ownership interest from the institutional crowd.
 |
|
|
Color Codes Explained :
Y - Better candidates highlighted by our
staff of experts.
G - Previously featured
in past reports as yellow but may no longer be buyable under the
guidelines.
***Last / Change / Volume data in this table is the closing quote data***
Symbol/Exchange
Company Name
Industry Group |
PRICE |
CHANGE
(%Change) |
Day High |
Volume
(% DAV)
(% 50 day avg vol) |
52 Wk Hi
% From Hi |
Featured
Date |
Price
Featured |
Pivot Featured |
|
Max Buy |
ALXN
-
NASDAQ
Alexion Pharmaceuticals
DRUGS - Drug Manufacturers - Other
|
$99.30
|
+2.81
2.91% |
$99.49
|
1,245,261
57.04% of 50 DAV
50 DAV is 2,183,200
|
$99.70
-0.40%
|
5/1/2012
|
$91.73
|
PP = $95.11
|
|
MB = $99.87
|
 Most Recent Note - 6/29/2012 5:34:56 PM
Y - Gapped up today for a gain with below average volume. It remains consolidating above its pivot point but below its "max buy" level following its 6/19/12 technical breakout with volume.
>>> The latest Featured Stock Update with an annotated graph appeared on 6/29/2012. Click here.
View all notes |
Alert me of new notes |
CANSLIM.net Company Profile |
SEC |
Zacks Reports |
StockTalk |
News |
Chart |
Request a new note
C
A N
S L
I M


|
ASPS
-
NASDAQ
Altisource Ptf Sltns Sa
REAL ESTATE - Property Management/Developmen
|
$73.23
|
+1.49
2.08% |
$73.23
|
101,708
72.70% of 50 DAV
50 DAV is 139,900
|
$72.61
0.85%
|
6/5/2012
|
$60.01
|
PP = $63.00
|
|
MB = $66.15
|
Most Recent Note - 6/29/2012 5:35:56 PM
G - Hit a new 52-week high today with a gain on below average volume. Previously noted - "Prior highs in the $65 area define initial support to watch on pullbacks, meanwhile it is getting extended from its prior base."
>>> The latest Featured Stock Update with an annotated graph appeared on 6/5/2012. Click here.
View all notes |
Alert me of new notes |
CANSLIM.net Company Profile |
SEC |
Zacks Reports |
StockTalk |
News |
Chart |
Request a new note
C
A N
S L
I M
|
CERN
-
NASDAQ
Cerner Corp
COMPUTER SOFTWARE and SERVICES - Healthcare Information Service
|
$82.66
|
+4.63
5.93% |
$82.66
|
2,394,114
158.68% of 50 DAV
50 DAV is 1,508,800
|
$88.32
-6.41%
|
6/7/2012
|
$78.36
|
PP = $84.20
|
|
MB = $88.41
|
Most Recent Note - 6/29/2012 5:44:17 PM
G - Considerable gap up gain with above average volume, rebounding above its 50 DMA line and helping its technical stance, however it has not formed a proper base since negating its prior breakout.
>>> The latest Featured Stock Update with an annotated graph appeared on 6/7/2012. Click here.
View all notes |
Alert me of new notes |
CANSLIM.net Company Profile |
SEC |
Zacks Reports |
StockTalk |
News |
Chart |
Request a new note
C
A N
S L
I M
|
CMCSA
-
NASDAQ
Comcast Corp Cl A
MEDIA - CATV Systems
|
$31.97
|
+1.09
3.54% |
$31.99
|
16,139,878
113.34% of 50 DAV
50 DAV is 14,240,300
|
$31.65
1.01%
|
6/11/2012
|
$29.94
|
PP = $30.98
|
|
MB = $32.53
|
Most Recent Note - 6/29/2012 5:46:49 PM
Y - Posted a big gain today with above average volume for a new 52-week high and finished at the session high, rallying unhindered by overhead supply and approaching its "max buy" level.
>>> The latest Featured Stock Update with an annotated graph appeared on 6/11/2012. Click here.
View all notes |
Alert me of new notes |
CANSLIM.net Company Profile |
SEC |
Zacks Reports |
StockTalk |
News |
Chart |
Request a new note
C
A N
S L
I M
|
CSTR
-
NASDAQ
Coinstar Inc
DIVERSIFIED SERVICES - Personal Services
|
$68.66
|
+2.26
3.40% |
$69.34
|
1,543,964
142.29% of 50 DAV
50 DAV is 1,085,100
|
$69.74
-1.55%
|
6/26/2012
|
$64.05
|
PP = $67.00
|
|
MB = $70.35
|
Most Recent Note - 6/29/2012 5:49:11 PM
Y - Gapped up today and posted a gain with +42% above average volume, near the bare minimum volume threshold, yet finishing above its pivot point confirming a technical buy signal.
>>> The latest Featured Stock Update with an annotated graph appeared on 6/26/2012. Click here.
View all notes |
Alert me of new notes |
CANSLIM.net Company Profile |
SEC |
Zacks Reports |
StockTalk |
News |
Chart |
Request a new note
C
A N
S L
I M
|
Symbol/Exchange
Company Name
Industry Group |
PRICE |
CHANGE
(%Change) |
Day High |
Volume
(% DAV)
(% 50 day avg vol) |
52 Wk Hi
% From Hi |
Featured
Date |
Price
Featured |
Pivot Featured |
|
Max Buy |
DG
-
NYSE
Dollar General Corp
RETAIL - Discount, Variety Stores
|
$54.39
|
+0.66
1.23% |
$54.69
|
3,181,004
84.85% of 50 DAV
50 DAV is 3,748,800
|
$55.30
-1.65%
|
5/7/2012
|
$48.51
|
PP = $47.69
|
|
MB = $50.07
|
Most Recent Note - 6/29/2012 5:49:58 PM
G - Hovering near its all-time high, extended from its prior base. Completed another Secondary Offering on 6/05/12, its 4th Secondary Offering since September '11.
>>> The latest Featured Stock Update with an annotated graph appeared on 6/12/2012. Click here.
View all notes |
Alert me of new notes |
CANSLIM.net Company Profile |
SEC |
Zacks Reports |
StockTalk |
News |
Chart |
Request a new note
C
A N
S L
I M
|
ECHO
-
NASDAQ
Echo Global Logistics
DIVERSIFIED SERVICES - Business/Management Services
|
$19.06
|
+0.40
2.14% |
$19.25
|
194,048
189.32% of 50 DAV
50 DAV is 102,500
|
$19.38
-1.65%
|
6/22/2012
|
$18.98
|
PP = $19.48
|
|
MB = $20.45
|
Most Recent Note - 6/29/2012 5:51:18 PM
Y - Gapped up today and posted a gain with +89% above average volume. Faces little resistance due to overhead supply while perched within close striking distance of its 52-week high. Disciplined investors may watch for a volume-driven gain above its pivot point to trigger a technical buy signal before action is justified under the fact-based system.
>>> The latest Featured Stock Update with an annotated graph appeared on 6/22/2012. Click here.
View all notes |
Alert me of new notes |
CANSLIM.net Company Profile |
SEC |
Zacks Reports |
StockTalk |
News |
Chart |
Request a new note
C
A N
S L
I M
|
EXPE
-
NASDAQ
Expedia Inc
INTERNET - Internet Information Providers
|
$48.07
|
+1.86
4.03% |
$48.52
|
3,498,857
74.52% of 50 DAV
50 DAV is 4,695,100
|
$50.66
-5.11%
|
4/27/2012
|
$41.80
|
PP = $35.57
|
|
MB = $37.35
|
Most Recent Note - 6/29/2012 5:52:45 PM
G - Consolidating above its 50 DMA line, it finished -5.1% off its 52-week high following a gap up gain with below average volume today. It is extended from its prior highs in the $43 area and its 50 DMA line which define support.
>>> The latest Featured Stock Update with an annotated graph appeared on 6/8/2012. Click here.
View all notes |
Alert me of new notes |
CANSLIM.net Company Profile |
SEC |
Zacks Reports |
StockTalk |
News |
Chart |
Request a new note
C
A N
S L
I M
|
GNC
-
NYSE
G N C Holdings Inc
RETAIL - Drug Stores
|
$39.20
|
+1.53
4.06% |
$39.27
|
3,588,024
151.44% of 50 DAV
50 DAV is 2,369,200
|
$41.95
-6.56%
|
6/29/2012
|
$39.20
|
PP = $40.00
|
|
MB = $42.00
|
Most Recent Note - 6/29/2012 5:57:23 PM
Y - A volume-driven gain above its 50 DMA line helped its technical stance, yet subsequent volume-driven gains above the pivot point are still needed to confirm a new technical buy signal. Color code is changed to yellow while it is building on a 10-week "double bottom" type base. New pivot point cited is based upon its 5/29/12 high.
>>> The latest Featured Stock Update with an annotated graph appeared on 6/6/2012. Click here.
View all notes |
Alert me of new notes |
CANSLIM.net Company Profile |
SEC |
Zacks Reports |
StockTalk |
News |
Chart |
Request a new note
C
A N
S L
I M
|
GPX
-
NYSE
G P Strategies Corp
DIVERSIFIED SERVICES - Education and Training Services
|
$18.47
|
+0.69
3.88% |
$18.49
|
128,954
232.77% of 50 DAV
50 DAV is 55,400
|
$18.05
2.33%
|
6/29/2012
|
$18.01
|
PP = $18.15
|
|
MB = $19.06
|
Most Recent Note - 6/29/2012 6:01:10 PM
Y - Finished above the pivot point and closed near the session high with a large gain backed by +132% above average volume triggering a technical buy signal. It was highlighted earlier in the mid-day report (read here) while on track for its 4th consecutive gain and noted - "It cleared a valid base earlier this week with volume-driven gains and no overhead supply remains. Quarterly earnings increases above the +25% guideline in the 8 latest quarterly comparisons through Dec '11 satisfy the C criteria. Recent cluster of Insider buying in May-Jun looks similar to that which was reported in Nov, Dec, and Jan as it rose toward and above prior resistance in the $14 area. Prior reports cautioned - 'Recent quarterly comparisons show improving sales revenues and earnings increases but its annual earnings (A criteria) history falls below the investment system's guidelines.'"

There are no Featured Stock Updates™ available for this stock at this time. You may request one by clicking the Request a New Note link below
View all notes |
Alert me of new notes |
CANSLIM.net Company Profile |
SEC |
Zacks Reports |
StockTalk |
News |
Chart |
Request a new note
C
A N
S L
I M
|
Symbol/Exchange
Company Name
Industry Group |
PRICE |
CHANGE
(%Change) |
Day High |
Volume
(% DAV)
(% 50 day avg vol) |
52 Wk Hi
% From Hi |
Featured
Date |
Price
Featured |
Pivot Featured |
|
Max Buy |
MLNX
-
NASDAQ
Mellanox Technologies
ELECTRONICS - Semiconductor - Broad Line
|
$70.82
|
+4.11
6.16% |
$70.97
|
736,873
102.57% of 50 DAV
50 DAV is 718,400
|
$74.27
-4.64%
|
6/18/2012
|
$70.90
|
PP = $67.30
|
|
MB = $70.67
|
Most Recent Note - 6/29/2012 6:03:46 PM
G - Tallied a solid gain with higher volume after gapping up today. Closed near the session high and finished above its "max buy" level, and its color code is changed to green. Its recent chart lows define support to watch above its 50 DMA line.
>>> The latest Featured Stock Update with an annotated graph appeared on 6/25/2012. Click here.
View all notes |
Alert me of new notes |
CANSLIM.net Company Profile |
SEC |
Zacks Reports |
StockTalk |
News |
Chart |
Request a new note
C
A N
S L
I M
|
N
-
NYSE
Netsuite Inc
DIVERSIFIED SERVICES - Business/Management Services
|
$54.77
|
+2.99
5.77% |
$54.80
|
634,612
115.66% of 50 DAV
50 DAV is 548,700
|
$54.27
0.92%
|
6/20/2012
|
$51.83
|
PP = $51.88
|
|
MB = $54.47
|
Most Recent Note - 6/29/2012 6:05:36 PM
G - Finished near the session high as a solid gain today lifted it above its "max buy" level, and its color code is changed to green. No resistance remains due to overhead supply.
>>> The latest Featured Stock Update with an annotated graph appeared on 6/20/2012. Click here.
View all notes |
Alert me of new notes |
CANSLIM.net Company Profile |
SEC |
Zacks Reports |
StockTalk |
News |
Chart |
Request a new note
C
A N
S L
I M
|
NSM
-
NYSE
Nationstar Mtg Hldgs Inc
FINANCIAL SERVICES - Credit Services
|
$21.52
|
+0.50
2.38% |
$21.64
|
578,256
80.59% of 50 DAV
50 DAV is 717,500
|
$21.20
1.51%
|
6/27/2012
|
$20.29
|
PP = $20.46
|
|
MB = $21.48
|
Most Recent Note - 6/29/2012 6:08:42 PM
G - Hit yet another new 52-week high today with lighter volume behind a 3rd consecutive gain lifting it just above its "max buy" level. Color code is changed to green, and disciplined investors do not chase extended stocks more than +5% above their pivot point. Prior highs in the $20 area define important support to watch on pullbacks.
>>> The latest Featured Stock Update with an annotated graph appeared on 6/27/2012. Click here.
View all notes |
Alert me of new notes |
CANSLIM.net Company Profile |
SEC |
Zacks Reports |
StockTalk |
News |
Chart |
Request a new note
C
A N
S L
I M
|
NTES
-
NASDAQ
Netease Inc Adr
INTERNET - Internet Information Providers
|
$58.85
|
+0.77
1.33% |
$59.73
|
561,115
76.05% of 50 DAV
50 DAV is 737,800
|
$65.54
-10.21%
|
3/19/2012
|
$56.18
|
PP = $55.10
|
|
MB = $57.86
|
Most Recent Note - 6/29/2012 6:09:21 PM
G - Small gain on light volume today, still sputtering below its 50 DMA line which has acted as resistance after a damaging violation triggered a technical sell signal. Gains above its 50 DMA line are needed for its technical stance and outlook to be considered favorable again. Found support near prior lows in the $55 area.
>>> The latest Featured Stock Update with an annotated graph appeared on 6/19/2012. Click here.
View all notes |
Alert me of new notes |
CANSLIM.net Company Profile |
SEC |
Zacks Reports |
StockTalk |
News |
Chart |
Request a new note
C
A N
S L
I M
|
SWI
-
NYSE
Solarwinds Inc
COMPUTER SOFTWARE and SERVICES - Application Software
|
$43.56
|
+1.37
3.25% |
$43.69
|
1,123,093
103.51% of 50 DAV
50 DAV is 1,085,000
|
$48.64
-10.44%
|
4/26/2012
|
$45.15
|
PP = $42.32
|
|
MB = $44.44
|
Most Recent Note - 6/29/2012 6:10:40 PM
G - Gapped up today yet it remains below its 50 DMA line. A rebound above that short-term average would help its technical stance. The previously noted 6/04/11 low ($41.24) defines important support to watch.
>>> The latest Featured Stock Update with an annotated graph appeared on 6/15/2012. Click here.
View all notes |
Alert me of new notes |
CANSLIM.net Company Profile |
SEC |
Zacks Reports |
StockTalk |
News |
Chart |
Request a new note
C
A N
S L
I M
|
Symbol/Exchange
Company Name
Industry Group |
PRICE |
CHANGE
(%Change) |
Day High |
Volume
(% DAV)
(% 50 day avg vol) |
52 Wk Hi
% From Hi |
Featured
Date |
Price
Featured |
Pivot Featured |
|
Max Buy |
SXCI
-
NASDAQ
S X C Health Solutions
COMPUTER SOFTWARE and SERVICES - Healthcare Information Service
|
$99.21
|
+4.36
4.60% |
$99.88
|
1,246,120
112.11% of 50 DAV
50 DAV is 1,111,500
|
$103.97
-4.58%
|
6/14/2012
|
$94.71
|
PP = $100.60
|
|
MB = $105.63
|
Most Recent Note - 6/29/2012 6:12:31 PM
Y - Gapped up and posted a solid gain today with near average but higher volume. Little resistance remains. Still watching for gains above its pivot point to clinch a convincing technical buy signal.
>>> The latest Featured Stock Update with an annotated graph appeared on 6/14/2012. Click here.
View all notes |
Alert me of new notes |
CANSLIM.net Company Profile |
SEC |
Zacks Reports |
StockTalk |
News |
Chart |
Request a new note
C
A N
S L
I M
|
TDG
-
NYSE
Transdigm Group Inc
AEROSPACE/DEFENSE - Aerospace/Defense Products and; Services
|
$134.30
|
+6.73
5.28% |
$134.43
|
732,795
131.51% of 50 DAV
50 DAV is 557,200
|
$132.69
1.21%
|
6/18/2012
|
$127.00
|
PP = $132.79
|
|
MB = $139.43
|
Most Recent Note - 6/29/2012 6:14:41 PM
Y - Today's gain above its pivot point was backed by only +32% above average volume, below the minimum threshold need to trigger a proper new (or add-on) technical buy signal. Its 50 DMA line defines important support to watch.
>>> The latest Featured Stock Update with an annotated graph appeared on 6/18/2012. Click here.
View all notes |
Alert me of new notes |
CANSLIM.net Company Profile |
SEC |
Zacks Reports |
StockTalk |
News |
Chart |
Request a new note
C
A N
S L
I M
|
TNGO
-
NASDAQ
Tangoe Inc
COMPUTER SOFTWARE and SERVICES - Technical and System Software
|
$21.31
|
+0.96
4.72% |
$21.34
|
684,683
122.11% of 50 DAV
50 DAV is 560,700
|
$23.05
-7.55%
|
6/27/2012
|
$21.70
|
PP = $23.15
|
|
MB = $24.31
|
Most Recent Note - 6/29/2012 6:17:46 PM
Y - Rebounded above its 50 DMA line today with a gap up gain backed by above average volume indicative of institutional support near that important short-term average. Color code is changed to yellow again based on its resilience. Gains above the pivot point backed by +40% above average volume or greater could trigger a new technical buy signal.
>>> The latest Featured Stock Update with an annotated graph appeared on 6/28/2012. Click here.
View all notes |
Alert me of new notes |
CANSLIM.net Company Profile |
SEC |
Zacks Reports |
StockTalk |
News |
Chart |
Request a new note
C
A N
S L
I M
|
VSI
-
NYSE
Vitamin Shoppe Inc
SPECIALTY RETAIL - Specialty Retail, Other
|
$54.93
|
+2.38
4.53% |
$55.35
|
437,474
86.42% of 50 DAV
50 DAV is 506,200
|
$55.29
-0.65%
|
6/29/2012
|
$54.93
|
PP = $55.03
|
|
MB = $57.78
|
Most Recent Note - 6/29/2012 6:22:34 PM
Y - Gap up gain today with below average volume led to its best-ever close and a new 52-week high. A new pivot point is cited based on its 6/22/12 high after forming an 8-week cup-with-handle base. Volume-driven gains above its pivot may clinch a new (or add-on) technical buy signal.
>>> The latest Featured Stock Update with an annotated graph appeared on 6/4/2012. Click here.
View all notes |
Alert me of new notes |
CANSLIM.net Company Profile |
SEC |
Zacks Reports |
StockTalk |
News |
Chart |
Request a new note
C
A N
S L
I M
|
WFM
-
NASDAQ
Whole Foods Market Inc
RETAIL - Grocery Stores
|
$95.32
|
+1.60
1.71% |
$95.90
|
2,392,908
118.64% of 50 DAV
50 DAV is 2,016,900
|
$97.25
-1.98%
|
6/13/2012
|
$89.90
|
PP = $91.60
|
|
MB = $96.18
|
Most Recent Note - 6/29/2012 6:24:00 PM
Y - Hovering near its 52-week high today with no resistance remaining due to overhead supply. Its prior highs in the $91.50 area define initial support to watch on pullbacks.
>>> The latest Featured Stock Update with an annotated graph appeared on 6/13/2012. Click here.
View all notes |
Alert me of new notes |
CANSLIM.net Company Profile |
SEC |
Zacks Reports |
StockTalk |
News |
Chart |
Request a new note
C
A N
S L
I M
|
Symbol/Exchange
Company Name
Industry Group |
PRICE |
CHANGE
(%Change) |
Day High |
Volume
(% DAV)
(% 50 day avg vol) |
52 Wk Hi
% From Hi |
Featured
Date |
Price
Featured |
Pivot Featured |
|
Max Buy |
|
|
|
THESE ARE NOT BUY RECOMMENDATIONS!
Comments contained in the body of this report are technical
opinions only. The material herein has been obtained
from sources believed to be reliable and accurate, however,
its accuracy and completeness cannot be guaranteed.
This site is not an investment advisor, hence it does
not endorse or recommend any securities or other investments.
Any recommendation contained in this report may not
be suitable for all investors and it is not to be deemed
an offer or solicitation on our part with respect to
the purchase or sale of any securities. All trademarks,
service marks and trade names appearing in this report
are the property of their respective owners, and are
likewise used for identification purposes only.
This report is a service available
only to active Paid Premium Members.
You may opt-out of receiving report notifications
at any time. Questions or comments may be submitted
by writing to Premium Membership Services 665 S.E. 10 Street, Suite 201 Deerfield Beach, FL 33441-5634 or by calling 1-800-965-8307
or 954-785-1121.
|
|
|

