You are not logged in.
This means you
CAN ONLY VIEW reports that were published prior to Monday, April 14, 2025.
You
MUST UPGRADE YOUR MEMBERSHIP if you want to see any current reports.
AFTER MARKET UPDATE - MONDAY, JUNE 29TH, 2009
Previous After Market Report Next After Market Report >>>
|
|
|
|
DOW |
+90.99 |
8,529.38 |
+1.08% |
|
Volume |
1,064,442,110 |
-55% |
|
Volume |
2,076,667,020 |
-43% |
|
NASDAQ |
+5.84 |
1,844.06 |
+0.32% |
|
Advancers |
1,841 |
59% |
|
Advancers |
1,224 |
43% |
|
S&P 500 |
+8.33 |
927.23 |
+0.91% |
|
Decliners |
1,168 |
37% |
|
Decliners |
1,497 |
53% |
|
Russell 2000 |
-2.61 |
510.61 |
-0.51% |
|
52 Wk Highs |
22 |
|
|
52 Wk Highs |
43 |
|
|
S&P 600 |
-0.13 |
269.36 |
-0.05% |
|
52 Wk Lows |
6 |
|
|
52 Wk Lows |
6 |
|
|
 |
Major Averages Rise On Quieter Volume
Adam Sarhan, Contributing Writer,
The major averages ended higher, adding to the best quarterly advance for the S&P 500 Index since 1998! The small-cap indices lagged. As expected, volume totals were lower compared to Friday's artificially high levels (Russell Indexes' re-balancing). Advancers led decliners by nearly a 2-to-1 ratio on the NYSE and trailed by a 4-to-5 ratio on the Nasdaq exchange. There were 17 high-ranked companies from the CANSLIM.net Leaders List that made a new 52-week high and appeared on the CANSLIM.net BreakOuts Page, one less than the 18 issues that appeared on the prior session. There has been a welcome improvement in recent days, while an even greater expansion in the new highs list in the weeks ahead would offer more encouraging news for growth oriented investors.
The benchmark S&P 500 Index has surged over +16% in the second quarter, which is one of its strongest quarterly advances in 11 years! The other major averages have also enjoyed huge moves up from their March lows and are currently perched below longer-term resistance levels. Last week's CANSLIM.net Second Quarter Webcast took a close look at how the market topped in October 2007 and all of the important events occurring in 2008 and this far in 2009. More specifically, the webcast showed viewers exactly what has happened since the March 12, 2009 follow-through day. To view the webcast On-Demand click (here).
Economists now believe that the worst of the recession is behind us, which has set the stage for the powerful rally we have experienced in the second quarter. A flurry of stronger than expected economic data also provided fuel for the market's robust rally. The Federal Reserve Bank of Boston President Eric Rosengren said, US GDP "is expected to start being positive in the second half of this year." When questioned about unemployment he said, "The unemployment rate is likely to lag so that the peak in the unemployment rate is likely to be sometime early next year." Rosengren spoke in Brussels today.
Money Management Services - STOP WAITING; ACT NOW!- Open An Account today!
After remaining in cash from May 2008-May 2009, protecting clients' assets for the sharp sell-off that occurred in the latter half of 2008, our team of disciplined investment experts has been putting sidelined cash back to work in worthwhile opportunities in recent weeks. You may inquire about having your account professionally managed using this fact-based investment system by clicking HERE. *Accounts over $250,000 please. ** Serious inquiries only.
PICTURED: The Dow Jones Industrial Average closed Mondays session below its downward trend line, an ongoing resistance level.
|
|
|
 |
Bank Index's 5th Consecutive Gain Leads To Close Above 50-Day Average
Kenneth J. Gruneisen - Passed the CAN SLIM® Master's Exam
Gains from the influential Bank ($BKX +1.59%), Broker/Dealer ($XBD +0.59%), and Retail ($RLX +0.63%) indexes helped underpin the major averages as they closed modestly higher on Monday. The Networking Index ($NWX +0.63%) posted a modest gain while the Internet ($IIX -0.05%), Semiconductor ($SOX -0.05%), and Biotechnology ($BTK +0.06%) indexes ended essentially flat for the session. The Integrated Oil Index ($XOI +1.51%) ended higher while the Gold & Silver ($XAU -0.11%) and Oil Services ($OSX +0.05%) indexes showed no decisive direction. Meanwhile, the Healthcare ($HMO -0.68%) group lagged.
Charts courtesy www.stockcharts.com

PICTURED: The Bank Index ($BKX +1.59%) closed Moday's session just above its 50-day moving average (DMA) line with a 5th consecutive small gain.
| Oil Services |
$OSX |
162.05 |
+0.08 |
+0.05% |
+33.50% |
| Healthcare |
$HMO |
1,116.76 |
-7.64 |
-0.68% |
+16.31% |
| Integrated Oil |
$XOI |
925.79 |
+13.78 |
+1.51% |
-5.50% |
| Semiconductor |
$SOX |
262.92 |
-0.13 |
-0.05% |
+23.92% |
| Networking |
$NWX |
187.43 |
+1.18 |
+0.63% |
+30.26% |
| Internet |
$IIX |
188.11 |
-0.10 |
-0.05% |
+40.62% |
| Broker/Dealer |
$XBD |
99.85 |
+0.59 |
+0.59% |
+28.89% |
| Retail |
$RLX |
324.91 |
+2.02 |
+0.63% |
+16.35% |
| Gold & Silver |
$XAU |
143.64 |
-0.16 |
-0.11% |
+15.98% |
| Bank |
$BKX |
36.99 |
+0.58 |
+1.59% |
-16.54% |
| Biotech |
$BTK |
701.60 |
+0.40 |
+0.06% |
+8.41% |
|
|
|
 |
Healthcare Firm Quietly Rises Further From Prior Base
Kenneth J. Gruneisen - Passed the CAN SLIM® Master's Exam
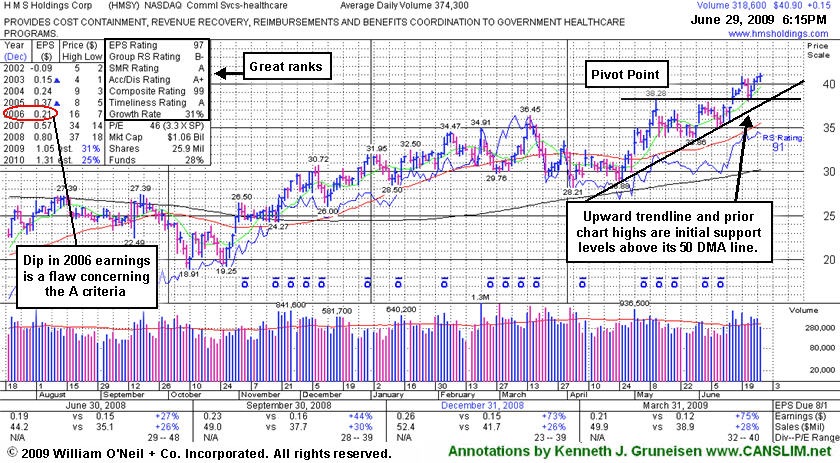
HMS Holdings Corp (HMSY +$0.15 or +0.37% to $40.90) posted a fourth consecutive gain, on lighter volume today, helped it reach a new all-time high and close above its "max buy" level. Its color code was changed to green after rising up more than +5% from its latest base. Disciplined investors avoid chasing stocks that are too extended from a sound base.
Prior chart highs near $38 are an important support level to watch, where deterioration into its prior base would raise concerns. A gap up gain on 6/16/09 with heavy volume triggered a technical buy signal. No overhead supply is left to hinder the progress for this Commercial Services - Healthcare firm. During its latest base its daily volume totals dried up, yet the volume behind its breakout to new highs (the N criteria) day was nearly two and a half times its average volume total. The heavy volume and gap up also provided a nice reassurance of institutional (the I criteria) buying demand.
A downturn in 2006 earnings (see red circle) is a fundamental flaw in HMS Holdings Corp's annual earnings history that raises some concerns with respect to the A criteria of the investment system. Investors' odds are usually better with a company that has a steady 3-5 year earnings growth history. This stock was first featured on Friday, February 20, 2009 in the CANSLIM.net Mid Day Breakouts Report (read here), then dropped from the Featured Stocks list on 4/02/09 due to weak action, returning yet again in yellow in the mid-day report on 5/01/09.
|
|
|
Color Codes Explained :
Y - Better candidates highlighted by our
staff of experts.
G - Previously featured
in past reports as yellow but may no longer be buyable under the
guidelines.
***Last / Change / Volume quote data in this table corresponds with the timestamp on the note***
Symbol/Exchange
Company Name
Industry Group |
Last |
Chg. |
Vol
% DAV |
Date Featured |
Price Featured |
Latest Pivot Point
Featured |
Status |
| Latest Max Buy Price |
GMCR
- NASDAQ
Green Mtn Coffee Roastrs
FOOD & BEVERAGE - Processed & Packaged Goods
|
$58.56
|
N/A
|
N/A
N/A
|
1/1/2008
(Date
Featured) |
$27.13
(Price
Featured) |
PP = $28.66 |
G |
| MB = $30.09 |
Most Recent Note - 6/29/2009 5:52:11 PM
G - Gapped up today for solid gain on average volume while consolidating above its 50 DMA line -important support to watch. On 6/09/09 it reached a new all-time high with a gain on light volume as a 3:2 stock split took effect. GMCR traded up more than +144% since appearing with an annotated graph under the headline "It May Soon Be Time To Go Green" when featured in the January 2009 CANSLIM.net News (read here).
>>> The latest Featured Stock Update with an annotated graph appeared on 6/22/2009. click here.
|
|
C
A
S
I |
News |
Chart |
SEC
View all notes Alert
me of new notes
Company
Profile
|
HMSY
- NASDAQ
H M S Holdings Corp
COMPUTER SOFTWARE & SERVICES - Healthcare Information Service
|
$40.90
|
N/A
|
N/A
N/A
|
2/20/2009
(Date
Featured) |
$34.08
(Price
Featured) |
PP = $38.38 |
G |
| MB = $40.30 |
Most Recent Note - 6/29/2009 5:53:24 PM
G - A fourth consecutive gain, on lighter volume today, helped it reach a new all-time high and close above its "max buy" level. Color code was changed to green after rising up more than +5% from its latest base. Prior chart highs near $38 are an important support level to watch, where deterioration into its prior base would raise concerns. Gap up gain on 6/16/09 with heavy volume triggered a technical buy signal. No overhead supply is left to hinder the progress for this Commercial Services - Healthcare firm.
>>> The latest Featured Stock Update with an annotated graph appeared on 6/29/2009. click here.
|
|
C
A
S
I |
News |
Chart |
SEC
View all notes Alert
me of new notes
Company
Profile
|
LFT
-
|
$24.71
|
N/A
|
N/A
N/A
|
4/2/2009
(Date
Featured) |
$22.19
(Price
Featured) |
PP = $21.81 |
G |
| MB = $22.90 |
Most Recent Note - 6/29/2009 6:03:14 PM
G - Loss today on lighter volume led to another close back under its 50 DMA line, raising concerns. Its progress could be hindered by future share offerings. This Chinese Computer Software firm recently filed a registration of approximately 16 million shares for resale, and it also revealed a planned acquisition of another Chinese service provider.
>>> The latest Featured Stock Update with an annotated graph appeared on 6/18/2009. click here.
|
|
C
A
S
I |
News |
Chart |
SEC
View all notes Alert
me of new notes
Company
Profile
|
NTES
- NASDAQ
Netease Inc Adr
INTERNET - Internet Information Providers
|
$35.96
|
N/A
|
N/A
N/A
|
5/21/2009
(Date
Featured) |
$31.19
(Price
Featured) |
PP = $32.75 |
G |
| MB = $34.39 |
Most Recent Note - 6/29/2009 6:05:43 PM
G - Pulling back from near all-time highs while consolidating above its 50 DMA line and prior chart highs -important support to watch. Its 5/28/09 gap up and considerable gain with +79% above average volume confirmed a technical buy signal as it rose above its pivot point. Indications of institutional (the I criteria) buying demand have been noted after earnings news on 5/20/09 a shakeout tested support near its 50 DMA line. First featured at $26.75 in the 3/31/09 CANSLIM.net Mid-Day Breakouts Report (read here). This high-ranked Chinese Internet - Content firm was also summarized in greater detail including an annotated graph in the April 2009 issue of CANSLIM.net News (read here).
>>> The latest Featured Stock Update with an annotated graph appeared on 6/19/2009. click here.
|
|
C
A
S
I |
News |
Chart |
SEC
View all notes Alert
me of new notes
Company
Profile
|
NVEC
- NASDAQ
N V E Corp
ELECTRONICS - Semiconductor - Specialized
|
$48.44
|
N/A
|
N/A
N/A
|
3/13/2009
(Date
Featured) |
$33.85
(Price
Featured) |
PP = $45.50 |
G |
| MB = $47.78 |
Most Recent Note - 6/29/2009 6:06:53 PM
G - Held its ground today near its 52-week high above its "max buy" level. Color code was changed to green, and it is extended from a sound buy point. Its 6/19/09 gain with volume more than 2 times average helped it rise from an "ascending base" type pattern to a new 52-week high and multi-year high, triggering a technical buy signal. Sales increases in recent comparisons have been under the +25% guideline and still rather minuscule, leaving concerns, especially in the event of any hiccups. This is a reason to be especially disciplined about proper entries and exits.
>>> The latest Featured Stock Update with an annotated graph appeared on 6/23/2009. click here.
|
|
C
A
S
I |
News |
Chart |
SEC
View all notes Alert
me of new notes
Company
Profile
|
SNDA
-
|
$55.70
|
N/A
|
N/A
N/A
|
5/31/2009
(Date
Featured) |
$57.62
(Price
Featured) |
PP = $53.95 |
G |
| MB = $56.65 |
Most Recent Note - 6/29/2009 6:09:50 PM
G - Considerable loss today with above average volume pressured it back toward its 50 DMA line and prior chart highs. Any deterioration below its recent chart low near $50 would raise more serious concerns and trigger a worrisome technical sell signal. Its color code was changed to green after its latest bounce back above its "max buy" level. Detailed analysis was included when recently featured in the June 2009 issue of CANSLIM.net News. Be sure to review the "What to Look Out For" section and entire detailed summary - read here).
>>> The latest Featured Stock Update with an annotated graph appeared on 6/25/2009. click here.
|
|
C
A
S
I |
News |
Chart |
SEC
View all notes Alert
me of new notes
Company
Profile
|
SYNA
- NASDAQ
Synaptics Inc
COMPUTER SOFTWARE & SERVICES - Information Technology Service
|
$38.31
|
N/A
|
N/A
N/A
|
5/18/2009
(Date
Featured) |
$32.58
(Price
Featured) |
PP = $34.52 |
G |
| MB = $36.25 |
Most Recent Note - 6/29/2009 6:15:21 PM
G - Volume has been drying up while consolidating within close striking distance of all-time highs. Its August 2008 chart highs ($36), its 50 DMA line, and recent chart highs coincide to define an important support level. First featured in yellow in the May 18, 2009 mid-day report (read here). The number of top-rated funds owning its shares rose from 123 in June '08 to 196 in March '09, which is good news concerning the I criteria. Its annual earnings (the A criteria) history showed a dowturn in 2006, leaving concerns, but it followed that up with strong growth the next 2 years. Its small supply of shares (the S criteria) outstanding could contribute to especially great volatility in the event of institutional accumulation or distribution.
>>> The latest Featured Stock Update with an annotated graph appeared on 6/26/2009. click here.
|
|
C
A
S
I |
News |
Chart |
SEC
View all notes Alert
me of new notes
Company
Profile
|
TNDM
- NASDAQ
Tandem Diabetes Care Inc
TELECOMMUNICATIONS - Wireless Communications
|
$31.21
|
N/A
|
N/A
N/A
|
3/2/2009
(Date
Featured) |
$18.89
(Price
Featured) |
PP = $29.85 |
G |
| MB = $31.34 |
Most Recent Note - 6/29/2009 6:17:41 PM
G - Gain on light volume today for its second best close ever, added to Friday's gain backed by more than three times average volume. Recently rebounding above its 50 DMA line, however a sound new base needs to form before new buying efforts might be justified under the investment system's guidelines. It traded up as much as +72.42% since first featured at $18.89 in the 3/02/09 Mid-Day BreakOuts Report (read here).
>>> The latest Featured Stock Update with an annotated graph appeared on 6/24/2009. click here.
|
|
C
A
S
I |
News |
Chart |
SEC
View all notes Alert
me of new notes
Company
Profile
|
|
|
|
THESE ARE NOT BUY RECOMMENDATIONS!
Comments contained in the body of this report are technical
opinions only. The material herein has been obtained
from sources believed to be reliable and accurate, however,
its accuracy and completeness cannot be guaranteed.
This site is not an investment advisor, hence it does
not endorse or recommend any securities or other investments.
Any recommendation contained in this report may not
be suitable for all investors and it is not to be deemed
an offer or solicitation on our part with respect to
the purchase or sale of any securities. All trademarks,
service marks and trade names appearing in this report
are the property of their respective owners, and are
likewise used for identification purposes only.
This report is a service available
only to active Paid Premium Members.
You may opt-out of receiving report notifications
at any time. Questions or comments may be submitted
by writing to Premium Membership Services 665 S.E. 10 Street, Suite 201 Deerfield Beach, FL 33441-5634 or by calling 1-800-965-8307
or 954-785-1121.
|
|
|


