You are not logged in.
This means you
CAN ONLY VIEW reports that were published prior to Wednesday, April 23, 2025.
You
MUST UPGRADE YOUR MEMBERSHIP if you want to see any current reports.
AFTER MARKET UPDATE - FRIDAY, JUNE 28TH, 2013
Previous After Market Report Next After Market Report >>>
|
|
|
|
DOW |
-114.89 |
14,909.60 |
-0.76% |
|
Volume |
1,754,562,280 |
+138% |
|
Volume |
2,463,826,140 |
+53% |
|
NASDAQ |
+1.39 |
3,403.25 |
+0.04% |
|
Advancers |
1,541 |
49% |
|
Advancers |
1,322 |
51% |
|
S&P 500 |
-6.92 |
1,606.28 |
-0.43% |
|
Decliners |
1,488 |
48% |
|
Decliners |
1,180 |
46% |
|
Russell 2000 |
-2.44 |
977.48 |
-0.25% |
|
52 Wk Highs |
88 |
|
|
52 Wk Highs |
126 |
|
|
S&P 600 |
-1.88 |
550.52 |
-0.34% |
|
52 Wk Lows |
26 |
|
|
52 Wk Lows |
27 |
|
|
 |
Major Averages' Monthly Retreat Coupled With "Correction" in Market
Kenneth J. Gruneisen - Passed the CAN SLIM® Master's Exam
Thanks to this week’s rebound, the major averages pared their monthly losses. In June, the Dow Jones Industrial Average was down -1.4% while the S&P 500 Index and the Nasdaq Composite Index fell -1.5%. The monthly retreat did not hold back equities in the second quarter with the Dow advancing +2.3%, the S&P 500 rising +2.4% and the Nasdaq gaining +4.2%. The indices ended Friday's trading session mostly lower, yet up from the morning's lows. The session's volume totals were reported very heavy and up substantially from the prior session totals on the NYSE and on the Nasdaq exchange. Breadth was narrowly positive as advancers outnumbered decliners on the NYSE and on the Nasdaq exchange. There were 41 high-ranked companies from the CANSLIM.net Leaders List made new 52-week highs and appeared on the CANSLIM.net BreakOuts Page, up from the prior session total of 36 stocks. The list of stocks hitting new 52-week highs easily outnumbered new 52-week lows on both the NYSE and the Nasdaq exchange. There were gains for only 2 of the 8 high-ranked companies currently included on the Featured Stocks Page, a disconcertingly negative bias for the list which has waned in recent weeks.
The Nasdaq Composite Index rebounded and ended above its 50-day moving average (DMA) line while the...
The major averages recovered from their early morning lows following more regional Fed comments that supported the continuation of current policies. Six of the 10 sectors finished lower led by declines in financial stocks including Bank of America Corp (BAC -1.15%). On the earnings front, disappointing results from Blackberry (BBRY -27.76%) sent the stock substantially lower.
Turning to fixed income, Treasuries ended mixed. The benchmark 10-year note fell 7/32 to yield 2.49% and the 30-bond rose over 1/2 of a point to yield 3.50%.
Disciplined investors will note that the window is now open for the market (M criteria) to produce a follow-through day within the most ideal period between days 4-7 of a new rally attempt. In spite of the recent rebound there is still a need for caution until a new rally is confirmed by a proper follow-through day (FTD) of meaningful gains (+1.4% or greater) from at least one of the major averages on higher volume coupled with an expansion in leadership (stocks hitting new 52-week highs).
Upcoming CANSLIM.net reports will observe and explain any noteworthy shifts in the market direction (M criteria) while especially highlighting the characteristics and important details in the bold portion of this commentary. Regular readers are aware via prior reports since early June repeatedly reminding members - "Be protective of any gains, and limit losses! Be especially watchful for any individual issues flashing technical sell signals. It is vitally important to your success with the fact-based investment system to reduce exposure and preserve cash during market downdrafts."
Individual leaders best matching the winning models of the fact-based investment system are on the Featured Stocks Page - with our Certified experts' latest notes and links to additional resources including detailed analysis with annotated graphs. The Premium Member Homepage - includes "dynamic archives" to all prior pay reports published. Watch for an announcement via email concerning the next WEBCAST.
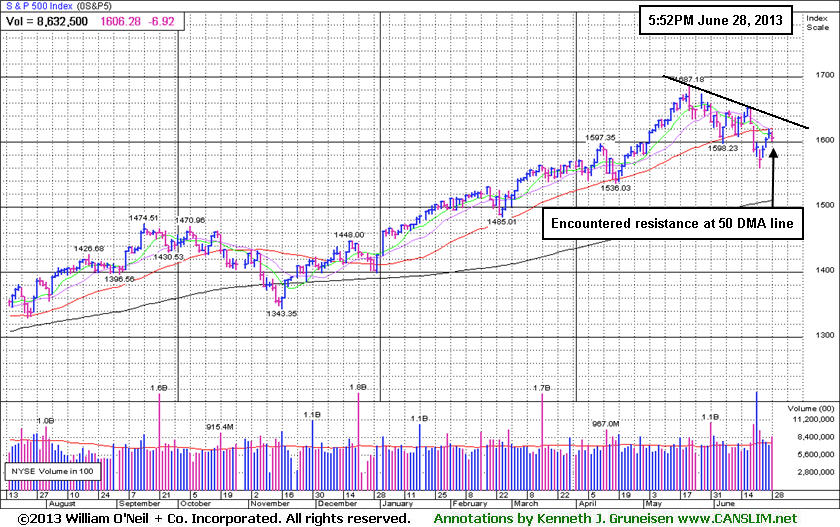
PICTURED: The S&P 500 Index encountered resistance at its 50-day moving average (DMA) line and volume increased behind Friday's loss. Gains above that important short-term average are needed to help the benchmark index's technical stance improve. It also faces resistance at a near-term downward trendline. Monday marks Day 5 of the current rally attempt, a rally attempt that will remain valid unless the Day 1 lows ($1,577.09 on 6/25/13) are violated which would clearly indicate deterioration and signal that the correction is worsening. Careful chart readers will notice that the volume totals were below average behind the latest gains following damaging losses with much heavier above-average volume totals.
|
 Kenneth J. Gruneisen started out as a licensed stockbroker in August 1987, a couple of months prior to the historic stock market crash that took the Dow Jones Industrial Average down -22.6% in a single day. He has published daily fact-based fundamental and technical analysis on high-ranked stocks online for two decades. Through FACTBASEDINVESTING.COM, Kenneth provides educational articles, news, market commentary, and other information regarding proven investment systems that work in good times and bad.
Comments contained in the body of this report are technical opinions only and are not necessarily those of Gruneisen Growth Corp. The material herein has been obtained from sources believed to be reliable and accurate, however, its accuracy and completeness cannot be guaranteed. Our firm, employees, and customers may effect transactions, including transactions contrary to any recommendation herein, or have positions in the securities mentioned herein or options with respect thereto. Any recommendation contained in this report may not be suitable for all investors and it is not to be deemed an offer or solicitation on our part with respect to the purchase or sale of any securities. |
|
 |
Most Groups Edged Lower or Held Steady as XAU Bounced Back
Kenneth J. Gruneisen - Passed the CAN SLIM® Master's Exam
The Gold & Silver Index ($XAU +6.88%) was a standout gainer as it bounced back from its lows by recovering nearly +7% on the session. Financial shares were a negative influence on the major averages on Friday as the Broker/Dealer Index ($XBD -0.70%) and the Bank Index ($BKX -0.63%) both fell. The Retail Index ($RLX +0.27%) and the Semiconductor Index ($SOX +0.36%) eked out small gains, however the rest of the tech sector created a drag with losses from the Internet Index ($IIX -0.68%), Biotechnology Index ($BTK -0.47%), and the Networking Index ($NWX -0.25%). There was mild weakness in energy-related shares as the Integrated Oil Index ($XOI -0.42%) and Oil Services Index ($OSX -0.22%) ended with modest losses. The Healthcare Index ($HMO -0.17%) suffered a tiny loss.
Charts courtesy www.stockcharts.com
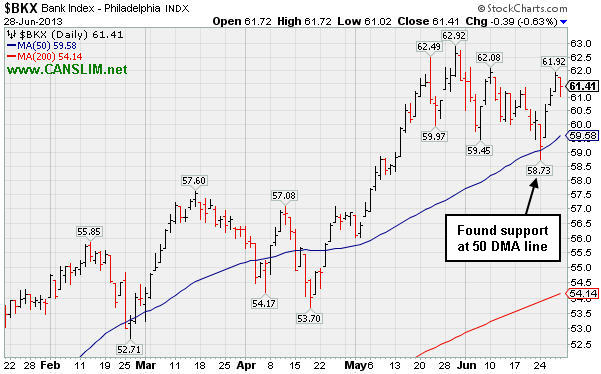
PICTURED: The Bank Index ($BKX -0.63%) recently found support at its 50-day moving average (DMA) line, an encouraging characteristic from an influential financial group. Regular readers know that the financial group has long been relied upon as an important "leading indicator" for the broader market outlook.
| Oil Services |
$OSX |
252.87 |
-0.55 |
-0.22% |
+14.86% |
| Healthcare |
$HMO |
3,222.48 |
-5.49 |
-0.17% |
+28.17% |
| Integrated Oil |
$XOI |
1,329.77 |
-5.57 |
-0.42% |
+7.08% |
| Semiconductor |
$SOX |
468.43 |
+1.69 |
+0.36% |
+21.97% |
| Networking |
$NWX |
258.61 |
-0.65 |
-0.25% |
+14.15% |
| Internet |
$IIX |
377.35 |
-2.59 |
-0.68% |
+15.40% |
| Broker/Dealer |
$XBD |
125.46 |
-0.88 |
-0.70% |
+33.00% |
| Retail |
$RLX |
788.37 |
+2.15 |
+0.27% |
+20.72% |
| Gold & Silver |
$XAU |
90.15 |
+5.80 |
+6.88% |
-45.56% |
| Bank |
$BKX |
61.41 |
-0.39 |
-0.63% |
+19.75% |
| Biotech |
$BTK |
1,956.26 |
-9.27 |
-0.47% |
+26.45% |
|
|
|
 |
Distributional Action Leads to Slump Below 50-Day Average
Kenneth J. Gruneisen - Passed the CAN SLIM® Master's Exam
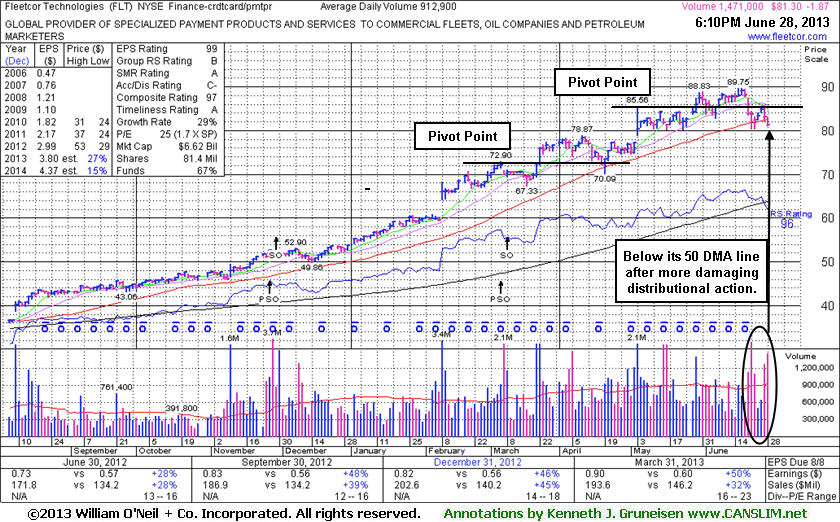
FleetCor Technologies, Inc. (FLT -$1.87 or -2.25% to $81.30) endured distributional pressure and ended the week below its 50-day moving (DMA) line, raising concerns. The recent low ($80.28 on 6/21/13) defines important near-term chart support where a subsequent violation may trigger a more worrisome technical sell signal. It was last shown in this FSU section on 6/18/13 with an annotated graph under the headline, "Wedging Higher on Track for 9th Weekly Gain". Very soon thereafter volume-driven losses negated its prior breakout from a late-stage base. Disciplined investors always limit losses by selling any stock that falls more than -7% from their purchase price.
It reported earnings +50% on +32% sales for the Mar '13 quarter, marking its 5th consecutive quarterly comparison with earnings above the +25% guideline (C criteria). The company completed another Secondary Offering on 3/08/13 after a streak of volume-driven gains into new high territory. On 3/14/12, 6/11/12, and 11/29/12 it priced Secondary Offerings and it was previously noted, "Such offerings often are a short-term hindrance to upward price progress yet typically result in broader institutional ownership interest."
The number of top-rated funds owning its shares rose from 193 in Mar '12 to 365 in Mar '13, a reassuring sign concerning the I criteria. Its current Up/Down Volume Ratio of 1.2 is still hinting that its shares have been under accumulation over the past 50 days. The company hails from the Finance - Credit Card Payment Processing group which currently has a mediocre 61 Group Relative Strength Rating, however impressive strength and leadership from a couple of other firms in the same industry group is considered sufficient reassurance concerning the L criteria.
|
|
|
Color Codes Explained :
Y - Better candidates highlighted by our
staff of experts.
G - Previously featured
in past reports as yellow but may no longer be buyable under the
guidelines.
***Last / Change / Volume data in this table is the closing quote data***
Symbol/Exchange
Company Name
Industry Group |
PRICE |
CHANGE
(%Change) |
Day High |
Volume
(% DAV)
(% 50 day avg vol) |
52 Wk Hi
% From Hi |
Featured
Date |
Price
Featured |
Pivot Featured |
|
Max Buy |
AMBA
-
NASDAQ
Ambarella Inc
ELECTRONICS - Semiconductor - Specialized
|
$16.83
|
+0.65
4.02% |
$16.90
|
1,434,917
128.09% of 50 DAV
50 DAV is 1,120,200
|
$18.58
-9.42%
|
5/6/2013
|
$15.31
|
PP = $16.10
|
|
MB = $16.91
|
Most Recent Note - 6/27/2013 7:07:24 PM
Y - Consolidating above its 50 DMA line - important chart support where a violation would trigger a worrisome technical sell signal. See the latest FSU analysis for more details and a new annotated graph.
>>> The latest Featured Stock Update with an annotated graph appeared on 6/27/2013. Click here.
View all notes |
Alert me of new notes |
CANSLIM.net Company Profile |
SEC |
Zacks Reports |
StockTalk |
News |
Chart |
Request a new note
C
A N
S L
I M


|
EQM
-
NYSE
E Q T Midstream Partners
ENERGY - Oil and Gas Pipelines
|
$48.85
|
-1.63
-3.23% |
$50.40
|
410,398
301.10% of 50 DAV
50 DAV is 136,300
|
$51.72
-5.55%
|
4/25/2013
|
$40.16
|
PP = $40.84
|
|
MB = $42.88
|
 Most Recent Note - 6/28/2013 6:40:51 PM
G - Endured a loss on heavy volume, retreating from its 52-week high. Extended from any sound base. Its 50 DMA line defines important near-term support above recent lows in the $45 area.
>>> The latest Featured Stock Update with an annotated graph appeared on 6/21/2013. Click here.
View all notes |
Alert me of new notes |
CANSLIM.net Company Profile |
SEC |
Zacks Reports |
StockTalk |
News |
Chart |
Request a new note
C
A N
S L
I M
|
FLT
-
NYSE
Fleetcor Technologies
DIVERSIFIED SERVICES - Business/Management Services
|
$81.30
|
-1.87
-2.25% |
$83.18
|
1,396,712
153.00% of 50 DAV
50 DAV is 912,900
|
$89.75
-9.42%
|
5/29/2013
|
$86.02
|
PP = $85.66
|
|
MB = $89.94
|
Most Recent Note - 6/28/2013 6:25:18 PM
G- Endured distributional pressure and slumped to close the week below its 50 DMA line raising concerns and its color code is changed to green. See the latest FSU analysis for more details and a new annotated graph.
>>> The latest Featured Stock Update with an annotated graph appeared on 6/28/2013. Click here.
View all notes |
Alert me of new notes |
CANSLIM.net Company Profile |
SEC |
Zacks Reports |
StockTalk |
News |
Chart |
Request a new note
C
A N
S L
I M
|
LOPE
-
NASDAQ
Grand Canyon Education
DIVERSIFIED SERVICES - Education and; Training Services
|
$32.23
|
+0.31
0.97% |
$32.57
|
511,301
127.19% of 50 DAV
50 DAV is 402,000
|
$34.07
-5.40%
|
6/19/2013
|
$31.47
|
PP = $34.17
|
|
MB = $35.88
|
Most Recent Note - 6/28/2013 6:26:16 PM
Y - Tallied a gain today backed by above average volume. Consolidating above its 50 DMA line and well above additional support at prior highs in the $27 area. Subsequent volume driven gains above its pivot point may trigger a new technical buy signal.
>>> The latest Featured Stock Update with an annotated graph appeared on 6/19/2013. Click here.
View all notes |
Alert me of new notes |
CANSLIM.net Company Profile |
SEC |
Zacks Reports |
StockTalk |
News |
Chart |
Request a new note
C
A N
S L
I M
|
PRAA
-
NASDAQ
Portfolio Recovery Assoc
DIVERSIFIED SERVICES - Business/Management Services
|
$153.63
|
-2.86
-1.83% |
$156.83
|
200,531
248.18% of 50 DAV
50 DAV is 80,800
|
$163.87
-6.25%
|
5/1/2013
|
$130.77
|
PP = $127.88
|
|
MB = $134.27
|
Most Recent Note - 6/28/2013 6:41:46 PM
G - Endured a loss on heavy volume. Extended from any sound base, it rallied with no resistance due to overhead supply. Its 50 DMA line defines important near-term chart support.
>>> The latest Featured Stock Update with an annotated graph appeared on 6/25/2013. Click here.
View all notes |
Alert me of new notes |
CANSLIM.net Company Profile |
SEC |
Zacks Reports |
StockTalk |
News |
Chart |
Request a new note
C
A N
S L
I M
|
Symbol/Exchange
Company Name
Industry Group |
PRICE |
CHANGE
(%Change) |
Day High |
Volume
(% DAV)
(% 50 day avg vol) |
52 Wk Hi
% From Hi |
Featured
Date |
Price
Featured |
Pivot Featured |
|
Max Buy |
PRLB
-
NYSE
Proto Labs Inc
MANUFACTURING - Small Tools and Accessories
|
$64.97
|
-1.41
-2.12% |
$67.40
|
1,328,333
268.46% of 50 DAV
50 DAV is 494,800
|
$67.31
-3.47%
|
6/17/2013
|
$59.37
|
PP = $59.94
|
|
MB = $62.94
|
Most Recent Note - 6/28/2013 6:44:15 PM
G- Ended near the session low with a loss on heavy volume, encountering distributional pressure after a "negative reversal" at its 52-week high. Found prompt support near prior highs.
>>> The latest Featured Stock Update with an annotated graph appeared on 6/26/2013. Click here.
View all notes |
Alert me of new notes |
CANSLIM.net Company Profile |
SEC |
Zacks Reports |
StockTalk |
News |
Chart |
Request a new note
C
A N
S L
I M
|
RRTS
-
NYSE
Roadrunner Trans Systems
TRANSPORTATION - Air Delivery and Freight Service
|
$27.84
|
-0.14
-0.50% |
$28.47
|
327,292
165.05% of 50 DAV
50 DAV is 198,300
|
$29.52
-5.69%
|
4/3/2013
|
$22.77
|
PP = $23.75
|
|
MB = $24.94
|
Most Recent Note - 6/25/2013 5:44:55 PM
G - Posted a gain today with below average volume following a streak of 6 losses after a "negative reversal" at its 52-week high. Fundamental concerns were raised by its sub par earnings increase in the Mar '13 quarter.
>>> The latest Featured Stock Update with an annotated graph appeared on 6/20/2013. Click here.
View all notes |
Alert me of new notes |
CANSLIM.net Company Profile |
SEC |
Zacks Reports |
StockTalk |
News |
Chart |
Request a new note
C
A N
S L
I M
|
VRX
-
NYSE
Valeant Pharmaceuticals
DRUGS - Drug Manufacturers - Other
|
$86.08
|
-0.07
-0.08% |
$86.78
|
1,510,195
73.84% of 50 DAV
50 DAV is 2,045,200
|
$96.25
-10.57%
|
4/30/2013
|
$60.24
|
PP = $76.66
|
|
MB = $80.49
|
Most Recent Note - 6/24/2013 5:44:12 PM
G- Completed a new Public Offering on 6/18/13 following recent M&A news. Concerns were raised by its sub par Mar '13 earnings report. See latest FSU analysis for more details and a new annotated graph.
>>> The latest Featured Stock Update with an annotated graph appeared on 6/24/2013. Click here.
View all notes |
Alert me of new notes |
CANSLIM.net Company Profile |
SEC |
Zacks Reports |
StockTalk |
News |
Chart |
Request a new note
C
A N
S L
I M
|
|
|
|
THESE ARE NOT BUY RECOMMENDATIONS!
Comments contained in the body of this report are technical
opinions only. The material herein has been obtained
from sources believed to be reliable and accurate, however,
its accuracy and completeness cannot be guaranteed.
This site is not an investment advisor, hence it does
not endorse or recommend any securities or other investments.
Any recommendation contained in this report may not
be suitable for all investors and it is not to be deemed
an offer or solicitation on our part with respect to
the purchase or sale of any securities. All trademarks,
service marks and trade names appearing in this report
are the property of their respective owners, and are
likewise used for identification purposes only.
This report is a service available
only to active Paid Premium Members.
You may opt-out of receiving report notifications
at any time. Questions or comments may be submitted
by writing to Premium Membership Services 665 S.E. 10 Street, Suite 201 Deerfield Beach, FL 33441-5634 or by calling 1-800-965-8307
or 954-785-1121.
|
|
|

