You are not logged in.
This means you
CAN ONLY VIEW reports that were published prior to Monday, April 14, 2025.
You
MUST UPGRADE YOUR MEMBERSHIP if you want to see any current reports.
AFTER MARKET UPDATE - THURSDAY, JUNE 28TH, 2012
Previous After Market Report Next After Market Report >>>
|
|
|
|
DOW |
-24.75 |
12,602.26 |
-0.20% |
|
Volume |
906,616,360 |
+32% |
|
Volume |
1,706,306,610 |
+7% |
|
NASDAQ |
-25.83 |
2,849.49 |
-0.90% |
|
Advancers |
1,706 |
54% |
|
Advancers |
958 |
37% |
|
S&P 500 |
-2.81 |
1,329.04 |
-0.21% |
|
Decliners |
1,332 |
42% |
|
Decliners |
1,537 |
59% |
|
Russell 2000 |
-0.35 |
775.89 |
-0.05% |
|
52 Wk Highs |
81 |
|
|
52 Wk Highs |
41 |
|
|
S&P 600 |
+0.47 |
432.47 |
+0.11% |
|
52 Wk Lows |
38 |
|
|
52 Wk Lows |
61 |
|
|
Carefully read the bold section of this commentary which again calls attention to a very important change in stance concerning the current market direction (M criteria). Also, please accept our apology while we are currently working to repair the archive report files after a problem prevented the publication of Thursday's After Market Update and also prevented the regular delivery of the evening's email notifications. Be sure to take time to watch the Q2 2012 WEBCAST which is now available "ON DEMAND" - CLICK HERE.
|
 |
Indices Ended Above Session Lows With Losses on Higher Volume
Kenneth J. Gruneisen - Passed the CAN SLIM® Master's Exam
Markets closed with modest losses after a late session rally on Thursday. Volume was reported higher than the prior session total on the NYSE and on the Nasdaq exchange. Breadth was positive on the NYSE as advancers led decliners by better about a 3-2 ratio, however decliners led advancers by more than a 3-2 ratio on the Nasdaq exchange. The total number of new 52-week highs also trumped new 52-week lows on the NYSE, but new lows held the lead on the Nasdaq exchange. There were 21 high-ranked companies from the CANSLIM.net Leaders List made new 52-week highs and appeared on the CANSLIM.net BreakOuts Page, down from the prior session total of 38 stocks. At the session's close there were gains for only 4 of the 19 high-ranked companies currently included on the Featured Stocks Page.
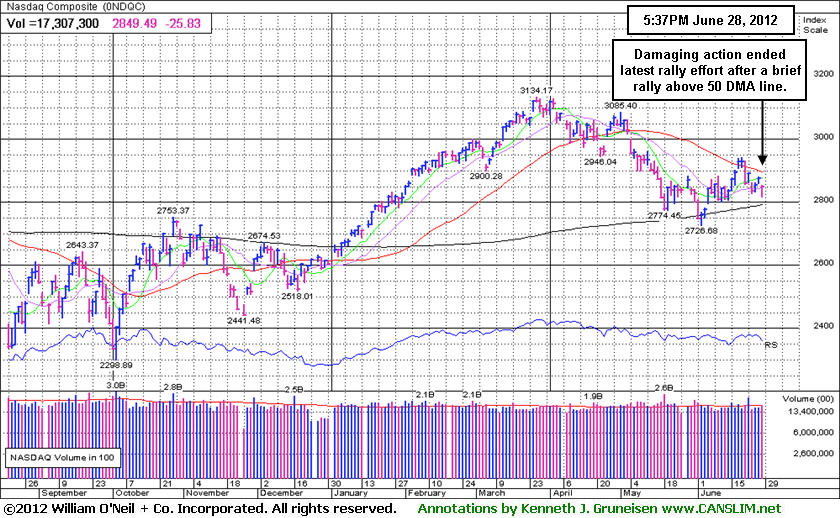
The Dow Jones Industrial Average was lower by 25 points to 12,602 after being down as many as 176 points in early action. Stocks were lower throughout the session following the Supreme Court's decision to uphold the Obama healthcare laws. Despite investors' concerns, the major averages pared their losses in the closing hour of trading on speculation that Germany was leaning toward Eurobond issuance to combat the region's debt crisis.
The healthcare sector was active as investors looked to capitalize on the high court's ruling. Aetna Inc (AET -2.71%), Wellpoint Inc (WLP -5.17%) and other insurers moved lower on concerns of rising costs. On the upside, hospital operators rallied on the prospects of increased Medicaid subsidies. Health Management Associates Inc (HMA +8.87%) and HCA Holdings Inc (HCA +10.75%), Molina Healthcare Inc (MOH +8.3%) and Amerigroup (AGP +4.92%) posted large gains.
On the earnings front, Family Dollar Inc (FDO -2.79%) fell after the company posted a disappointing profit tally. In other news, Vertex Pharmaceuticals Incorporated (VRTX -16.25%) fell the most in more than four years after releasing combination data on its cystic fibrosis drug that analysts found difficult to compare.
In bondland, Treasuries were higher along the curve with the 10-year note up 5/16 to yield 1.59%.
The major averages' (M criteria) latest rally has faltered and failed. Along with it comes a suggestion that investors should currently have a bias toward raising cash and selling any stocks showing signs of weakness. New buying efforts shall again be discouraged under the fact-based system until the market produces another convincing follow-through day of volume-backed big gains. As always, disciplined investors limit losses if any stock ever falls more than -7% from its purchase price.
The Q2 2012 Webcast is now available for viewing "ON DEMAND" by all members who have the UPGRADED membership. Upgraded members now get access to these informative *Quarterly Webcasts included at no additional cost. (*Previously sold separately at $99 per webcast.) Links to archived webcasts and all prior reports are on the Premium Member Homepage.
PICTURED: The Nasdaq Composite Index gapped down today. The tech-heavy index has endured damaging losses following a short-lived rally above its 50-day moving average line.
|
 Kenneth J. Gruneisen started out as a licensed stockbroker in August 1987, a couple of months prior to the historic stock market crash that took the Dow Jones Industrial Average down -22.6% in a single day. He has published daily fact-based fundamental and technical analysis on high-ranked stocks online for two decades. Through FACTBASEDINVESTING.COM, Kenneth provides educational articles, news, market commentary, and other information regarding proven investment systems that work in good times and bad.
Comments contained in the body of this report are technical opinions only and are not necessarily those of Gruneisen Growth Corp. The material herein has been obtained from sources believed to be reliable and accurate, however, its accuracy and completeness cannot be guaranteed. Our firm, employees, and customers may effect transactions, including transactions contrary to any recommendation herein, or have positions in the securities mentioned herein or options with respect thereto. Any recommendation contained in this report may not be suitable for all investors and it is not to be deemed an offer or solicitation on our part with respect to the purchase or sale of any securities. |
|
 |
Tech Sector and Gold & Silver Index Led Group Losses
Kenneth J. Gruneisen - Passed the CAN SLIM® Master's Exam
The tech sector had a tough day as the Biotechnology Index ($BTK -2.78%), Networking Index ($NWX -1.34%), Internet Index ($IIX -1.31%), and Semiconductor Index ($SOX -0.63%) finished with unanimous losses. The Retail Index ($RLX -0.55%) and Bank Index ($BKX -0.36%) ended with modest losses while the Broker/Dealer Index ($XBD +0.47%) tallied a small gain. Energy-related shares had a slightly positive bias as the Integrated Oil Index ($XOI +0.46%) and the Oil Services Index ($OSX +0.60%) posted modest gains. The Healthcare Index ($HMO +0.84%) tallied a win.
Charts courtesy www.stockcharts.com
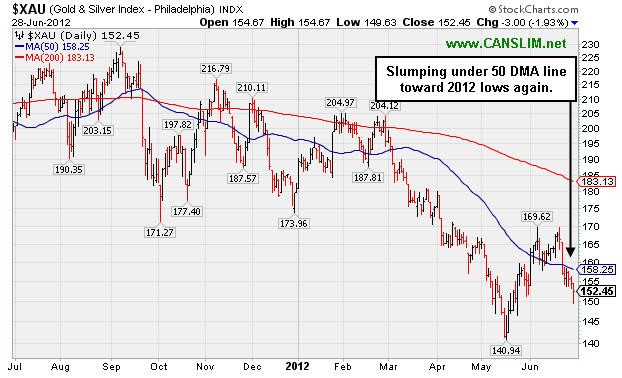
PICTURED: The Gold & Silver Index ($XAU -1.93%) suffered a big loss that punished defensively positioned investors. It is slumping below its 50 DMA line toward 2012 lows again.
|
|
|
 |
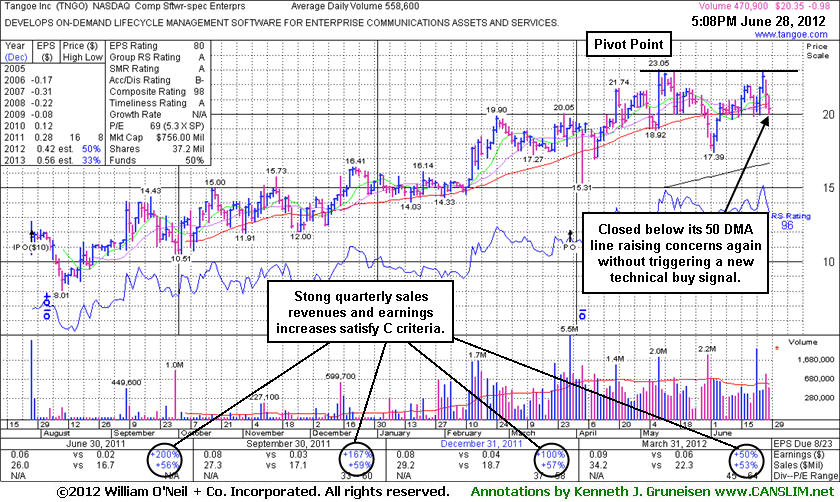
Failed to Trigger New Buy Signal Since Returning
Kenneth J. Gruneisen - Passed the CAN SLIM® Master's Exam
Often, when a leading stock is setting up to breakout of a solid base it is highlighted in CANSLIM.net's Mid-Day Breakouts Report. The most relevant factors are noted in the report which alerts prudent CANSLIM oriented investors to place the issue in their watch list. After doing any necessary backup research, the investor is prepared to act after the stock triggers a technical buy signal (breaks above its pivot point on more than +50% average turnover) but before it gets too extended from a sound base. In the event the stock fails to trigger a technical buy signal and its price declines then it will simply be removed from the watch list. Disciplined investors know to buy as near as possible to the pivot point and avoid chasing stocks after they have rallied more than +5% above their pivot point. It is crucial to always limit losses whenever any stock heads the wrong direction, and disciplined investors sell if a struggling stock ever falls more than -7% from their purchase price.
Tangoe Inc (TNGO -$0.98 or -4.59% to $20.35) fell and closed below its 50-day moving average (DMA) line today, raising concerns without triggering a new technical buy signal, and its color code was changed to green. It returned to the Featured Stocks list as it was highlighted in yellow in the 6/27/12 mid-day report (read here) with new pivot point cited based on its 5/09/12 high plus 10 cents and it was noted - "Little resistance remains due to overhead supply and a volume-driven gain above its pivot point may trigger a new technical buy signal. Based on poor technical action when last noted on 6/01/12 it was dropped from the Featured Stocks list. However, it subsequently rebounded above its 50 DMA line and showed resilience near that important short-term average in recent weeks."
Broader market conditions (M criteria) also argue against any new buying efforts until a new confirmed rally with follow-through day. TNGO was last shown in this FSU section on 5/25/12 with an annotated graph under the headline, "Volume Drying Up While Consolidating Above Chart Support". It completed a new Public Offering on 3/29/12, and such offerings can have a near-term effect of hindering price progress. Meanwhile, underwriters often help the company attract more institutional interest through the process. The number of top-rated funds owning its shares rose from 99 in Sep '11 to 181 in Mar '12, a reassuring sign concerning the I criteria. The company's management reportedly own 37% of its shares, keeping the directors motivated to look after and build shareholder value. There still are only 23.4 million shares (S criteria) in the publicly traded float following the latest offering, which can lead to more drastic price volatility in the event of institutional buying or selling. The bullish characteristics are an encouraging match with winning models of the fact-based system which went on to produce great gains. Typically the best winners advanced over a period of 6-18 months and offered multiple entry points within the investment system's guidelines.
|
|
|
Color Codes Explained :
Y - Better candidates highlighted by our
staff of experts.
G - Previously featured
in past reports as yellow but may no longer be buyable under the
guidelines.
***Last / Change / Volume data in this table is the closing quote data***
|
|
|
THESE ARE NOT BUY RECOMMENDATIONS!
Comments contained in the body of this report are technical
opinions only. The material herein has been obtained
from sources believed to be reliable and accurate, however,
its accuracy and completeness cannot be guaranteed.
This site is not an investment advisor, hence it does
not endorse or recommend any securities or other investments.
Any recommendation contained in this report may not
be suitable for all investors and it is not to be deemed
an offer or solicitation on our part with respect to
the purchase or sale of any securities. All trademarks,
service marks and trade names appearing in this report
are the property of their respective owners, and are
likewise used for identification purposes only.
This report is a service available
only to active Paid Premium Members.
You may opt-out of receiving report notifications
at any time. Questions or comments may be submitted
by writing to Premium Membership Services 665 S.E. 10 Street, Suite 201 Deerfield Beach, FL 33441-5634 or by calling 1-800-965-8307
or 954-785-1121.
|
|
|

