***Last / Change / Volume data in this table is the closing quote data***
Symbol/Exchange
Company Name
Industry Group |
PRICE |
CHANGE
(%Change) |
Day High |
Volume
(% DAV)
(% 50 day avg vol) |
52 Wk Hi
% From Hi |
Featured
Date |
Price
Featured |
Pivot Featured |
|
Max Buy |
ALXN
-
NASDAQ
Alexion Pharmaceuticals
DRUGS - Drug Manufacturers - Other
|
$99.46
|
+2.08
2.14% |
$99.70
|
1,153,996
53.28% of 50 DAV
50 DAV is 2,166,000
|
$99.41
0.05%
|
5/1/2012
|
$91.73
|
PP = $95.11
|
|
MB = $99.87
|
 Most Recent Note - 6/27/2012 5:56:49 PM
Y - Posted a gain today with light volume for a new high and best-ever close. It remains consolidating above its pivot point but below its "max buy" level following its 6/19/12 technical breakout with volume.
>>> The latest Featured Stock Update with an annotated graph appeared on 5/31/2012. Click here.
View all notes |
Alert me of new notes |
CANSLIM.net Company Profile |
SEC |
Zacks Reports |
StockTalk |
News |
Chart |
Request a new note
C
A N
S L
I M


|
ASPS
-
NASDAQ
Altisource Ptf Sltns Sa
REAL ESTATE - Property Management/Developmen
|
$72.36
|
+0.66
0.92% |
$72.55
|
149,266
107.77% of 50 DAV
50 DAV is 138,500
|
$72.61
-0.34%
|
6/5/2012
|
$60.01
|
PP = $63.00
|
|
MB = $66.15
|
Most Recent Note - 6/26/2012 1:21:42 PM
G - Holding its ground in a tight range near its 52-week high since last noted on 6/19/12 - "Prior highs in the $65 area define initial support to watch on pullbacks, meanwhile it is getting extended from its prior base."
>>> The latest Featured Stock Update with an annotated graph appeared on 6/5/2012. Click here.
View all notes |
Alert me of new notes |
CANSLIM.net Company Profile |
SEC |
Zacks Reports |
StockTalk |
News |
Chart |
Request a new note
C
A N
S L
I M
|
CERN
-
NASDAQ
Cerner Corp
COMPUTER SOFTWARE and SERVICES - Healthcare Information Service
|
$77.66
|
-0.32
-0.41% |
$78.80
|
1,119,577
75.16% of 50 DAV
50 DAV is 1,489,500
|
$88.32
-12.07%
|
6/7/2012
|
$78.36
|
PP = $84.20
|
|
MB = $88.41
|
Most Recent Note - 6/25/2012 1:12:54 PM
G - Sinking under its 50 DMA line today raising concern and its color code is changed to green. Above average volume behind 2 consecutive losses negated its recent breakout. Disciplined investors always limit losses if ever a stock falls more than -7% from their purchase price.
>>> The latest Featured Stock Update with an annotated graph appeared on 6/7/2012. Click here.
View all notes |
Alert me of new notes |
CANSLIM.net Company Profile |
SEC |
Zacks Reports |
StockTalk |
News |
Chart |
Request a new note
C
A N
S L
I M
|
CMCSA
-
NASDAQ
Comcast Corp Cl A
MEDIA - CATV Systems
|
$31.04
|
+0.47
1.52% |
$31.30
|
14,016,074
99.61% of 50 DAV
50 DAV is 14,071,600
|
$31.65
-1.93%
|
6/11/2012
|
$29.94
|
PP = $30.98
|
|
MB = $32.53
|
Most Recent Note - 6/27/2012 5:48:32 PM
Y - Posted a gain today on average volume, rising near its 52-week high. Held its ground after its gain on 6/15/12 with +55% above average volume while rising above the new pivot point recently cited triggered a technical buy signal. Recent low $30.17 on 6/26/12) defines support above its 50 DMA line.
>>> The latest Featured Stock Update with an annotated graph appeared on 6/11/2012. Click here.
View all notes |
Alert me of new notes |
CANSLIM.net Company Profile |
SEC |
Zacks Reports |
StockTalk |
News |
Chart |
Request a new note
C
A N
S L
I M
|
CSTR
-
NASDAQ
Coinstar Inc
DIVERSIFIED SERVICES - Personal Services
|
$67.43
|
+1.90
2.90% |
$67.70
|
1,272,052
118.12% of 50 DAV
50 DAV is 1,076,900
|
$69.74
-3.31%
|
6/26/2012
|
$64.05
|
PP = $67.00
|
|
MB = $70.35
|
Most Recent Note - 6/27/2012 12:21:36 PM
Y - Rallying for a 2nd consecutive gain with volume running at an above average pace. It was highlighted in yellow in the 6/26/12 mid-day report with pivot point based on its 6/19/12 high after a cup-with handle base. Disciplined investors watch for a solid volume-driven gain to first confirm a breakout before taking action. See the latest FSU analysis for more details and an annotated graph.
>>> The latest Featured Stock Update with an annotated graph appeared on 6/26/2012. Click here.
View all notes |
Alert me of new notes |
CANSLIM.net Company Profile |
SEC |
Zacks Reports |
StockTalk |
News |
Chart |
Request a new note
C
A N
S L
I M
|
Symbol/Exchange
Company Name
Industry Group |
PRICE |
CHANGE
(%Change) |
Day High |
Volume
(% DAV)
(% 50 day avg vol) |
52 Wk Hi
% From Hi |
Featured
Date |
Price
Featured |
Pivot Featured |
|
Max Buy |
DG
-
NYSE
Dollar General Corp
RETAIL - Discount, Variety Stores
|
$54.02
|
-0.93
-1.69% |
$55.30
|
4,863,349
132.52% of 50 DAV
50 DAV is 3,669,800
|
$55.18
-2.10%
|
5/7/2012
|
$48.51
|
PP = $47.69
|
|
MB = $50.07
|
Most Recent Note - 6/26/2012 5:05:45 PM
G - Hit another new all-time high with a volume-driven gain today, getting more extended from prior highs. Completed another Secondary Offering on 6/05/12, its 4th Secondary Offering since September '11.
>>> The latest Featured Stock Update with an annotated graph appeared on 6/12/2012. Click here.
View all notes |
Alert me of new notes |
CANSLIM.net Company Profile |
SEC |
Zacks Reports |
StockTalk |
News |
Chart |
Request a new note
C
A N
S L
I M
|
ECHO
-
NASDAQ
Echo Global Logistics
DIVERSIFIED SERVICES - Business/Management Services
|
$18.58
|
-0.04
-0.21% |
$18.81
|
95,090
93.96% of 50 DAV
50 DAV is 101,200
|
$19.38
-4.13%
|
6/22/2012
|
$18.98
|
PP = $19.48
|
|
MB = $20.45
|
Most Recent Note - 6/26/2012 12:34:28 PM
Y - Faces little resistance due to overhead supply while perched within close striking distance of its 52-week high today, consolidating after volume-driven gains. In the 6/18/12 report it was highlighted in yellow with a new pivot point cited based on its 2/16/12 high plus 10 cents. Disciplined investors may watch for a volume-driven gain above its pivot point to trigger a technical buy signal before action is justified under the fact-based system. See the latest FSU analysis for more details and an annotated graph.
>>> The latest Featured Stock Update with an annotated graph appeared on 6/22/2012. Click here.
View all notes |
Alert me of new notes |
CANSLIM.net Company Profile |
SEC |
Zacks Reports |
StockTalk |
News |
Chart |
Request a new note
C
A N
S L
I M
|
EXPE
-
NASDAQ
Expedia Inc
INTERNET - Internet Information Providers
|
$46.61
|
+0.21
0.45% |
$47.44
|
2,287,289
48.43% of 50 DAV
50 DAV is 4,722,500
|
$50.66
-7.99%
|
4/27/2012
|
$41.80
|
PP = $35.57
|
|
MB = $37.35
|
Most Recent Note - 6/25/2012 1:15:07 PM
G - Pulling back -8.4% from its 52-week high today. It is extended from its prior highs in the $43 area and its 50 DMA line which define support.
>>> The latest Featured Stock Update with an annotated graph appeared on 6/8/2012. Click here.
View all notes |
Alert me of new notes |
CANSLIM.net Company Profile |
SEC |
Zacks Reports |
StockTalk |
News |
Chart |
Request a new note
C
A N
S L
I M
|
GNC
-
NYSE
G N C Holdings Inc
RETAIL - Drug Stores
|
$37.64
|
+0.55
1.48% |
$38.79
|
3,308,057
141.35% of 50 DAV
50 DAV is 2,340,400
|
$41.95
-10.27%
|
1/19/2012
|
$28.99
|
PP = $29.60
|
|
MB = $31.08
|
Most Recent Note - 6/27/2012 5:49:52 PM
G - Posted another gain today with above average volume, however its 50 DMA has been acting as a resistance level. Gains above that short-term average would help its technical stance and improve the outlook.
>>> The latest Featured Stock Update with an annotated graph appeared on 6/6/2012. Click here.
View all notes |
Alert me of new notes |
CANSLIM.net Company Profile |
SEC |
Zacks Reports |
StockTalk |
News |
Chart |
Request a new note
C
A N
S L
I M
|
MLNX
-
NASDAQ
Mellanox Technologies
ELECTRONICS - Semiconductor - Broad Line
|
$68.47
|
+0.26
0.38% |
$68.91
|
456,473
64.00% of 50 DAV
50 DAV is 713,200
|
$74.27
-7.81%
|
6/18/2012
|
$70.90
|
PP = $67.30
|
|
MB = $70.67
|
Most Recent Note - 6/25/2012 5:38:01 PM
Y - Finished the session in the upper third of its intra-day range and above its pivot point, but it was its 3rd loss with above average volume in the span of 4 sessions. Prior highs define chart support to watch. Disciplined investors limit losses if ever a stock falls more than -7% from their purchase price.
>>> The latest Featured Stock Update with an annotated graph appeared on 6/25/2012. Click here.
View all notes |
Alert me of new notes |
CANSLIM.net Company Profile |
SEC |
Zacks Reports |
StockTalk |
News |
Chart |
Request a new note
C
A N
S L
I M
|
Symbol/Exchange
Company Name
Industry Group |
PRICE |
CHANGE
(%Change) |
Day High |
Volume
(% DAV)
(% 50 day avg vol) |
52 Wk Hi
% From Hi |
Featured
Date |
Price
Featured |
Pivot Featured |
|
Max Buy |
N
-
NYSE
Netsuite Inc
DIVERSIFIED SERVICES - Business/Management Services
|
$53.66
|
+1.27
2.42% |
$54.27
|
748,483
142.54% of 50 DAV
50 DAV is 525,100
|
$52.82
1.59%
|
6/20/2012
|
$51.83
|
PP = $51.88
|
|
MB = $54.47
|
Most Recent Note - 6/27/2012 12:33:27 PM
Y - Hitting a new 52-week high today, rallying with no resistance remaining due to overhead supply. It broke out and finished last week back above the pivot point cited based on its 3/27/12 high plus 10 cents.
>>> The latest Featured Stock Update with an annotated graph appeared on 6/20/2012. Click here.
View all notes |
Alert me of new notes |
CANSLIM.net Company Profile |
SEC |
Zacks Reports |
StockTalk |
News |
Chart |
Request a new note
C
A N
S L
I M
|
NSM
-
NYSE
Nationstar Mtg Hldgs Inc
FINANCIAL SERVICES - Credit Services
|
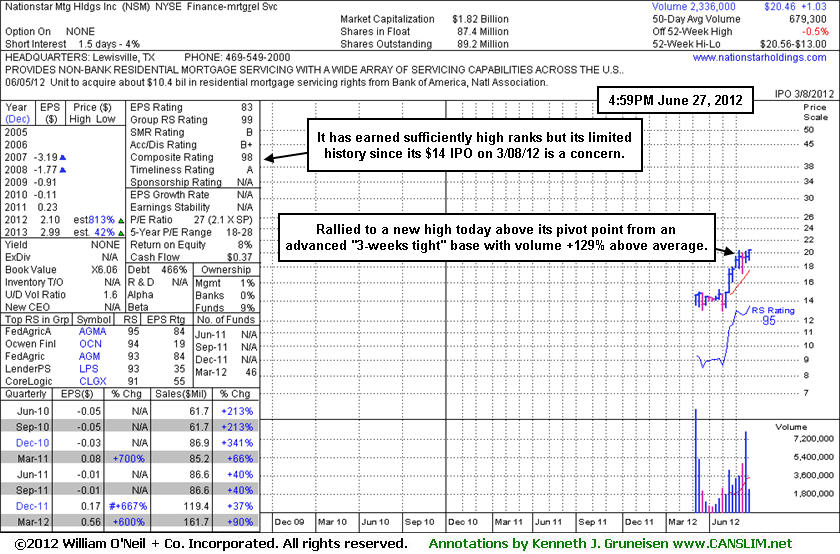
$20.46
|
+1.33
6.95% |
$20.56
|
1,560,662
229.75% of 50 DAV
50 DAV is 679,300
|
$20.36
0.49%
|
6/27/2012
|
$20.29
|
PP = $20.46
|
|
MB = $21.48
|
Most Recent Note - 6/27/2012 12:47:17 PM
Y - Touched a new 52-week high today after completing an advanced "3-weeks tight" base since last noted in the 6/20/12 mid-day report. Color code is changed to yellow with pivot point cited based on its 6/05/12 high plus 10 cents. A volume-driven gain and strong close above the pivot point may trigger a technical buy signal. It has earned high ranks, however prior mid-day reports noted - "Up from its $14 IPO on 3/08/12. Limited history is a concern."
>>> The latest Featured Stock Update with an annotated graph appeared on 6/27/2012. Click here.
View all notes |
Alert me of new notes |
CANSLIM.net Company Profile |
SEC |
Zacks Reports |
StockTalk |
News |
Chart |
Request a new note
C
A N
S L
I M
|
NTES
-
NASDAQ
Netease Inc Adr
INTERNET - Internet Information Providers
|
$59.14
|
-0.56
-0.94% |
$61.41
|
563,245
75.76% of 50 DAV
50 DAV is 743,500
|
$65.54
-9.77%
|
3/19/2012
|
$56.18
|
PP = $55.10
|
|
MB = $57.86
|
Most Recent Note - 6/26/2012 1:15:53 PM
G - Rebounding toward its 50 DMA line today after a damaging violation on the prior session triggered a technical sell signal. Gains above its 50 DMA line are needed for its technical stance and outlook to be considered favorable again. Found support near prior lows in the $55 area.
>>> The latest Featured Stock Update with an annotated graph appeared on 6/19/2012. Click here.
View all notes |
Alert me of new notes |
CANSLIM.net Company Profile |
SEC |
Zacks Reports |
StockTalk |
News |
Chart |
Request a new note
C
A N
S L
I M
|
SWI
-
NYSE
Solarwinds Inc
COMPUTER SOFTWARE and SERVICES - Application Software
|
$43.87
|
-0.11
-0.25% |
$44.29
|
488,781
45.45% of 50 DAV
50 DAV is 1,075,500
|
$48.64
-9.81%
|
4/26/2012
|
$45.15
|
PP = $42.32
|
|
MB = $44.44
|
Most Recent Note - 6/25/2012 1:04:29 PM
G - Today's loss has it slumping under its 50 DMA line raising concerns, and its color code is changed to green. The 6/04/11 low ($41.24) defines important support to watch on pullbacks.
>>> The latest Featured Stock Update with an annotated graph appeared on 6/15/2012. Click here.
View all notes |
Alert me of new notes |
CANSLIM.net Company Profile |
SEC |
Zacks Reports |
StockTalk |
News |
Chart |
Request a new note
C
A N
S L
I M
|
SXCI
-
NASDAQ
S X C Health Solutions
COMPUTER SOFTWARE and SERVICES - Healthcare Information Service
|
$95.71
|
+0.83
0.87% |
$97.38
|
559,825
41.20% of 50 DAV
50 DAV is 1,358,800
|
$103.97
-7.94%
|
6/14/2012
|
$94.71
|
PP = $100.60
|
|
MB = $105.63
|
Most Recent Note - 6/26/2012 5:07:17 PM
Y - Posted a gain today with light volume, still trading just above its 50 DMA line which defines important support. There was a "negative reversal" on 6/19/12 after hitting a new 52-week high, failing to close the session above its pivot point to clinch a convincing technical buy signal.
>>> The latest Featured Stock Update with an annotated graph appeared on 6/14/2012. Click here.
View all notes |
Alert me of new notes |
CANSLIM.net Company Profile |
SEC |
Zacks Reports |
StockTalk |
News |
Chart |
Request a new note
C
A N
S L
I M
|
Symbol/Exchange
Company Name
Industry Group |
PRICE |
CHANGE
(%Change) |
Day High |
Volume
(% DAV)
(% 50 day avg vol) |
52 Wk Hi
% From Hi |
Featured
Date |
Price
Featured |
Pivot Featured |
|
Max Buy |
TDG
-
NYSE
Transdigm Group Inc
AEROSPACE/DEFENSE - Aerospace/Defense Products and; Services
|
$128.00
|
+0.55
0.43% |
$128.16
|
478,681
86.70% of 50 DAV
50 DAV is 552,100
|
$132.69
-3.53%
|
6/18/2012
|
$127.00
|
PP = $132.79
|
|
MB = $139.43
|
Most Recent Note - 6/25/2012 1:08:40 PM
Y - Today's 3rd consecutive loss has it pulling back near its 50 DMA line. It is still perched within -5.7% of its all-time high. Subsequent volume-driven gains above the pivot point may trigger a new (or add-on) technical buy signal. Its prior low ($118.43 on 5/18/12) defines the next important near-term chart support level to watch below its 50 DMA line.
>>> The latest Featured Stock Update with an annotated graph appeared on 6/18/2012. Click here.
View all notes |
Alert me of new notes |
CANSLIM.net Company Profile |
SEC |
Zacks Reports |
StockTalk |
News |
Chart |
Request a new note
C
A N
S L
I M
|
TNGO
-
NASDAQ
Tangoe Inc
COMPUTER SOFTWARE and SERVICES - Technical and System Software
|
$21.33
|
-1.23
-5.45% |
$22.32
|
898,300
163.18% of 50 DAV
50 DAV is 550,500
|
$23.05
-7.46%
|
6/27/2012
|
$21.70
|
PP = $23.15
|
|
MB = $24.31
|
Most Recent Note - 6/27/2012 1:10:32 PM
Y - Color code is changed to yellow with new pivot point cited based on its 5/09/12 high plus 10 cents. Little resistance remains due to overhead supply and a volume-driven gain above its pivot point may trigger a new technical buy signal. Based on poor technical action when last noted on 6/01/12 it was dropped from the Featured Stocks list. However, it subsequently rebounded above its 50 DMA line and showed resilience near that important short-term average in recent weeks.
>>> The latest Featured Stock Update with an annotated graph appeared on 5/25/2012. Click here.
View all notes |
Alert me of new notes |
CANSLIM.net Company Profile |
SEC |
Zacks Reports |
StockTalk |
News |
Chart |
Request a new note
C
A N
S L
I M
|
UA
-
NYSE
Under Armour Inc Cl A
CONSUMER NON-DURABLES - Textile - Apparel Clothing
|
$93.23
|
-3.36
-3.48% |
$96.90
|
1,376,755
130.87% of 50 DAV
50 DAV is 1,052,000
|
$107.86
-13.56%
|
2/15/2012
|
$85.77
|
PP = $84.86
|
|
MB = $89.10
|
Most Recent Note - 6/27/2012 4:40:28 PM
Slumped further below its 50 DMA line with higher volume behind its loss today while slumping toward prior lows in the $88 area which define the next chart support level. It will be dropped from the Featured Stocks list today due to weak action and a dissapointing earnings report for March '12.
>>> The latest Featured Stock Update with an annotated graph appeared on 6/21/2012. Click here.
View all notes |
Alert me of new notes |
CANSLIM.net Company Profile |
SEC |
Zacks Reports |
StockTalk |
News |
Chart |
Request a new note
C
A N
S L
I M
|
VSI
-
NYSE
Vitamin Shoppe Inc
SPECIALTY RETAIL - Specialty Retail, Other
|
$52.70
|
-0.71
-1.33% |
$53.89
|
437,167
86.88% of 50 DAV
50 DAV is 503,200
|
$55.29
-4.68%
|
4/25/2012
|
$47.77
|
PP = $48.46
|
|
MB = $50.88
|
Most Recent Note - 6/27/2012 5:52:09 PM
Y - Pulled back today for its 3rd consecutive small loss with below average volume. One may consider a secondary buy point from its successful test of the 10 week average up to +5% above the recent high. Disciplined investors always limit losses by selling if a stock falls more than -7% from their buy price.
>>> The latest Featured Stock Update with an annotated graph appeared on 6/4/2012. Click here.
View all notes |
Alert me of new notes |
CANSLIM.net Company Profile |
SEC |
Zacks Reports |
StockTalk |
News |
Chart |
Request a new note
C
A N
S L
I M
|
WFM
-
NASDAQ
Whole Foods Market Inc
RETAIL - Grocery Stores
|
$94.99
|
-1.78
-1.84% |
$97.06
|
1,786,467
90.78% of 50 DAV
50 DAV is 1,967,800
|
$97.25
-2.32%
|
6/13/2012
|
$89.90
|
PP = $91.60
|
|
MB = $96.18
|
Most Recent Note - 6/27/2012 5:53:58 PM
Y - Hovering near its 52-week high, pulling back today on below average volume. Color code is changed to yellow after quietly dipping below its "max buy" level. No resistance remains due to overhead supply. Its 50 DMA line and prior lows define important near-term support.
>>> The latest Featured Stock Update with an annotated graph appeared on 6/13/2012. Click here.
View all notes |
Alert me of new notes |
CANSLIM.net Company Profile |
SEC |
Zacks Reports |
StockTalk |
News |
Chart |
Request a new note
C
A N
S L
I M
|
Symbol/Exchange
Company Name
Industry Group |
PRICE |
CHANGE
(%Change) |
Day High |
Volume
(% DAV)
(% 50 day avg vol) |
52 Wk Hi
% From Hi |
Featured
Date |
Price
Featured |
Pivot Featured |
|
Max Buy |