You are not logged in.
This means you
CAN ONLY VIEW reports that were published prior to Monday, April 14, 2025.
You
MUST UPGRADE YOUR MEMBERSHIP if you want to see any current reports.
AFTER MARKET UPDATE - TUESDAY, JUNE 26TH, 2012
Previous After Market Report Next After Market Report >>>
|
|
|
|
DOW |
+32.01 |
12,534.67 |
+0.26% |
|
Volume |
712,290,740 |
-6% |
|
Volume |
1,562,129,120 |
+7% |
|
NASDAQ |
+17.90 |
2,854.06 |
+0.63% |
|
Advancers |
1,938 |
61% |
|
Advancers |
1,383 |
54% |
|
S&P 500 |
+6.27 |
1,319.99 |
+0.48% |
|
Decliners |
1,097 |
34% |
|
Decliners |
1,091 |
42% |
|
Russell 2000 |
+3.12 |
765.02 |
+0.41% |
|
52 Wk Highs |
77 |
|
|
52 Wk Highs |
51 |
|
|
S&P 600 |
+1.73 |
426.32 |
+0.41% |
|
52 Wk Lows |
71 |
|
|
52 Wk Lows |
64 |
|
|
 |
Major Indices Posted Gains With Mixed Volume Totals
Kenneth J. Gruneisen - Passed the CAN SLIM® Master's Exam
On Tuesday's session the major averages closed near their session highs as a rebound in crude oil prices helped lift the energy sector. The volume totals were reported lighter than the prior session total on the NYSE and higher that the prior session total on the Nasdaq exchange. Breadth was positive as advancers led decliners by almost a 2-1 ratio on the NYSE and by about a 7-5 ratio on the Nasdaq exchange. The total number of new 52-week lows trumped new 52-week highs on the Nasdaq exchange while new highs again outnumbered new lows on the NYSE. There were 23 high-ranked companies from the CANSLIM.net Leaders List made new 52-week highs and appeared on the CANSLIM.net BreakOuts Page, more than doubling the prior session total of 10 stocks. At the session's close there was a gain for 13 of the 18 high-ranked companies currently included on the Featured Stocks Page.
The Case-Shiller home price index topped expectations, while consumer confidence dipped to its lowest level since January. Homebuilders including Lennar Corp (LEN +3.05%) and Toll Brothers Inc (TOL +5.29%) showed strength throughout the day following a positive move in April home prices. Also on the upside, fertilizer stocks are rallying as December corn futures rose to their highest level in 2012. Mosaic (MOS +4.32%) and CF Industries Holdings Inc (CF +2.87%) were higher.
Stocks wavered between gains and losses as investors digested mixed economic reports amid ongoing uncertainties surrounding Europe. Shares of Exxon Mobil Corp (XOM +1.43%) and Chevron Corp (CVX +1.89%) rose. On the earnings front, Apollo Group Inc (APOL +10.29%) gained after the company topped analysts' expectations in their quarterly report. In other news, News Corp (NWS +8.28%) rallied after the company reported that it was considering splitting its television and print businesses.
In bondland, Treasuries were lower along the curve. The 10-year note was down 1/4 of a point to yield 1.63% and the 30-year bond fell 17/32 to yield 2.70%.
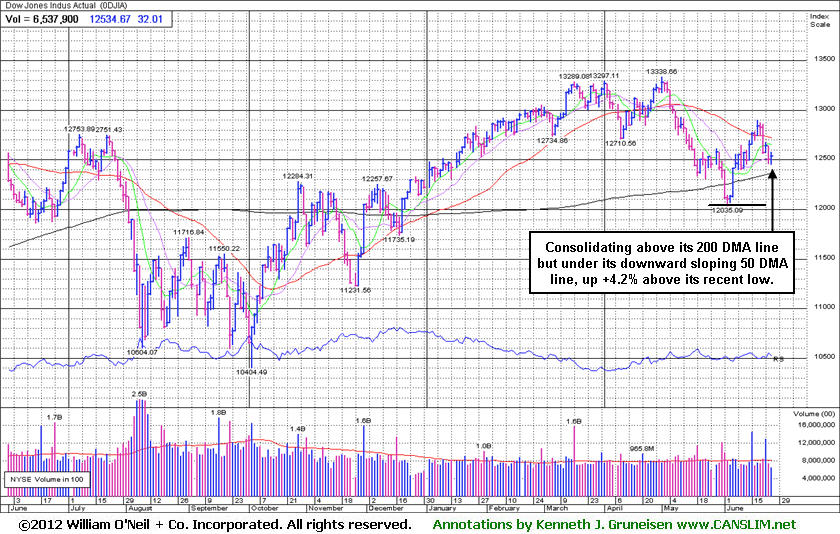
The nascent rally and confirmed uptrend came under pressure as all 3 major averages surrendered gains which had lifted them each above their respective 50-day moving average (DMA) lines last week. Technically, the major averages' (M criteria) current rally still allows fact-based investors to make new buying efforts, but only in sound buy candidates near proper entry points. As always, disciplined investors limit losses if any stock ever falls more than -7% from its purchase price.
The Q2 2012 Webcast is scheduled for Wednesday, June 27th at 8PM EST and will be available "ON DEMAND" afterward. All who have the UPGRADED membership now get access to these informative *Quarterly Webcasts included at no additional cost. (*Previously sold separately at $99 per webcast.) Links to archived webcasts and all prior reports are on the Premium Member Homepage. Please use the inquiry form to submit any questions that you would like to see answered in the upcoming webcast or to make any suggestions or comments about our website and services. Thank you!
PICTURED: The Dow Jones Industrial Average is consolidating +4.2% above its prior low and above its 200-day moving average which define important support as the latest rally endures pressure. It promptly reversed below its downward sloping 50-day moving average (DMA) line after briefly getting above that important short-term average. Prior commentaries warned - "Additional distributional action could quickly quash the recently confirmed rally."
|
 Kenneth J. Gruneisen started out as a licensed stockbroker in August 1987, a couple of months prior to the historic stock market crash that took the Dow Jones Industrial Average down -22.6% in a single day. He has published daily fact-based fundamental and technical analysis on high-ranked stocks online for two decades. Through FACTBASEDINVESTING.COM, Kenneth provides educational articles, news, market commentary, and other information regarding proven investment systems that work in good times and bad.
Comments contained in the body of this report are technical opinions only and are not necessarily those of Gruneisen Growth Corp. The material herein has been obtained from sources believed to be reliable and accurate, however, its accuracy and completeness cannot be guaranteed. Our firm, employees, and customers may effect transactions, including transactions contrary to any recommendation herein, or have positions in the securities mentioned herein or options with respect thereto. Any recommendation contained in this report may not be suitable for all investors and it is not to be deemed an offer or solicitation on our part with respect to the purchase or sale of any securities. |
|
 |
Retail, Financial, and Energy-Related Groups Rose
Kenneth J. Gruneisen - Passed the CAN SLIM® Master's Exam
The Retail Index ($RLX +1.22%) was among Tuesday's best gainers and modest gains from the Bank Index ($BKX +0.57%) and the Broker/Dealer Index ($XBD +0.33%) were also a positive influence on the major averages. Strength in energy-related shares boosted the Integrated Oil Index ($XOI +1.05%)and the Oil Services Index ($OSX +0.55%). The Healthcare Index ($HMO +0.34%), Biotechnology Index ($BTK +0.63%), and the Semiconductor Index ($SOX +0.36%) posted modest gains but the Networking Index ($NWX -0.33%) edged lower. Meanwhile, the Gold & Silver Index ($XAU -1.27%) was a clear laggard as it fell more than -1% on a mostly positive session.
Charts courtesy www.stockcharts.com
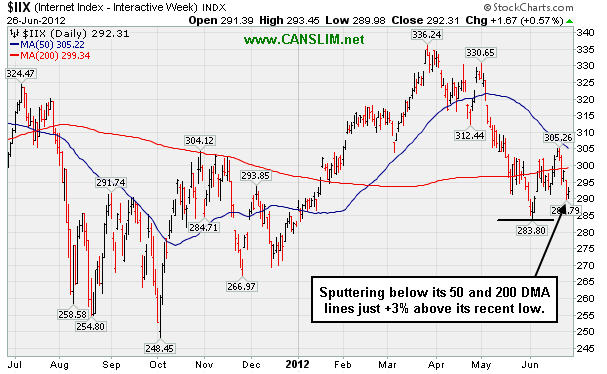
PICTURED: The Internet Index ($IIX +0.58%) is sputtering below its 50-day and 200-day moving average (DMA) lines and just +3% above its recent low.
| Oil Services |
$OSX |
187.29 |
+1.02 |
+0.55% |
-13.40% |
| Healthcare |
$HMO |
2,239.09 |
+7.54 |
+0.34% |
-1.86% |
| Integrated Oil |
$XOI |
1,104.98 |
+11.49 |
+1.05% |
-10.10% |
| Semiconductor |
$SOX |
366.87 |
+1.32 |
+0.36% |
+0.67% |
| Networking |
$NWX |
203.86 |
-0.64 |
-0.31% |
-5.25% |
| Internet |
$IIX |
292.31 |
+1.67 |
+0.57% |
+3.75% |
| Broker/Dealer |
$XBD |
83.43 |
+0.27 |
+0.32% |
+0.19% |
| Retail |
$RLX |
607.59 |
+7.30 |
+1.22% |
+16.13% |
| Gold & Silver |
$XAU |
155.56 |
-2.00 |
-1.27% |
-13.88% |
| Bank |
$BKX |
44.14 |
+0.25 |
+0.57% |
+12.09% |
| Biotech |
$BTK |
1,453.61 |
+9.03 |
+0.63% |
+33.18% |
|
|
|
 |
Formed Cup-With Handle Base, But Watch First For Technical Breakout
Kenneth J. Gruneisen - Passed the CAN SLIM® Master's Exam
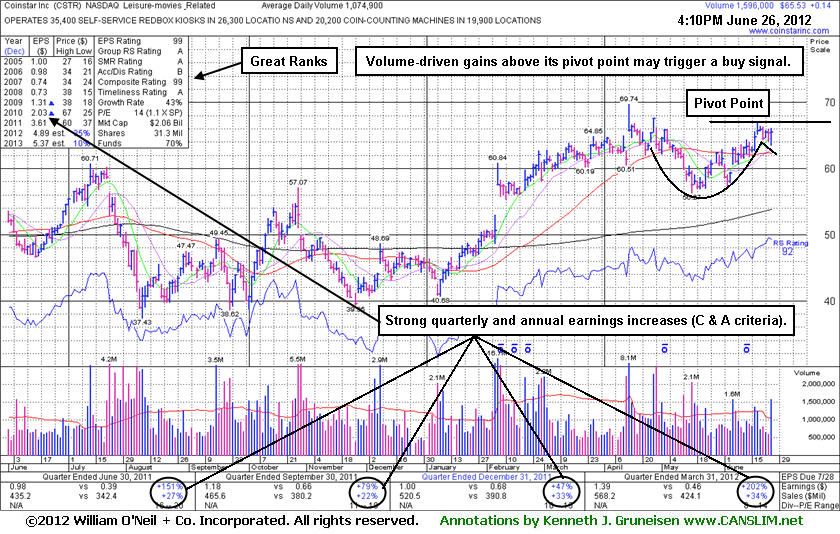
Often, when a leading stock is setting up to breakout of a solid base it is highlighted in CANSLIM.net's Mid-Day Breakouts Report. The most relevant factors are noted in the report which alerts prudent CANSLIM oriented investors to place the issue in their watch list. After doing any necessary backup research, the investor is prepared to act after the stock triggers a technical buy signal (breaks above its pivot point on more than +50% average turnover) but before it gets too extended from a sound base. In the event the stock fails to trigger a technical buy signal and its price declines then it will simply be removed from the watch list. Disciplined investors know to buy as near as possible to the pivot point and avoid chasing stocks after they have rallied more than +5% above their pivot point. It is crucial to always limit losses whenever any stock heads the wrong direction, and disciplined investors sell if a struggling stock ever falls more than -7% from their purchase price.
Coinstar Inc (CSTR +$0.14 or +0.21% to $65.53) was highlighted in yellow in the mid-day report today (read here) with pivot point based on its 6/19/12 high after a cup-with handle base. There was above average volume behind its gain, but it did not rally above its pivot point. Disciplined investors will watch for a solid volume-driven gain to confirm a breakout before taking action. It is now perched within close striking distance of its 52-week high and all-time high, however the $67-69 area has been a stubborn resistance level in recent years. It went through a consolidation below its 50-day moving average (DMA) line since noted on 4/13/12 following a considerable gap up gain after raising its guidance. "No overhead supply remains to act as resistance. Recently wedged to new 52-week highs without great volume conviction and did not form a sound base pattern. Disciplined investors may watch for an ideal base or secondary buy point to possibly develop and be noted. Quarterly comparisons show strong sales revenues and earnings increases (C criteria), and its annual earnings (A criteria) history has been good."
The number of top-rated funds owning its shares rose from 350 in Jun '11 to 394 in Mar '12, a reassuring sign concerning the I criteria. It has earned the highest possible rank of 99 for both its Earnings Per Share and Composite Rating, and it other great ranks. There is no advantage to getting in "early" however, and patient investors will watch for fresh signs of meaningful buying demand from the institutional crowd before leaping in. If a significant advance in price is going to happen, there will be evidence of more aggressive accumulation. Meanwhile, it is an ideal candidate for investors to have on their watchlist.
|
|
|
Color Codes Explained :
Y - Better candidates highlighted by our
staff of experts.
G - Previously featured
in past reports as yellow but may no longer be buyable under the
guidelines.
***Last / Change / Volume data in this table is the closing quote data***
Symbol/Exchange
Company Name
Industry Group |
PRICE |
CHANGE
(%Change) |
Day High |
Volume
(% DAV)
(% 50 day avg vol) |
52 Wk Hi
% From Hi |
Featured
Date |
Price
Featured |
Pivot Featured |
|
Max Buy |
ALXN
-
NASDAQ
Alexion Pharmaceuticals
DRUGS - Drug Manufacturers - Other
|
$97.38
|
+1.48
1.54% |
$98.45
|
1,022,648
47.11% of 50 DAV
50 DAV is 2,170,700
|
$99.41
-2.04%
|
5/1/2012
|
$91.73
|
PP = $95.11
|
|
MB = $99.87
|
 Most Recent Note - 6/26/2012 1:18:32 PM
Y - Quietly holding its ground since last noted on 6/19/12 when it gapped up above resistance in the $94-95 area and rallied above its pivot point for a new 52-week high.
>>> The latest Featured Stock Update with an annotated graph appeared on 5/31/2012. Click here.
View all notes |
Alert me of new notes |
CANSLIM.net Company Profile |
SEC |
Zacks Reports |
StockTalk |
News |
Chart |
Request a new note
C
A N
S L
I M


|
ASPS
-
NASDAQ
Altisource Ptf Sltns Sa
REAL ESTATE - Property Management/Developmen
|
$71.70
|
+0.92
1.30% |
$71.80
|
94,150
68.13% of 50 DAV
50 DAV is 138,200
|
$72.61
-1.25%
|
6/5/2012
|
$60.01
|
PP = $63.00
|
|
MB = $66.15
|
Most Recent Note - 6/26/2012 1:21:42 PM
G - Holding its ground in a tight range near its 52-week high since last noted on 6/19/12 - "Prior highs in the $65 area define initial support to watch on pullbacks, meanwhile it is getting extended from its prior base."
>>> The latest Featured Stock Update with an annotated graph appeared on 6/5/2012. Click here.
View all notes |
Alert me of new notes |
CANSLIM.net Company Profile |
SEC |
Zacks Reports |
StockTalk |
News |
Chart |
Request a new note
C
A N
S L
I M
|
CERN
-
NASDAQ
Cerner Corp
COMPUTER SOFTWARE and SERVICES - Healthcare Information Service
|
$77.98
|
-0.27
-0.35% |
$78.86
|
1,616,893
109.80% of 50 DAV
50 DAV is 1,472,600
|
$88.32
-11.71%
|
6/7/2012
|
$78.36
|
PP = $84.20
|
|
MB = $88.41
|
Most Recent Note - 6/25/2012 1:12:54 PM
G - Sinking under its 50 DMA line today raising concern and its color code is changed to green. Above average volume behind 2 consecutive losses negated its recent breakout. Disciplined investors always limit losses if ever a stock falls more than -7% from their purchase price.
>>> The latest Featured Stock Update with an annotated graph appeared on 6/7/2012. Click here.
View all notes |
Alert me of new notes |
CANSLIM.net Company Profile |
SEC |
Zacks Reports |
StockTalk |
News |
Chart |
Request a new note
C
A N
S L
I M
|
CMCSA
-
NASDAQ
Comcast Corp Cl A
MEDIA - CATV Systems
|
$30.58
|
+0.25
0.82% |
$30.69
|
10,394,230
74.00% of 50 DAV
50 DAV is 14,046,800
|
$31.65
-3.40%
|
6/11/2012
|
$29.94
|
PP = $30.98
|
|
MB = $32.53
|
Most Recent Note - 6/20/2012 1:06:46 PM
Y - Perched at its 52-week high today, holding its ground after 4 consecutive gains. Its gain on 6/15/12 with +55% above average volume while rising above the new pivot point recently cited triggered a technical buy signal. The prior low ($28.09 on 5/21/12) defines important near-term support to watch.
>>> The latest Featured Stock Update with an annotated graph appeared on 6/11/2012. Click here.
View all notes |
Alert me of new notes |
CANSLIM.net Company Profile |
SEC |
Zacks Reports |
StockTalk |
News |
Chart |
Request a new note
C
A N
S L
I M
|
CSTR
-
NASDAQ
Coinstar Inc
DIVERSIFIED SERVICES - Personal Services
|
$65.53
|
+0.14
0.21% |
$66.08
|
1,598,923
148.75% of 50 DAV
50 DAV is 1,074,900
|
$69.74
-6.04%
|
6/26/2012
|
$64.05
|
PP = $67.00
|
|
MB = $70.35
|
Most Recent Note - 6/26/2012 4:31:12 PM
Y - Color code was changed to yellow with pivot point based on its 6/19/12 high after a cup-with handle base. Disciplined investors watch for a solid volume-driven gain to first confirm a breakout before taking action. See the latest FSU analysis for more details and an annotated graph.
>>> The latest Featured Stock Update with an annotated graph appeared on 6/26/2012. Click here.
View all notes |
Alert me of new notes |
CANSLIM.net Company Profile |
SEC |
Zacks Reports |
StockTalk |
News |
Chart |
Request a new note
C
A N
S L
I M
|
Symbol/Exchange
Company Name
Industry Group |
PRICE |
CHANGE
(%Change) |
Day High |
Volume
(% DAV)
(% 50 day avg vol) |
52 Wk Hi
% From Hi |
Featured
Date |
Price
Featured |
Pivot Featured |
|
Max Buy |
DG
-
NYSE
Dollar General Corp
RETAIL - Discount, Variety Stores
|
$54.95
|
+1.76
3.31% |
$55.18
|
4,638,993
128.26% of 50 DAV
50 DAV is 3,616,800
|
$53.45
2.81%
|
5/7/2012
|
$48.51
|
PP = $47.69
|
|
MB = $50.07
|
Most Recent Note - 6/26/2012 5:05:45 PM
G - Hit another new all-time high with a volume-driven gain today, getting more extended from prior highs. Completed another Secondary Offering on 6/05/12, its 4th Secondary Offering since September '11.
>>> The latest Featured Stock Update with an annotated graph appeared on 6/12/2012. Click here.
View all notes |
Alert me of new notes |
CANSLIM.net Company Profile |
SEC |
Zacks Reports |
StockTalk |
News |
Chart |
Request a new note
C
A N
S L
I M
|
ECHO
-
NASDAQ
Echo Global Logistics
DIVERSIFIED SERVICES - Business/Management Services
|
$18.62
|
-0.24
-1.27% |
$19.15
|
124,130
125.13% of 50 DAV
50 DAV is 99,200
|
$19.38
-3.92%
|
6/22/2012
|
$18.98
|
PP = $19.48
|
|
MB = $20.45
|
Most Recent Note - 6/26/2012 12:34:28 PM
Y - Faces little resistance due to overhead supply while perched within close striking distance of its 52-week high today, consolidating after volume-driven gains. In the 6/18/12 report it was highlighted in yellow with a new pivot point cited based on its 2/16/12 high plus 10 cents. Disciplined investors may watch for a volume-driven gain above its pivot point to trigger a technical buy signal before action is justified under the fact-based system. See the latest FSU analysis for more details and an annotated graph.
>>> The latest Featured Stock Update with an annotated graph appeared on 6/22/2012. Click here.
View all notes |
Alert me of new notes |
CANSLIM.net Company Profile |
SEC |
Zacks Reports |
StockTalk |
News |
Chart |
Request a new note
C
A N
S L
I M
|
EXPE
-
NASDAQ
Expedia Inc
INTERNET - Internet Information Providers
|
$46.40
|
+0.15
0.32% |
$47.09
|
2,548,533
53.90% of 50 DAV
50 DAV is 4,728,000
|
$50.66
-8.41%
|
4/27/2012
|
$41.80
|
PP = $35.57
|
|
MB = $37.35
|
Most Recent Note - 6/25/2012 1:15:07 PM
G - Pulling back -8.4% from its 52-week high today. It is extended from its prior highs in the $43 area and its 50 DMA line which define support.
>>> The latest Featured Stock Update with an annotated graph appeared on 6/8/2012. Click here.
View all notes |
Alert me of new notes |
CANSLIM.net Company Profile |
SEC |
Zacks Reports |
StockTalk |
News |
Chart |
Request a new note
C
A N
S L
I M
|
GNC
-
NYSE
G N C Holdings Inc
RETAIL - Drug Stores
|
$37.09
|
+0.22
0.60% |
$37.44
|
2,243,636
96.74% of 50 DAV
50 DAV is 2,319,200
|
$41.95
-11.59%
|
1/19/2012
|
$28.99
|
PP = $29.60
|
|
MB = $31.08
|
Most Recent Note - 6/22/2012 5:16:25 PM
G - Posted a gain today with 3 times average volume as it continued rebounding toward its 50 DMA line which may now act as a resistance level. Gains above that short-term average would help its technical stance and improve the outlook.
>>> The latest Featured Stock Update with an annotated graph appeared on 6/6/2012. Click here.
View all notes |
Alert me of new notes |
CANSLIM.net Company Profile |
SEC |
Zacks Reports |
StockTalk |
News |
Chart |
Request a new note
C
A N
S L
I M
|
MLNX
-
NASDAQ
Mellanox Technologies
ELECTRONICS - Semiconductor - Broad Line
|
$68.21
|
-0.03
-0.04% |
$69.96
|
643,251
91.42% of 50 DAV
50 DAV is 703,600
|
$74.27
-8.16%
|
6/18/2012
|
$70.90
|
PP = $67.30
|
|
MB = $70.67
|
Most Recent Note - 6/25/2012 5:38:01 PM
Y - Finished the session in the upper third of its intra-day range and above its pivot point, but it was its 3rd loss with above average volume in the span of 4 sessions. Prior highs define chart support to watch. Disciplined investors limit losses if ever a stock falls more than -7% from their purchase price.
>>> The latest Featured Stock Update with an annotated graph appeared on 6/25/2012. Click here.
View all notes |
Alert me of new notes |
CANSLIM.net Company Profile |
SEC |
Zacks Reports |
StockTalk |
News |
Chart |
Request a new note
C
A N
S L
I M
|
Symbol/Exchange
Company Name
Industry Group |
PRICE |
CHANGE
(%Change) |
Day High |
Volume
(% DAV)
(% 50 day avg vol) |
52 Wk Hi
% From Hi |
Featured
Date |
Price
Featured |
Pivot Featured |
|
Max Buy |
N
-
NYSE
Netsuite Inc
DIVERSIFIED SERVICES - Business/Management Services
|
$52.39
|
+0.89
1.73% |
$52.66
|
355,116
67.93% of 50 DAV
50 DAV is 522,800
|
$52.82
-0.81%
|
6/20/2012
|
$51.83
|
PP = $51.88
|
|
MB = $54.47
|
Most Recent Note - 6/22/2012 5:22:02 PM
Y - Posted a small gain today with more than 5 times average volume. It finished the week back above the pivot point cited based on its 3/27/12 high plus 10 cents.
>>> The latest Featured Stock Update with an annotated graph appeared on 6/20/2012. Click here.
View all notes |
Alert me of new notes |
CANSLIM.net Company Profile |
SEC |
Zacks Reports |
StockTalk |
News |
Chart |
Request a new note
C
A N
S L
I M
|
NTES
-
NASDAQ
Netease Inc Adr
INTERNET - Internet Information Providers
|
$59.70
|
+3.20
5.66% |
$60.17
|
1,339,853
184.88% of 50 DAV
50 DAV is 724,700
|
$65.54
-8.91%
|
3/19/2012
|
$56.18
|
PP = $55.10
|
|
MB = $57.86
|
Most Recent Note - 6/26/2012 1:15:53 PM
G - Rebounding toward its 50 DMA line today after a damaging violation on the prior session triggered a technical sell signal. Gains above its 50 DMA line are needed for its technical stance and outlook to be considered favorable again. Found support near prior lows in the $55 area.
>>> The latest Featured Stock Update with an annotated graph appeared on 6/19/2012. Click here.
View all notes |
Alert me of new notes |
CANSLIM.net Company Profile |
SEC |
Zacks Reports |
StockTalk |
News |
Chart |
Request a new note
C
A N
S L
I M
|
SWI
-
NYSE
Solarwinds Inc
COMPUTER SOFTWARE and SERVICES - Application Software
|
$43.98
|
+0.56
1.29% |
$44.24
|
543,535
50.35% of 50 DAV
50 DAV is 1,079,600
|
$48.64
-9.58%
|
4/26/2012
|
$45.15
|
PP = $42.32
|
|
MB = $44.44
|
Most Recent Note - 6/25/2012 1:04:29 PM
G - Today's loss has it slumping under its 50 DMA line raising concerns, and its color code is changed to green. The 6/04/11 low ($41.24) defines important support to watch on pullbacks.
>>> The latest Featured Stock Update with an annotated graph appeared on 6/15/2012. Click here.
View all notes |
Alert me of new notes |
CANSLIM.net Company Profile |
SEC |
Zacks Reports |
StockTalk |
News |
Chart |
Request a new note
C
A N
S L
I M
|
SXCI
-
NASDAQ
S X C Health Solutions
COMPUTER SOFTWARE and SERVICES - Healthcare Information Service
|
$94.88
|
+2.19
2.36% |
$95.21
|
566,807
41.86% of 50 DAV
50 DAV is 1,354,200
|
$103.97
-8.74%
|
6/14/2012
|
$94.71
|
PP = $100.60
|
|
MB = $105.63
|
Most Recent Note - 6/26/2012 5:07:17 PM
Y - Posted a gain today with light volume, still trading just above its 50 DMA line which defines important support. There was a "negative reversal" on 6/19/12 after hitting a new 52-week high, failing to close the session above its pivot point to clinch a convincing technical buy signal.
>>> The latest Featured Stock Update with an annotated graph appeared on 6/14/2012. Click here.
View all notes |
Alert me of new notes |
CANSLIM.net Company Profile |
SEC |
Zacks Reports |
StockTalk |
News |
Chart |
Request a new note
C
A N
S L
I M
|
TDG
-
NYSE
Transdigm Group Inc
AEROSPACE/DEFENSE - Aerospace/Defense Products and; Services
|
$127.45
|
+1.30
1.03% |
$127.50
|
471,718
85.86% of 50 DAV
50 DAV is 549,400
|
$132.69
-3.95%
|
6/18/2012
|
$127.00
|
PP = $132.79
|
|
MB = $139.43
|
Most Recent Note - 6/25/2012 1:08:40 PM
Y - Today's 3rd consecutive loss has it pulling back near its 50 DMA line. It is still perched within -5.7% of its all-time high. Subsequent volume-driven gains above the pivot point may trigger a new (or add-on) technical buy signal. Its prior low ($118.43 on 5/18/12) defines the next important near-term chart support level to watch below its 50 DMA line.
>>> The latest Featured Stock Update with an annotated graph appeared on 6/18/2012. Click here.
View all notes |
Alert me of new notes |
CANSLIM.net Company Profile |
SEC |
Zacks Reports |
StockTalk |
News |
Chart |
Request a new note
C
A N
S L
I M
|
Symbol/Exchange
Company Name
Industry Group |
PRICE |
CHANGE
(%Change) |
Day High |
Volume
(% DAV)
(% 50 day avg vol) |
52 Wk Hi
% From Hi |
Featured
Date |
Price
Featured |
Pivot Featured |
|
Max Buy |
UA
-
NYSE
Under Armour Inc Cl A
CONSUMER NON-DURABLES - Textile - Apparel Clothing
|
$96.59
|
-0.60
-0.62% |
$98.95
|
912,955
87.55% of 50 DAV
50 DAV is 1,042,800
|
$107.86
-10.45%
|
2/15/2012
|
$85.77
|
PP = $84.86
|
|
MB = $89.10
|
Most Recent Note - 6/25/2012 1:10:24 PM
G - Sinking below its 50 DMA line today, raising concerns. It recently wedged to new 52-week highs without especially great volume conviction behind its gains.
>>> The latest Featured Stock Update with an annotated graph appeared on 6/21/2012. Click here.
View all notes |
Alert me of new notes |
CANSLIM.net Company Profile |
SEC |
Zacks Reports |
StockTalk |
News |
Chart |
Request a new note
C
A N
S L
I M
|
VSI
-
NYSE
Vitamin Shoppe Inc
SPECIALTY RETAIL - Specialty Retail, Other
|
$53.41
|
-0.10
-0.19% |
$54.55
|
420,810
84.36% of 50 DAV
50 DAV is 498,800
|
$55.29
-3.40%
|
4/25/2012
|
$47.77
|
PP = $48.46
|
|
MB = $50.88
|
Most Recent Note - 6/20/2012 1:11:12 PM
Y - Up today for a 4th consecutive gain, poised for a best-ever close. Found support above prior highs in the $48 area and above its 50 DMA line. One may consider a secondary buy point from its successful test of the 10 week average up to +5% above the recent high. Disciplined investors always limit losses by selling if a stock falls more than -7% from their buy price.
>>> The latest Featured Stock Update with an annotated graph appeared on 6/4/2012. Click here.
View all notes |
Alert me of new notes |
CANSLIM.net Company Profile |
SEC |
Zacks Reports |
StockTalk |
News |
Chart |
Request a new note
C
A N
S L
I M
|
WFM
-
NASDAQ
Whole Foods Market Inc
RETAIL - Grocery Stores
|
$96.91
|
+1.35
1.41% |
$97.25
|
1,543,322
78.70% of 50 DAV
50 DAV is 1,961,100
|
$96.96
-0.05%
|
6/13/2012
|
$89.90
|
PP = $91.60
|
|
MB = $96.18
|
Most Recent Note - 6/22/2012 5:29:49 PM
G - Rallied to a new high close and new 52-week high with +80% above average volume behind its gain today. Color code is changed to green after closing above its "max buy" level. No resistance remains due to overhead supply. Its 50 DMA line and prior lows define important near-term support.
>>> The latest Featured Stock Update with an annotated graph appeared on 6/13/2012. Click here.
View all notes |
Alert me of new notes |
CANSLIM.net Company Profile |
SEC |
Zacks Reports |
StockTalk |
News |
Chart |
Request a new note
C
A N
S L
I M
|
|
|
|
THESE ARE NOT BUY RECOMMENDATIONS!
Comments contained in the body of this report are technical
opinions only. The material herein has been obtained
from sources believed to be reliable and accurate, however,
its accuracy and completeness cannot be guaranteed.
This site is not an investment advisor, hence it does
not endorse or recommend any securities or other investments.
Any recommendation contained in this report may not
be suitable for all investors and it is not to be deemed
an offer or solicitation on our part with respect to
the purchase or sale of any securities. All trademarks,
service marks and trade names appearing in this report
are the property of their respective owners, and are
likewise used for identification purposes only.
This report is a service available
only to active Paid Premium Members.
You may opt-out of receiving report notifications
at any time. Questions or comments may be submitted
by writing to Premium Membership Services 665 S.E. 10 Street, Suite 201 Deerfield Beach, FL 33441-5634 or by calling 1-800-965-8307
or 954-785-1121.
|
|
|

