You are not logged in.
This means you
CAN ONLY VIEW reports that were published prior to Monday, April 14, 2025.
You
MUST UPGRADE YOUR MEMBERSHIP if you want to see any current reports.
AFTER MARKET UPDATE - FRIDAY, JUNE 26TH, 2009
Previous After Market Report Next After Market Report >>>
|
|
|
|
DOW |
-34.01 |
8,438.39 |
-0.40% |
|
Volume |
2,346,967,470 |
+99% |
|
Volume |
3,650,000,000 |
+61% |
|
NASDAQ |
+8.68 |
1,838.22 |
+0.47% |
|
Advancers |
1,832 |
59% |
|
Advancers |
1,747 |
62% |
|
S&P 500 |
-1.36 |
918.90 |
-0.15% |
|
Decliners |
1,172 |
38% |
|
Decliners |
958 |
34% |
|
Russell 2000 |
+4.04 |
513.22 |
+0.79% |
|
52 Wk Highs |
27 |
|
|
52 Wk Highs |
83 |
|
|
S&P 600 |
+3.34 |
269.49 |
+1.25% |
|
52 Wk Lows |
2 |
|
|
52 Wk Lows |
10 |
|
|
 |
Major Averages Ended Mixed On Friday And For The Week
Adam Sarhan, Contributing Writer,
The major averages ended the day and week mixed after finding support earlier in the week. Breadth was positive on Friday as advancers decisively led decliners by nearly a 2-to-1 ratio on both major exchanges. Volume was sharply higher across the board as many indexes did their semi-annual rebalancing. There were 18 high-ranked companies from the CANSLIM.net Leaders List that made a new 52-week high and appeared on the CANSLIM.net BreakOuts Page, higher than the 12 issues that appeared on the prior session. This was a welcome improvement, while an even greater expansion in the new highs list in the weeks ahead would offer more encouraging news for growth oriented investors.
On Monday, the major averages got smacked as the dollar rallied after the World Bank said the recession will be deeper than previously forecast. The stock market and a slew of commodities sold off after the World Bank cast a dark cloud over the current global economic recovery. The World Bank believes that unemployment and poverty will rise in developing nations and predicted the global economy will fall by -2.9% for the rest of the year. That is lower than the World Bank's prior report of a -1.7% contraction. The Bank believes that economic growth will return in 2010 at a +2% rate. That is also lower than last quarter's estimate of a +2.3% rate. A separate report showed that corporate insiders (i.e. executives at publicly traded US companies) are selling shares at the fastest level since the bear market began in October 2007.
On Tuesday, the major averages ended mixed after President Obama defended the powers of the Federal Reserve. Obama explained his plan to allow the central bank to be in charge of monitoring broad risks facing the financial system. He highlighted several important roles of the Fed and also defended the performance of Fed Chairman Ben Bernanke during and after the financial crisis, saying Bernanke has done a "fine job" and "performed well."
On Wednesday, the market ended mixed after the Federal Reserve concluded its two day meeting and held rates steady. The Fed did not increase the size of its $1.75 trillion bond-purchase program, sending the Dow Jones Industrial Average into negative territory by the close. The Fed indicated in its after-meeting commentary that the rate of economic contraction is slowing and inflation will remain "subdued for some time." This helped allay concerns that the rate of economic slowdown will increase and that inflation will spread. The central bank has kept its benchmark interest rate between zero and 0.25% since the fourth quarter of 2008. The Fed said its overnight lending rate will stay at "exceptionally low levels" for "an extended period."
The Q2 Webcast also aired on Wednesday, June 24th, and it is available for view ON DEMAND now (click here).
On Thursday, the market ended higher as the major averages bounced nicely after finding support near their respective moving averages. Federal Reserve Chairman Ben Bernanke told Congress he did not pressure Bank of America (BAC +3.24%) into acquiring Merrill Lynch in a deal that ultimately cost taxpayers $20 billion. Bank of America said it raised more than $12 billion in common equity on Thursday as it exchanged $3.9 billion of preferred stock in a public offering and $10.7 billion in private transactions. It issued about 989 million common shares.
On Friday, stocks ended mixed after data was released that showed the US savings rate soared to the highest level in 15 years! This sparked concern that consumer spending will slow and adversely affect economic growth. It was very encouraging to see the major averages and leading stocks to find support near their respective moving averages this week. As long as support holds, the current rally remains in tact.
PICTURED: The S&P 500 Index bounced after finding support near its 50-day moving average (DMA) line this week.
Money Management Services - WE FOLLOW THE RULES! DOES YOUR BROKER?
Managing money can be difficult at times. Are you looking for a money manager who follows a proven set of rules? If you are frustrated because your broker/money manager does not follow all of the rules of this powerful investment system, contact us. We have veterans who have been in business for over 20 years who pride themselves on their ability to closely follow all the rules of the investment system in both bull and bear markets. You may inquire about having your account professionally managed using this fact-based investment system by clicking HERE. *Accounts over $250,000 please. ** Serious inquiries only.
|
|
|
 |
Energy-Related Indexes Have Recently Slumped
Kenneth J. Gruneisen - Passed the CAN SLIM® Master's Exam
The Healthcare ($HMO +1.68%) group was one of Friday's stronger performing areas, and the major averages were helped by gains in the influential financial group as the Bank ($BKX +0.41%) and Broker/Dealer ($XBD +0.64%) indexes posted small gains. The Internet Index ($IIX +1.00%) led the tech sector, followed by gains from the Biotechnology ($BTK +0.78%) and Networking ($NWX +0.34%) indexes. There were modest losses for the Gold & Silver ($XAU -1.59%) and Integrated Oil ($XOI -0.65%) indexes. The Semiconductor Index ($SOX -0.08%) ended slightly in the red along with the Retail ($RLX -0.05%) and Oil Services ($OSX -0.07%) indexes.
Charts courtesy www.stockcharts.com
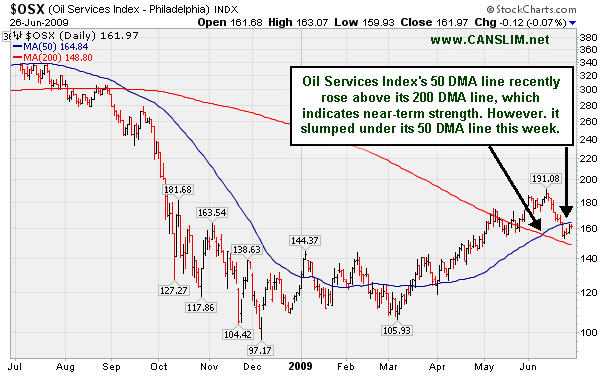
PICTURED 1: The Oil Services ($OSX -0.07%) Index's 50-day moving average (DMA) line recently rose above its 200 DMA line, which indicates near-term strength. However, it has lost ground in 9 of the past 11 sesions and it also slumped under its 50 DMA line this week.
Charts courtesy www.stockcharts.com
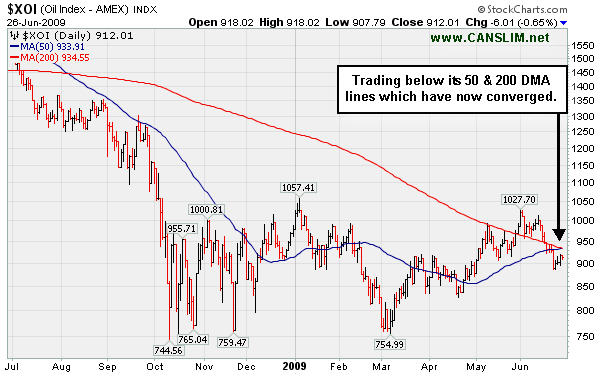
PICTURED 2: The Integrated Oil ($XOI -0.65%) has recently slumped and it is now trading below its 50 & 200 DMA lines which have converged.
| Oil Services |
$OSX |
161.97 |
-0.12 |
-0.07% |
+33.43% |
| Healthcare |
$HMO |
1,124.40 |
+18.60 |
+1.68% |
+17.10% |
| Integrated Oil |
$XOI |
912.01 |
-6.01 |
-0.65% |
-6.91% |
| Semiconductor |
$SOX |
263.05 |
-0.21 |
-0.08% |
+23.98% |
| Networking |
$NWX |
186.25 |
+0.64 |
+0.34% |
+29.44% |
| Internet |
$IIX |
188.20 |
+1.86 |
+1.00% |
+40.69% |
| Broker/Dealer |
$XBD |
99.26 |
+0.63 |
+0.64% |
+28.13% |
| Retail |
$RLX |
322.89 |
-0.16 |
-0.05% |
+15.62% |
| Gold & Silver |
$XAU |
143.80 |
-2.32 |
-1.59% |
+16.11% |
| Bank |
$BKX |
36.41 |
+0.15 |
+0.41% |
-17.85% |
| Biotech |
$BTK |
701.20 |
+5.44 |
+0.78% |
+8.35% |
|
|
|
 |
Quiet Consolidation Above Support at 50-Day Average and Prior Highs
Kenneth J. Gruneisen - Passed the CAN SLIM® Master's Exam
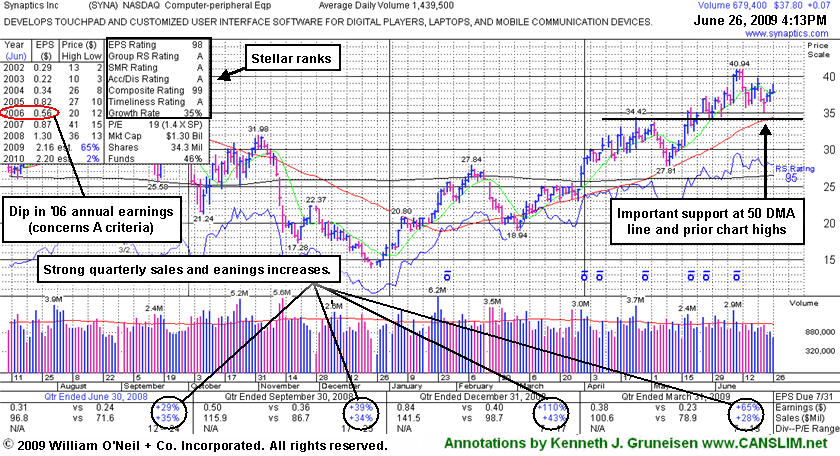
Synaptics Inc. (SYNA +$0.37 or +0.98% to $38.10) is quietly consolidating above its August 2008 chart highs ($36), its 50-day moving average DMA line, and recent chart highs which all closely coincide -defining an important support level. At its recent highs it was challenging its 2007 high near $41 and, technically, any subsequent breakout to new all-time highs would be undeniably bullish. It was first featured in yellow in the May 18, 2009 mid-day report (read here). The number of top-rated funds owning its shares rose from 123 in June '08 to 196 in March '09, which is good news concerning the I criteria. Strong earnings and sales revenues growth in the 4 latest quarterly comparisons satisfies the C criteria. Its annual earnings (the A criteria) history showed a downturn in 2006, leaving concerns, but it followed that up with strong growth the next 2 years.
|
|
|
Color Codes Explained :
Y - Better candidates highlighted by our
staff of experts.
G - Previously featured
in past reports as yellow but may no longer be buyable under the
guidelines.
***Last / Change / Volume quote data in this table corresponds with the timestamp on the note***
Symbol/Exchange
Company Name
Industry Group |
Last |
Chg. |
Vol
% DAV |
Date Featured |
Price Featured |
Latest Pivot Point
Featured |
Status |
| Latest Max Buy Price |
GMCR
- NASDAQ
Green Mtn Coffee Roastrs
FOOD & BEVERAGE - Processed & Packaged Goods
|
$56.08
|
N/A
|
N/A
N/A
|
1/1/2008
(Date
Featured) |
$27.13
(Price
Featured) |
PP = $28.66 |
G |
| MB = $30.09 |
Most Recent Note - 6/26/2009 5:42:29 PM
G - Negative reversal today for a loss on very heavy volume raises concerns while consolidating just above its 50 DMA line -important support to watch. On 6/09/09 it reached a new all-time high with a gain on light volume as a 3:2 stock split took effect. GMCR traded up more than +144% since appearing with an annotated graph under the headline "It May Soon Be Time To Go Green" when featured in the January 2009 CANSLIM.net News (read here).
>>> The latest Featured Stock Update with an annotated graph appeared on 6/22/2009. click here.
|
|
C
A
S
I |
News |
Chart |
SEC
View all notes Alert
me of new notes
Company
Profile
|
HMSY
- NASDAQ
H M S Holdings Corp
COMPUTER SOFTWARE & SERVICES - Healthcare Information Service
|
$40.75
|
N/A
|
N/A
N/A
|
2/20/2009
(Date
Featured) |
$34.08
(Price
Featured) |
PP = $38.38 |
G |
| MB = $40.30 |
Most Recent Note - 6/26/2009 5:45:14 PM
G - A third consecutive gain helped it reach a new all-time high today and close above its "max buy" level. Color code is changed to green after rising up more than +5% from its latest base. Prior chart highs near $38 are an important support level to watch, where deterioration into its prior base would raise concerns. Gap up gain on 6/16/09 with heavy volume triggered a technical buy signal. No overhead supply is left to hinder the progress for this Commercial Services - Healthcare firm.
>>> The latest Featured Stock Update with an annotated graph appeared on 6/16/2009. click here.
|
|
C
A
S
I |
News |
Chart |
SEC
View all notes Alert
me of new notes
Company
Profile
|
LFT
-
|
$25.95
|
N/A
|
N/A
N/A
|
4/2/2009
(Date
Featured) |
$22.19
(Price
Featured) |
PP = $21.81 |
G |
| MB = $22.90 |
Most Recent Note - 6/26/2009 5:46:43 PM
G - Gain today with heavy volume helped repair this week's violation of its 50 DMA line. Its progress could be hindered by future share offerings. This Chinese Computer Software firm recently filed a registration of approximately 16 million shares for resale, and it also revealed a planned acquisition of another Chinese service provider.
>>> The latest Featured Stock Update with an annotated graph appeared on 6/18/2009. click here.
|
|
C
A
S
I |
News |
Chart |
SEC
View all notes Alert
me of new notes
Company
Profile
|
NTES
- NASDAQ
Netease Inc Adr
INTERNET - Internet Information Providers
|
$37.68
|
N/A
|
N/A
N/A
|
5/21/2009
(Date
Featured) |
$31.19
(Price
Featured) |
PP = $32.75 |
G |
| MB = $34.39 |
Most Recent Note - 6/26/2009 5:48:44 PM
G - Found support this week and produced 4 straight gains while consolidating above its 50 DMA line and prior chart highs -important support to watch. Its 5/28/09 gap up and considerable gain with +79% above average volume confirmed a technical buy signal as it rose above its pivot point. Indications of institutional (the I criteria) buying demand have been noted after earnings news on 5/20/09 a shakeout tested support near its 50 DMA line. First featured at $26.75 in the 3/31/09 CANSLIM.net Mid-Day Breakouts Report (read here). This high-ranked Chinese Internet - Content firm was also summarized in greater detail including an annotated graph in the April 2009 issue of CANSLIM.net News (read here).
>>> The latest Featured Stock Update with an annotated graph appeared on 6/19/2009. click here.
|
|
C
A
S
I |
News |
Chart |
SEC
View all notes Alert
me of new notes
Company
Profile
|
NVEC
- NASDAQ
N V E Corp
ELECTRONICS - Semiconductor - Specialized
|
$48.56
|
N/A
|
N/A
N/A
|
3/13/2009
(Date
Featured) |
$33.85
(Price
Featured) |
PP = $45.50 |
G |
| MB = $47.78 |
Most Recent Note - 6/26/2009 5:51:04 PM
G - Gain today with above average volume for a new 52-week high above its "max buy" level. Color code is changed to green as it gets extended from a sound buy point. Its 6/19/09 gain with volume more than 2 times average helped it rise from an "ascending base" type pattern to a new 52-week high and multi-year high, triggering a technical buy signal. Sales increases in recent comparisons have been under the +25% guideline and still rather minuscule, leaving concerns, especially in the event of any hiccups. This is a reason to be especially disciplined about proper entries and exits.
>>> The latest Featured Stock Update with an annotated graph appeared on 6/23/2009. click here.
|
|
C
A
S
I |
News |
Chart |
SEC
View all notes Alert
me of new notes
Company
Profile
|
SNDA
-
|
$60.63
|
N/A
|
N/A
N/A
|
5/31/2009
(Date
Featured) |
$57.62
(Price
Featured) |
PP = $53.95 |
G |
| MB = $56.65 |
Most Recent Note - 6/26/2009 5:53:44 PM
G - Considerable gains helped promptly repair this week's violation of its 50 DMA line and prior chart highs -weakness which had raised concerns and triggered a technical sell signal. Its color code is changed to green after its latest bounce back above its "max buy" level. Detailed analysis was included when recently featured in the June 2009 issue of CANSLIM.net News. Be sure to review the "What to Look Out For" section and entire detailed summary - read here).
>>> The latest Featured Stock Update with an annotated graph appeared on 6/25/2009. click here.
|
|
C
A
S
I |
News |
Chart |
SEC
View all notes Alert
me of new notes
Company
Profile
|
SYNA
- NASDAQ
Synaptics Inc
COMPUTER SOFTWARE & SERVICES - Information Technology Service
|
$38.10
|
N/A
|
N/A
N/A
|
5/18/2009
(Date
Featured) |
$32.58
(Price
Featured) |
PP = $34.52 |
G |
| MB = $36.25 |
Most Recent Note - 6/26/2009 5:54:40 PM
G - Volume has been drying up while consolidating above its August 2008 chart highs ($36), its 50 DMA line, and recent chart highs that coincide -defining an important support level. First featured in yellow in the May 18, 2009 mid-day report (read here). The number of top-rated funds owning its shares rose from 123 in June '08 to 196 in March '09, which is good news concerning the I criteria. Its annual earnings (the A criteria) history showed a dowturn in 2006, leaving concerns, but it followed that up with strong growth the next 2 years. Its small supply of shares (the S criteria) outstanding could contribute to especially great volatility in the event of institutional accumulation or distribution.
>>> The latest Featured Stock Update with an annotated graph appeared on 6/26/2009. click here.
|
|
C
A
S
I |
News |
Chart |
SEC
View all notes Alert
me of new notes
Company
Profile
|
TNDM
- NASDAQ
Tandem Diabetes Care Inc
TELECOMMUNICATIONS - Wireless Communications
|
$30.27
|
N/A
|
N/A
N/A
|
3/2/2009
(Date
Featured) |
$18.89
(Price
Featured) |
PP = $29.85 |
G |
| MB = $31.34 |
Most Recent Note - 6/26/2009 5:56:12 PM
G - Considerable gain with more than twice average volume. Recently rebounding above its 50 DMA line, however a sound new base needs to form before new buying efforts might be justified under the investment system's guidelines. It traded up as much as +72.42% since first featured at $18.89 in the 3/02/09 Mid-Day BreakOuts Report (read here).
>>> The latest Featured Stock Update with an annotated graph appeared on 6/24/2009. click here.
|
|
C
A
S
I |
News |
Chart |
SEC
View all notes Alert
me of new notes
Company
Profile
|
|
|
|
THESE ARE NOT BUY RECOMMENDATIONS!
Comments contained in the body of this report are technical
opinions only. The material herein has been obtained
from sources believed to be reliable and accurate, however,
its accuracy and completeness cannot be guaranteed.
This site is not an investment advisor, hence it does
not endorse or recommend any securities or other investments.
Any recommendation contained in this report may not
be suitable for all investors and it is not to be deemed
an offer or solicitation on our part with respect to
the purchase or sale of any securities. All trademarks,
service marks and trade names appearing in this report
are the property of their respective owners, and are
likewise used for identification purposes only.
This report is a service available
only to active Paid Premium Members.
You may opt-out of receiving report notifications
at any time. Questions or comments may be submitted
by writing to Premium Membership Services 665 S.E. 10 Street, Suite 201 Deerfield Beach, FL 33441-5634 or by calling 1-800-965-8307
or 954-785-1121.
|
|
|


