You are not logged in.
This means you
CAN ONLY VIEW reports that were published prior to Monday, April 14, 2025.
You
MUST UPGRADE YOUR MEMBERSHIP if you want to see any current reports.
AFTER MARKET UPDATE - MONDAY, JUNE 25TH, 2012
Previous After Market Report Next After Market Report >>>
|
|
|
|
DOW |
-138.12 |
12,502.66 |
-1.09% |
|
Volume |
753,748,580 |
-52% |
|
Volume |
1,454,023,800 |
-34% |
|
NASDAQ |
-56.26 |
2,836.16 |
-1.95% |
|
Advancers |
687 |
22% |
|
Advancers |
650 |
25% |
|
S&P 500 |
-21.30 |
1,313.72 |
-1.60% |
|
Decliners |
2,380 |
75% |
|
Decliners |
1,871 |
72% |
|
Russell 2000 |
-13.26 |
761.90 |
-1.71% |
|
52 Wk Highs |
49 |
|
|
52 Wk Highs |
38 |
|
|
S&P 600 |
-6.71 |
424.59 |
-1.56% |
|
52 Wk Lows |
88 |
|
|
52 Wk Lows |
75 |
|
|
 |
Major Averages Fell With Lighter Volume Totals
Kenneth J. Gruneisen - Passed the CAN SLIM® Master's Exam
On Monday's session the indices closed in the red, albeit off of their worst levels. The volume totals were reported much lighter than the prior session totals on the Nasdaq exchange and on the NYSE, so at least there was not a pick up in institutional selling known as "distribution". Breadth was negative as decliners led advancers by more than a 3-1 ratio on the NYSE and nearly 3-1 on the Nasdaq exchange. The total number of new 52-week lows trumped new 52-week highs on both the NYSE and on the Nasdaq exchange. There were 10 high-ranked companies from the CANSLIM.net Leaders List made new 52-week highs and appeared on the CANSLIM.net BreakOuts Page, down from the prior session total of 18 stocks. At the session's close there was a gain for only 1 of the 17 high-ranked companies currently included on the Featured Stocks Page.
Stocks tested their session lows throughout the day as concerns over the European debt crisis overshadowed some positive economic reports. New home sales in May showed improvement, while manufacturing in the Dallas region surpassed projections. Despite the better-than-expected data, a gloomy outlook for the EU summit and Spain's request for financial assistance weighed heavily on the major averages.
All 10 sectors on the S&P ended lower, led by declines in tech stocks as Apple Inc (AAPL -1.95%) and Microsoft Corp (MSFT -2.72%) fell. Energy stocks were also under pressure as crude oil retreated 41 cents to $79.35 per barrel. Exxon Mobile corp (XOM -1.06%) and Chevron Corp (CVX -1.35%) closed in the red. In other news, Bristol-Myers Squibb Company (BMY -3.48%) and Pfizer Inc (PFE -1.12%) were down after the FDA rejected an application for the companies' joint-venture anti-clotting drug.
Turning to the fixed income market, Treasuries were higher along the curve with the benchmark 10-year note advancing 5/8 of a point to yield 1.61%.
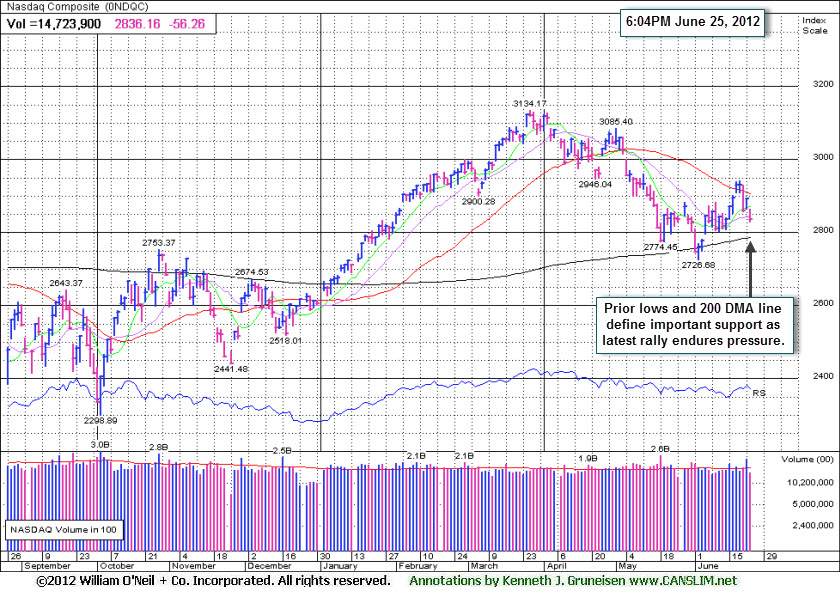
The nascent rally and confirmed uptrend came under pressure as all 3 major averages surrendered gains which had lifted them each above their respective 50-day moving average (DMA) lines last week. Technically, the major averages' (M criteria) current rally still allows fact-based investors to make new buying efforts, but only in sound buy candidates near proper entry points. As always, disciplined investors limit losses if any stock ever falls more than -7% from its purchase price.
The Q2 2012 Webcast is scheduled for Wednesday, June 27th at 8PM EST and will be available "ON DEMAND" afterward. All who have the UPGRADED membership now get access to these informative *Quarterly Webcasts included at no additional cost. (*Previously sold separately at $99 per webcast.) Links to archived webcasts and all prior reports are on the Premium Member Homepage. Please use the inquiry form to submit any questions that you would like to see answered in the upcoming webcast or to make any suggestions or comments about our website and services. Thank you!
PICTURED: The Nasdaq Composite Index is slumping back toward its prior lows and its 200-day moving average which define important support as the latest rally endures pressure. It promptly reversed below its downward sloping 50-day moving average (DMA) line after briefly getting above that important short-term average. Prior commentaries warned - "Additional distributional action could quickly quash the recently confirmed rally."
|
 Kenneth J. Gruneisen started out as a licensed stockbroker in August 1987, a couple of months prior to the historic stock market crash that took the Dow Jones Industrial Average down -22.6% in a single day. He has published daily fact-based fundamental and technical analysis on high-ranked stocks online for two decades. Through FACTBASEDINVESTING.COM, Kenneth provides educational articles, news, market commentary, and other information regarding proven investment systems that work in good times and bad.
Comments contained in the body of this report are technical opinions only and are not necessarily those of Gruneisen Growth Corp. The material herein has been obtained from sources believed to be reliable and accurate, however, its accuracy and completeness cannot be guaranteed. Our firm, employees, and customers may effect transactions, including transactions contrary to any recommendation herein, or have positions in the securities mentioned herein or options with respect thereto. Any recommendation contained in this report may not be suitable for all investors and it is not to be deemed an offer or solicitation on our part with respect to the purchase or sale of any securities. |
|
 |
Tech, Financial, Energy, and Retail Indexes Led Slump
Kenneth J. Gruneisen - Passed the CAN SLIM® Master's Exam
The tech sector saw unanimous losses from the Semiconductor Index ($SOX -3.46%), Networking Index ($NWX -3.19%), Internet Index ($IIX -2.53%), and the Biotechnology Index ($BTK -1.66%). Weakness from the Retail Index ($RLX -1.46%) and sputtering financials dragged the Broker/Dealer Index ($XBD -3.02%) and Bank Index ($BKX -2.66%) to losses which weighed on the major averages. Energy-related shares encountered pressure as the Integrated Oil Index ($XOI -1.98%) and Oil Services Index ($OSX -3.35%) tumbled. The Healthcare Index ($HMO -1.86%) also was weak, meanwhile a small gain made the Gold & Silver Index ($XAU +0.81%) a standout winner.
Charts courtesy www.stockcharts.com
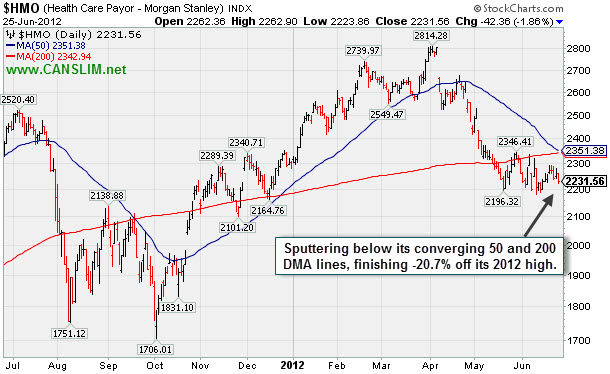
PICTURED: The Healthcare Index ($HMO -1.86%) is sputtering below its 50-day and 200-day moving average (DMA) lines, finishing -20.7% off its 2012 high. While a decision from the Supreme Court on Obamacare is expected soon, the group has slumped from the April highs below the "Bear Market" threshold of -20%.
| Oil Services |
$OSX |
186.27 |
-6.45 |
-3.35% |
-13.88% |
| Healthcare |
$HMO |
2,231.56 |
-42.36 |
-1.86% |
-2.19% |
| Integrated Oil |
$XOI |
1,093.50 |
-22.14 |
-1.98% |
-11.03% |
| Semiconductor |
$SOX |
365.55 |
-13.10 |
-3.46% |
+0.30% |
| Networking |
$NWX |
204.50 |
-6.75 |
-3.19% |
-4.96% |
| Internet |
$IIX |
290.65 |
-7.56 |
-2.53% |
+3.16% |
| Broker/Dealer |
$XBD |
83.16 |
-2.59 |
-3.02% |
-0.13% |
| Retail |
$RLX |
600.29 |
-8.92 |
-1.46% |
+14.73% |
| Gold & Silver |
$XAU |
157.56 |
+1.27 |
+0.81% |
-12.78% |
| Bank |
$BKX |
43.89 |
-1.20 |
-2.66% |
+11.45% |
| Biotech |
$BTK |
1,444.57 |
-24.41 |
-1.66% |
+32.36% |
|
|
|
 |
Pullback Testing Prior Highs Following Latest Breakout
Kenneth J. Gruneisen - Passed the CAN SLIM® Master's Exam
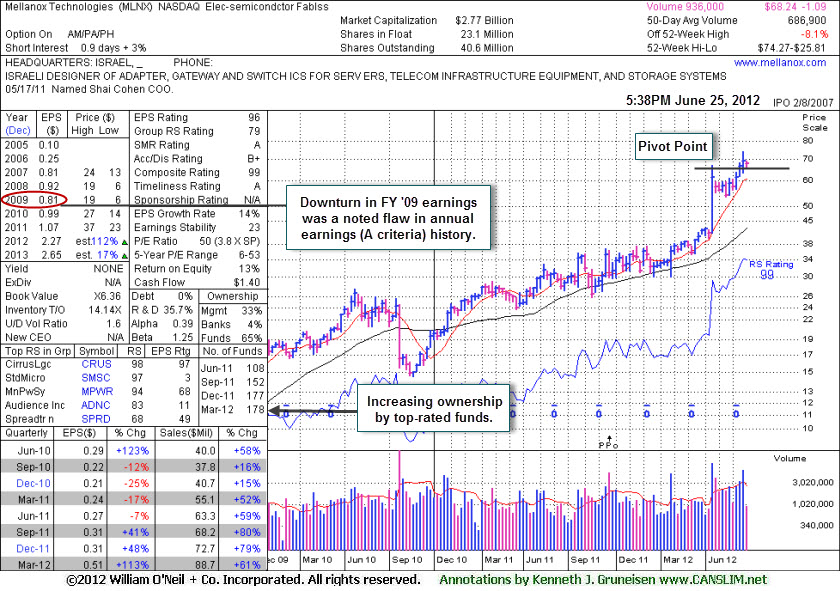
Mellanox Technologies Ltd (MLNX -$1.09 or -1.57% to $68.24) ended in the upper third of its intra-day range and above its pivot point today. Prior highs define chart support to watch. Disciplined investors limit losses if ever a stock falls more than -7% from their purchase price. The weekly graph below illustrates it recently hitting new 52-week highs while rising from a 9-week cup-shaped base without a handle.
It was featured with an annotated daily graph in yellow in the 6/18/12 mid-day report (read here) with a pivot point cited based on its 4/19/12 high plus 10 cents. It stayed well above its 50-day moving average (DMA) line during the latest consolidation. Reported earnings +113% on +61% sales revenues for the quarter ended March 31, 2012 versus the year ago period. Its streak of 3 strong quarterly earnings comparisons now satisfies the C criteria. A downturn in FY '09 earnings is a small flaw in its annual earnings (A criteria) history. Top-rated funds owning its shares rose from 108 in Jun '11 to 178 in Mar '12 a reassuring sign concerning the I criteria.
|
|
|
Color Codes Explained :
Y - Better candidates highlighted by our
staff of experts.
G - Previously featured
in past reports as yellow but may no longer be buyable under the
guidelines.
***Last / Change / Volume data in this table is the closing quote data***
Symbol/Exchange
Company Name
Industry Group |
PRICE |
CHANGE
(%Change) |
Day High |
Volume
(% DAV)
(% 50 day avg vol) |
52 Wk Hi
% From Hi |
Featured
Date |
Price
Featured |
Pivot Featured |
|
Max Buy |
ALXN
-
NASDAQ
Alexion Pharmaceuticals
DRUGS - Drug Manufacturers - Other
|
$95.90
|
-0.05
-0.05% |
$96.13
|
898,696
41.44% of 50 DAV
50 DAV is 2,168,900
|
$99.41
-3.53%
|
5/1/2012
|
$91.73
|
PP = $95.11
|
|
MB = $99.87
|
Most Recent Note - 6/19/2012 10:10:54 AM
Y - Gapped up today, clearing resistance in the $94-95 area and rising above its pivot point for a new 52-week high.
>>> The latest Featured Stock Update with an annotated graph appeared on 5/31/2012. Click here.
View all notes |
Alert me of new notes |
CANSLIM.net Company Profile |
SEC |
Zacks Reports |
StockTalk |
News |
Chart |
Request a new note
C
A N
S L
I M


|
ASPS
-
NASDAQ
Altisource Ptf Sltns Sa
REAL ESTATE - Property Management/Developmen
|
$70.78
|
-0.07
-0.10% |
$71.25
|
84,455
60.85% of 50 DAV
50 DAV is 138,800
|
$72.61
-2.52%
|
6/5/2012
|
$60.01
|
PP = $63.00
|
|
MB = $66.15
|
Most Recent Note - 6/19/2012 11:47:50 AM
G - Hitting another new 52-week high today. Prior highs in the $65 area define initial support to watch on pullbacks, meanwhile it is getting extended from its prior base.
>>> The latest Featured Stock Update with an annotated graph appeared on 6/5/2012. Click here.
View all notes |
Alert me of new notes |
CANSLIM.net Company Profile |
SEC |
Zacks Reports |
StockTalk |
News |
Chart |
Request a new note
C
A N
S L
I M
|
CERN
-
NASDAQ
Cerner Corp
COMPUTER SOFTWARE and SERVICES - Healthcare Information Service
|
$78.25
|
-2.55
-3.16% |
$79.87
|
1,526,732
104.46% of 50 DAV
50 DAV is 1,461,500
|
$88.32
-11.40%
|
6/7/2012
|
$78.36
|
PP = $84.20
|
|
MB = $88.41
|
 Most Recent Note - 6/25/2012 1:12:54 PM
G - Sinking under its 50 DMA line today raising concern and its color code is changed to green. Above average volume behind 2 consecutive losses negated its recent breakout. Disciplined investors always limit losses if ever a stock falls more than -7% from their purchase price.
>>> The latest Featured Stock Update with an annotated graph appeared on 6/7/2012. Click here.
View all notes |
Alert me of new notes |
CANSLIM.net Company Profile |
SEC |
Zacks Reports |
StockTalk |
News |
Chart |
Request a new note
C
A N
S L
I M
|
CMCSA
-
NASDAQ
Comcast Corp Cl A
MEDIA - CATV Systems
|
$30.33
|
-0.51
-1.64% |
$30.70
|
11,600,141
82.59% of 50 DAV
50 DAV is 14,046,300
|
$31.65
-4.19%
|
6/11/2012
|
$29.94
|
PP = $30.98
|
|
MB = $32.53
|
Most Recent Note - 6/20/2012 1:06:46 PM
Y - Perched at its 52-week high today, holding its ground after 4 consecutive gains. Its gain on 6/15/12 with +55% above average volume while rising above the new pivot point recently cited triggered a technical buy signal. The prior low ($28.09 on 5/21/12) defines important near-term support to watch.
>>> The latest Featured Stock Update with an annotated graph appeared on 6/11/2012. Click here.
View all notes |
Alert me of new notes |
CANSLIM.net Company Profile |
SEC |
Zacks Reports |
StockTalk |
News |
Chart |
Request a new note
C
A N
S L
I M
|
DG
-
NYSE
Dollar General Corp
RETAIL - Discount, Variety Stores
|
$53.19
|
+0.59
1.12% |
$53.45
|
3,847,228
107.54% of 50 DAV
50 DAV is 3,577,600
|
$53.06
0.25%
|
5/7/2012
|
$48.51
|
PP = $47.69
|
|
MB = $50.07
|
Most Recent Note - 6/22/2012 5:23:39 PM
G - Inched up today for a small gain with above average volume, perched near its all-time high. Completed another Secondary Offering on 6/05/12, its 4th Secondary Offering since September '11.
>>> The latest Featured Stock Update with an annotated graph appeared on 6/12/2012. Click here.
View all notes |
Alert me of new notes |
CANSLIM.net Company Profile |
SEC |
Zacks Reports |
StockTalk |
News |
Chart |
Request a new note
C
A N
S L
I M
|
Symbol/Exchange
Company Name
Industry Group |
PRICE |
CHANGE
(%Change) |
Day High |
Volume
(% DAV)
(% 50 day avg vol) |
52 Wk Hi
% From Hi |
Featured
Date |
Price
Featured |
Pivot Featured |
|
Max Buy |
ECHO
-
NASDAQ
Echo Global Logistics
DIVERSIFIED SERVICES - Business/Management Services
|
$18.86
|
-0.09
-0.47% |
$19.13
|
97,957
100.26% of 50 DAV
50 DAV is 97,700
|
$19.38
-2.68%
|
6/22/2012
|
$18.98
|
PP = $19.48
|
|
MB = $20.45
|
Most Recent Note - 6/22/2012 12:14:07 PM
Y - Faces little resistance due to overhead supply while rallying within close striking distance of its 52-week high today with another volume-driven gain. Color code is changed to yellow with new pivot point cited based on its 2/16/12 high plus 10 cents. A volume-driven gain above its pivot point may trigger a technical buy signal. Its fundamentals remain strong with respect to the C and A criteria. Found support above its 200 DMA line and it rebounded above its 50 DMA line in recent weeks since 3/28/12 when it was dropped from the Featured Stocks list.
>>> The latest Featured Stock Update with an annotated graph appeared on 6/22/2012. Click here.
View all notes |
Alert me of new notes |
CANSLIM.net Company Profile |
SEC |
Zacks Reports |
StockTalk |
News |
Chart |
Request a new note
C
A N
S L
I M
|
EXPE
-
NASDAQ
Expedia Inc
INTERNET - Internet Information Providers
|
$46.25
|
-1.78
-3.71% |
$47.86
|
3,009,912
63.72% of 50 DAV
50 DAV is 4,723,400
|
$50.66
-8.71%
|
4/27/2012
|
$41.80
|
PP = $35.57
|
|
MB = $37.35
|
Most Recent Note - 6/25/2012 1:15:07 PM
G - Pulling back -8.4% from its 52-week high today. It is extended from its prior highs in the $43 area and its 50 DMA line which define support.
>>> The latest Featured Stock Update with an annotated graph appeared on 6/8/2012. Click here.
View all notes |
Alert me of new notes |
CANSLIM.net Company Profile |
SEC |
Zacks Reports |
StockTalk |
News |
Chart |
Request a new note
C
A N
S L
I M
|
GNC
-
NYSE
G N C Holdings Inc
RETAIL - Drug Stores
|
$36.87
|
-0.21
-0.57% |
$37.17
|
1,782,014
77.22% of 50 DAV
50 DAV is 2,307,800
|
$41.95
-12.11%
|
1/19/2012
|
$28.99
|
PP = $29.60
|
|
MB = $31.08
|
Most Recent Note - 6/22/2012 5:16:25 PM
G - Posted a gain today with 3 times average volume as it continued rebounding toward its 50 DMA line which may now act as a resistance level. Gains above that short-term average would help its technical stance and improve the outlook.
>>> The latest Featured Stock Update with an annotated graph appeared on 6/6/2012. Click here.
View all notes |
Alert me of new notes |
CANSLIM.net Company Profile |
SEC |
Zacks Reports |
StockTalk |
News |
Chart |
Request a new note
C
A N
S L
I M
|
MLNX
-
NASDAQ
Mellanox Technologies
ELECTRONICS - Semiconductor - Broad Line
|
$68.24
|
-1.09
-1.57% |
$69.47
|
937,011
136.41% of 50 DAV
50 DAV is 686,900
|
$74.27
-8.12%
|
6/18/2012
|
$70.90
|
PP = $67.30
|
|
MB = $70.67
|
Most Recent Note - 6/25/2012 5:38:01 PM
Y - Finished the session in the upper third of its intra-day range and above its pivot point, but it was its 3rd loss with above average volume in the span of 4 sessions. Prior highs define chart support to watch. Disciplined investors limit losses if ever a stock falls more than -7% from their purchase price.
>>> The latest Featured Stock Update with an annotated graph appeared on 6/25/2012. Click here.
View all notes |
Alert me of new notes |
CANSLIM.net Company Profile |
SEC |
Zacks Reports |
StockTalk |
News |
Chart |
Request a new note
C
A N
S L
I M
|
N
-
NYSE
Netsuite Inc
DIVERSIFIED SERVICES - Business/Management Services
|
$51.50
|
-0.54
-1.04% |
$51.78
|
353,272
68.17% of 50 DAV
50 DAV is 518,200
|
$52.82
-2.50%
|
6/20/2012
|
$51.83
|
PP = $51.88
|
|
MB = $54.47
|
Most Recent Note - 6/22/2012 5:22:02 PM
Y - Posted a small gain today with more than 5 times average volume. It finished the week back above the pivot point cited based on its 3/27/12 high plus 10 cents.
>>> The latest Featured Stock Update with an annotated graph appeared on 6/20/2012. Click here.
View all notes |
Alert me of new notes |
CANSLIM.net Company Profile |
SEC |
Zacks Reports |
StockTalk |
News |
Chart |
Request a new note
C
A N
S L
I M
|
Symbol/Exchange
Company Name
Industry Group |
PRICE |
CHANGE
(%Change) |
Day High |
Volume
(% DAV)
(% 50 day avg vol) |
52 Wk Hi
% From Hi |
Featured
Date |
Price
Featured |
Pivot Featured |
|
Max Buy |
NTES
-
NASDAQ
Netease Inc Adr
INTERNET - Internet Information Providers
|
$56.50
|
-3.21
-5.38% |
$60.25
|
1,054,696
147.92% of 50 DAV
50 DAV is 713,000
|
$65.54
-13.79%
|
3/19/2012
|
$56.18
|
PP = $55.10
|
|
MB = $57.86
|
Most Recent Note - 6/25/2012 1:02:26 PM
G - Violated its 50 DMA line with a damaging loss today triggering a technical sell signal. Sinking near prior lows in the $55 area that define additional chart support.
>>> The latest Featured Stock Update with an annotated graph appeared on 6/19/2012. Click here.
View all notes |
Alert me of new notes |
CANSLIM.net Company Profile |
SEC |
Zacks Reports |
StockTalk |
News |
Chart |
Request a new note
C
A N
S L
I M
|
SWI
-
NYSE
Solarwinds Inc
COMPUTER SOFTWARE and SERVICES - Application Software
|
$43.42
|
-2.12
-4.66% |
$44.94
|
1,168,904
109.21% of 50 DAV
50 DAV is 1,070,300
|
$48.64
-10.73%
|
4/26/2012
|
$45.15
|
PP = $42.32
|
|
MB = $44.44
|
Most Recent Note - 6/25/2012 1:04:29 PM
G - Today's loss has it slumping under its 50 DMA line raising concerns, and its color code is changed to green. The 6/04/11 low ($41.24) defines important support to watch on pullbacks.
>>> The latest Featured Stock Update with an annotated graph appeared on 6/15/2012. Click here.
View all notes |
Alert me of new notes |
CANSLIM.net Company Profile |
SEC |
Zacks Reports |
StockTalk |
News |
Chart |
Request a new note
C
A N
S L
I M
|
SXCI
-
NASDAQ
S X C Health Solutions
COMPUTER SOFTWARE and SERVICES - Healthcare Information Service
|
$92.69
|
-2.82
-2.95% |
$94.39
|
678,974
50.52% of 50 DAV
50 DAV is 1,344,100
|
$103.97
-10.85%
|
6/14/2012
|
$94.71
|
PP = $100.60
|
|
MB = $105.63
|
Most Recent Note - 6/25/2012 1:05:40 PM
Y - Today's loss has it trading just above its 50 DMA line which defines important support. There was a "negative reversal" on 6/19/12 after hitting a new 52-week high, failing to close the session above its pivot point to clinch a convincing technical buy signal.
>>> The latest Featured Stock Update with an annotated graph appeared on 6/14/2012. Click here.
View all notes |
Alert me of new notes |
CANSLIM.net Company Profile |
SEC |
Zacks Reports |
StockTalk |
News |
Chart |
Request a new note
C
A N
S L
I M
|
TDG
-
NYSE
Transdigm Group Inc
AEROSPACE/DEFENSE - Aerospace/Defense Products and; Services
|
$126.15
|
-0.99
-0.78% |
$126.19
|
403,557
73.84% of 50 DAV
50 DAV is 546,500
|
$132.69
-4.93%
|
6/18/2012
|
$127.00
|
PP = $132.79
|
|
MB = $139.43
|
Most Recent Note - 6/25/2012 1:08:40 PM
Y - Today's 3rd consecutive loss has it pulling back near its 50 DMA line. It is still perched within -5.7% of its all-time high. Subsequent volume-driven gains above the pivot point may trigger a new (or add-on) technical buy signal. Its prior low ($118.43 on 5/18/12) defines the next important near-term chart support level to watch below its 50 DMA line.
>>> The latest Featured Stock Update with an annotated graph appeared on 6/18/2012. Click here.
View all notes |
Alert me of new notes |
CANSLIM.net Company Profile |
SEC |
Zacks Reports |
StockTalk |
News |
Chart |
Request a new note
C
A N
S L
I M
|
UA
-
NYSE
Under Armour Inc Cl A
CONSUMER NON-DURABLES - Textile - Apparel Clothing
|
$97.19
|
-2.57
-2.58% |
$98.47
|
766,564
73.76% of 50 DAV
50 DAV is 1,039,300
|
$107.86
-9.89%
|
2/15/2012
|
$85.77
|
PP = $84.86
|
|
MB = $89.10
|
Most Recent Note - 6/25/2012 1:10:24 PM
G - Sinking below its 50 DMA line today, raising concerns. It recently wedged to new 52-week highs without especially great volume conviction behind its gains.
>>> The latest Featured Stock Update with an annotated graph appeared on 6/21/2012. Click here.
View all notes |
Alert me of new notes |
CANSLIM.net Company Profile |
SEC |
Zacks Reports |
StockTalk |
News |
Chart |
Request a new note
C
A N
S L
I M
|
Symbol/Exchange
Company Name
Industry Group |
PRICE |
CHANGE
(%Change) |
Day High |
Volume
(% DAV)
(% 50 day avg vol) |
52 Wk Hi
% From Hi |
Featured
Date |
Price
Featured |
Pivot Featured |
|
Max Buy |
VSI
-
NYSE
Vitamin Shoppe Inc
SPECIALTY RETAIL - Specialty Retail, Other
|
$53.51
|
-0.65
-1.20% |
$54.01
|
249,920
50.20% of 50 DAV
50 DAV is 497,800
|
$55.29
-3.22%
|
4/25/2012
|
$47.77
|
PP = $48.46
|
|
MB = $50.88
|
Most Recent Note - 6/20/2012 1:11:12 PM
Y - Up today for a 4th consecutive gain, poised for a best-ever close. Found support above prior highs in the $48 area and above its 50 DMA line. One may consider a secondary buy point from its successful test of the 10 week average up to +5% above the recent high. Disciplined investors always limit losses by selling if a stock falls more than -7% from their buy price.
>>> The latest Featured Stock Update with an annotated graph appeared on 6/4/2012. Click here.
View all notes |
Alert me of new notes |
CANSLIM.net Company Profile |
SEC |
Zacks Reports |
StockTalk |
News |
Chart |
Request a new note
C
A N
S L
I M
|
WFM
-
NASDAQ
Whole Foods Market Inc
RETAIL - Grocery Stores
|
$95.56
|
-0.71
-0.74% |
$96.05
|
1,147,847
58.60% of 50 DAV
50 DAV is 1,958,800
|
$96.96
-1.44%
|
6/13/2012
|
$89.90
|
PP = $91.60
|
|
MB = $96.18
|
Most Recent Note - 6/22/2012 5:29:49 PM
G - Rallied to a new high close and new 52-week high with +80% above average volume behind its gain today. Color code is changed to green after closing above its "max buy" level. No resistance remains due to overhead supply. Its 50 DMA line and prior lows define important near-term support.
>>> The latest Featured Stock Update with an annotated graph appeared on 6/13/2012. Click here.
View all notes |
Alert me of new notes |
CANSLIM.net Company Profile |
SEC |
Zacks Reports |
StockTalk |
News |
Chart |
Request a new note
C
A N
S L
I M
|
|
|
|
THESE ARE NOT BUY RECOMMENDATIONS!
Comments contained in the body of this report are technical
opinions only. The material herein has been obtained
from sources believed to be reliable and accurate, however,
its accuracy and completeness cannot be guaranteed.
This site is not an investment advisor, hence it does
not endorse or recommend any securities or other investments.
Any recommendation contained in this report may not
be suitable for all investors and it is not to be deemed
an offer or solicitation on our part with respect to
the purchase or sale of any securities. All trademarks,
service marks and trade names appearing in this report
are the property of their respective owners, and are
likewise used for identification purposes only.
This report is a service available
only to active Paid Premium Members.
You may opt-out of receiving report notifications
at any time. Questions or comments may be submitted
by writing to Premium Membership Services 665 S.E. 10 Street, Suite 201 Deerfield Beach, FL 33441-5634 or by calling 1-800-965-8307
or 954-785-1121.
|
|
|

