You are not logged in.
This means you
CAN ONLY VIEW reports that were published prior to Monday, April 14, 2025.
You
MUST UPGRADE YOUR MEMBERSHIP if you want to see any current reports.
AFTER MARKET UPDATE - THURSDAY, JUNE 25TH, 2009
Previous After Market Report Next After Market Report >>>
|
|
|
|
DOW |
+172.54 |
8,472.40 |
+2.08% |
|
Volume |
1,176,473,210 |
+7% |
|
Volume |
2,273,069,570 |
+3% |
|
NASDAQ |
+37.20 |
1,829.54 |
+2.08% |
|
Advancers |
2,461 |
79% |
|
Advancers |
2,218 |
78% |
|
S&P 500 |
+19.34 |
920.28 |
+2.15% |
|
Decliners |
568 |
18% |
|
Decliners |
527 |
18% |
|
Russell 2000 |
+14.22 |
509.17 |
+2.87% |
|
52 Wk Highs |
14 |
|
|
52 Wk Highs |
29 |
|
|
S&P 600 |
+7.11 |
266.14 |
+2.74% |
|
52 Wk Lows |
8 |
|
|
52 Wk Lows |
5 |
|
|
 |
Positive Breadth And Expansion in New Highs With Better Volume
Kenneth J. Gruneisen - Passed the CAN SLIM® Master's Exam
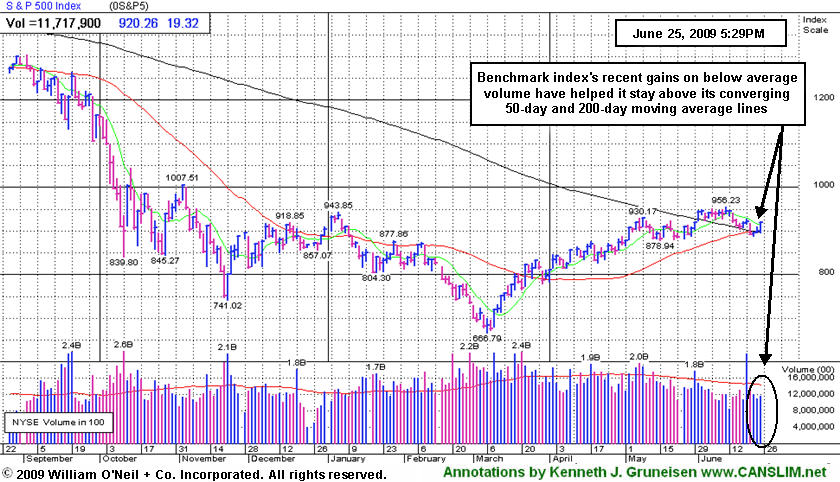
The major averages rebounded from small losses in the morning and made progress for the rest of the session, closing with impressive gains. Breadth was positive as advancers decisively led decliners by about a 4-to-1 ratio on the NYSE and on the Nasdaq exchange. Volume was reported higher on the NYSE and on the Nasdaq exchange, which was a reassuring sign of institutional accumulation. Also, there were 12 high-ranked companies from the CANSLIM.net Leaders List that made a new 52-week high and appeared on the CANSLIM.net BreakOuts Page, doubling the total of 6 issues that appeared on the prior session. This was a welcome improvement, while an even greater expansion in the new highs list in the weeks ahead would offer more encouraging news for growth oriented investors.
Retailers were among Thursday's leading gainers after Bed Bath & Beyond (BBBY +9.48%) gapped up following better-than-expected first quarter earnings, however the home furnishings firm's medicocre ranks and sub par fundamentals fall far short of the investment system's criteria for strong buy candidates. Fitch downgraded the state of California's long-term general obligation bond rating to "A-" from "A" and placed the bonds on Rating Watch negative "based on the magnitude of the state's financial and institutional challenges and persistent economic and revenue weakening." New economic data also included initial jobless claims for the week ending June 13 at 627,000, which was more than expected and up from the previous week. Continuing claims were up to 6.74 million, which exceeded forecasts yet is off record highs. The final reading for first quarter GDP showed a 5.5% annualized decline, which is a slight improvement from the 5.7% annualized decline previously reported.
Federal Reserve Chairman Ben Bernanke told Congress he did not pressure Bank of America (BAC -unch) into acquiring Merrill Lynch in a deal that ultimately cost taxpayers $20 billion. Bank of America said it raised more than $12 billion in common equity on Thursday as it exchanged $3.9 billion of preferred stock in a public offering and $10.7 billion in private transactions. It issued about 989 million common shares.
The Treasury Dept's $27 billion auction of 7-year Notes drew better-than-expected results. The benchmark 10-year Note traded up more than one full point, knocking the yield to just above 3.5%, while 30-year Bonds were bid almost two points higher, dropping its yield to about 4.3%.
PICTURED: The S&P 500 Index's recent gains have been backed by light volume while it is struggling to stay above its converging 50-day and 200-day moving average lines.
|
 Kenneth J. Gruneisen started out as a licensed stockbroker in August 1987, a couple of months prior to the historic stock market crash that took the Dow Jones Industrial Average down -22.6% in a single day. He has published daily fact-based fundamental and technical analysis on high-ranked stocks online for two decades. Through FACTBASEDINVESTING.COM, Kenneth provides educational articles, news, market commentary, and other information regarding proven investment systems that work in good times and bad.
Comments contained in the body of this report are technical opinions only and are not necessarily those of Gruneisen Growth Corp. The material herein has been obtained from sources believed to be reliable and accurate, however, its accuracy and completeness cannot be guaranteed. Our firm, employees, and customers may effect transactions, including transactions contrary to any recommendation herein, or have positions in the securities mentioned herein or options with respect thereto. Any recommendation contained in this report may not be suitable for all investors and it is not to be deemed an offer or solicitation on our part with respect to the purchase or sale of any securities. |
|
 |
Widespread Gains Help Major Averages Power Up
Kenneth J. Gruneisen - Passed the CAN SLIM® Master's Exam
The Retail Index ($RLX +3.76%) had a positive influence, and the Broker/Dealer Index ($XBD +3.17%) and the Bank Index ($BKX +1.91%) both overcame early weakness and finished strong, ending their 3rd consecutive sessions with solid gains. The tech sector showed widespread gains from the Networking ($NWX +1.99%), Semiconductor ($SOX +2.01%), Biotechnology ($BTK +2.73%), and Internet ($IIX +1.84%) indexes. The Healthcare ($HMO +3.47%) group ended solidly higher, and additional defensive positioning benefited the Oil Services ($OSX +3.57%) and Integrated Oil ($XOI +1.76%) indexes. Meanwhile, the Gold & Silver Index ($XAU +4.10%) rallied further above both its 50-day moving average (DMA) line and its March chart highs, indicative of support showing up after this week's earlier slide below those technically important levels.
Charts courtesy www.stockcharts.com
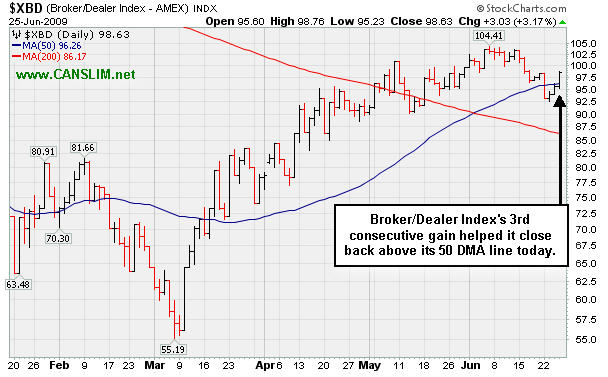
PICTURED: The Broker/Dealer Index ($XBD +3.17%) on Thursday posted a 3rd consecutive gain, closing back above its 50 DMA line.
| Oil Services |
$OSX |
162.09 |
+5.58 |
+3.57% |
+33.53% |
| Healthcare |
$HMO |
1,105.80 |
+37.04 |
+3.47% |
+15.17% |
| Integrated Oil |
$XOI |
918.02 |
+15.92 |
+1.76% |
-6.29% |
| Semiconductor |
$SOX |
263.26 |
+5.18 |
+2.01% |
+24.08% |
| Networking |
$NWX |
185.61 |
+3.62 |
+1.99% |
+28.99% |
| Internet |
$IIX |
186.34 |
+3.36 |
+1.84% |
+39.30% |
| Broker/Dealer |
$XBD |
98.63 |
+3.03 |
+3.17% |
+27.31% |
| Retail |
$RLX |
323.05 |
+11.71 |
+3.76% |
+15.68% |
| Gold & Silver |
$XAU |
146.12 |
+5.75 |
+4.10% |
+17.98% |
| Bank |
$BKX |
36.26 |
+0.68 |
+1.91% |
-18.19% |
| Biotech |
$BTK |
695.75 |
+18.47 |
+2.73% |
+7.51% |
|
|
|
 |
Signs of Support After Worrisome Weakness
Kenneth J. Gruneisen - Passed the CAN SLIM® Master's Exam
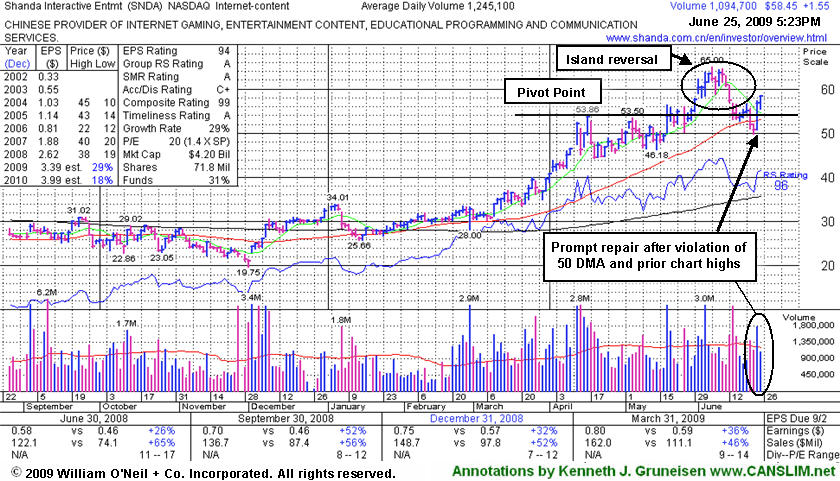
Shanda Interactive Ent Ltd's (SNDA $+1.55 or +2.72% to $58.45) color code was changed to yellow based on its resilience after recently noted distributional pressure. It posted a gain today on lighter volume after a considerable gain on higher volume helped promptly repair this week's violation of its 50-day moving average (DMA) line and prior chart highs -weakness which had raised concerns and triggered a technical sell signal. However, any subsequent deterioration under its short-term average and back into the prior base could be a more ominous sign, especially if volume swells and its latest low near $50 is violated. A closer look at its chart below identifies a worrisome "island reversal" pattern. In this case, its 6/01/09 gap up gain on heavy volume, followed by its 6/15/09 gap down and loss on heavy volume, completed a bearish island reversal. This week's gains have served to fill its latest gap and help it avoid slumping badly into its prior base, which is a somewhat encouraging sign of support.
Just after featured in the June 2009 issue of CANSLIM.net News, SNDA quickly got too extended from a proper buy point. In the stock's Featured Stock Update section appearance on June 3rd it was noted that, "Patient investors may watch for a pullback near its 50-day moving average (DMA) line, an important support level which has not been tested since breaking out above resistance at $34.00 back in March." Investors who may be considering SNDA trades now should be sure to review the additional analysis that was included in the "What to Look Out For" section of the June 2009 issue of CANSLIM.net News - read here).
|
|
|
Color Codes Explained :
Y - Better candidates highlighted by our
staff of experts.
G - Previously featured
in past reports as yellow but may no longer be buyable under the
guidelines.
***Last / Change / Volume quote data in this table corresponds with the timestamp on the note***
Symbol/Exchange
Company Name
Industry Group |
Last |
Chg. |
Vol
% DAV |
Date Featured |
Price Featured |
Latest Pivot Point
Featured |
Status |
| Latest Max Buy Price |
GMCR
- NASDAQ
Green Mtn Coffee Roastrs
FOOD & BEVERAGE - Processed & Packaged Goods
|
$57.23
|
N/A
|
N/A
N/A
|
1/1/2008
(Date
Featured) |
$27.13
(Price
Featured) |
PP = $28.66 |
G |
| MB = $30.09 |
Most Recent Note - 6/25/2009 2:29:55 PM
G - Consolidating just above its 50 DMA line -important support to watch. On 6/09/09 it reached a new all-time high with a gain on light volume as a 3:2 stock split took effect. GMCR traded up more than +144% since appearing with an annotated graph under the headline "It May Soon Be Time To Go Green" when featured in the January 2009 CANSLIM.net News (read here).
>>> The latest Featured Stock Update with an annotated graph appeared on 6/22/2009. click here.
|
|
C
A
S
I |
News |
Chart |
SEC
View all notes Alert
me of new notes
Company
Profile
|
HMSY
- NASDAQ
H M S Holdings Corp
COMPUTER SOFTWARE & SERVICES - Healthcare Information Service
|
$40.26
|
N/A
|
N/A
N/A
|
2/20/2009
(Date
Featured) |
$34.08
(Price
Featured) |
PP = $38.38 |
Y |
| MB = $40.30 |
Most Recent Note - 6/25/2009 2:32:56 PM
Y - Hovering near all-time highs and its "max buy" level after recent gains on higher volume. Prior chart highs near $38 are an important support level to watch, where deterioration into its prior base would raise concerns. Gap up gain on 6/16/09 with heavy volume triggered a technical buy signal. No overhead supply is left to hinder the progress for this Commercial Services - Healthcare firm.
>>> The latest Featured Stock Update with an annotated graph appeared on 6/16/2009. click here.
|
|
C
A
S
I |
News |
Chart |
SEC
View all notes Alert
me of new notes
Company
Profile
|
LFT
-
|
$24.65
|
N/A
|
N/A
N/A
|
4/2/2009
(Date
Featured) |
$22.19
(Price
Featured) |
PP = $21.81 |
G |
| MB = $22.90 |
Most Recent Note - 6/25/2009 2:34:30 PM
G - Recently violated its 50 DMA line, raising concerns, and its outlook becomes more questionable the longer it lingers below that important short-term average. Previously noted on 6/05/09 as it rose from a choppy (improper) base pattern. Its progress could be hindered by future share offerings. This Chinese Computer Software firm recently filed a registration of approximately 16 million shares for resale, and it also revealed a planned acquisition of another Chinese service provider.
>>> The latest Featured Stock Update with an annotated graph appeared on 6/18/2009. click here.
|
|
C
A
S
I |
News |
Chart |
SEC
View all notes Alert
me of new notes
Company
Profile
|
NTES
- NASDAQ
Netease Inc Adr
INTERNET - Internet Information Providers
|
$37.15
|
N/A
|
N/A
N/A
|
5/21/2009
(Date
Featured) |
$31.19
(Price
Featured) |
PP = $32.75 |
G |
| MB = $34.39 |
Most Recent Note - 6/25/2009 2:39:47 PM
G - Found support this week while consolidating near its 50 DMA line and prior chart highs -important support to watch. Its 5/28/09 gap up and considerable gain with +79% above average volume confirmed a technical buy signal as it rose above its pivot point. Indications of institutional (the I criteria) buying demand have been noted after earnings news on 5/20/09 a shakeout tested support near its 50 DMA line. First featured at $26.75 in the 3/31/09 CANSLIM.net Mid-Day Breakouts Report (read here). This high-ranked Chinese Internet - Content firm was also summarized in greater detail including an annotated graph in the April 2009 issue of CANSLIM.net News (read here).
>>> The latest Featured Stock Update with an annotated graph appeared on 6/19/2009. click here.
|
|
C
A
S
I |
News |
Chart |
SEC
View all notes Alert
me of new notes
Company
Profile
|
NVEC
- NASDAQ
N V E Corp
ELECTRONICS - Semiconductor - Specialized
|
$46.06
|
N/A
|
N/A
N/A
|
3/13/2009
(Date
Featured) |
$33.85
(Price
Featured) |
PP = $45.50 |
Y |
| MB = $47.78 |
Most Recent Note - 6/25/2009 2:42:31 PM
Y - Quietly consolidating just above its pivot point. Its 6/19/09 gain with volume more than 2 times average helped it rise from an "ascending base" type pattern to a new 52-week high and multi-year high, triggering a technical buy signal. Color code was changed to yellow with new pivot point and max buy prices noted in the 6/19 mid-day report (read here). Sales increases in recent comparisons have been under the +25% guideline and still rather minuscule, leaving concerns, especially in the event of any hiccups. This is a reason to be especially disciplined about proper entries and exits.
>>> The latest Featured Stock Update with an annotated graph appeared on 6/23/2009. click here.
|
|
C
A
S
I |
News |
Chart |
SEC
View all notes Alert
me of new notes
Company
Profile
|
SNDA
-
|
$57.50
|
N/A
|
N/A
N/A
|
5/31/2009
(Date
Featured) |
$57.62
(Price
Featured) |
PP = $53.95 |
Y |
| MB = $56.65 |
Most Recent Note - 6/25/2009 2:43:30 PM
Y - Holding its ground today after a considerable gain higher volume helped promptly repair this week's violation of its 50 DMA line and prior chart highs -weakness which had raised concerns and triggered a technical sell signal. Its color code was changed to yellow based on its resilience after the recently noted distributional pressure. Detailed analysis was included when recently featured in the June 2009 issue of CANSLIM.net News. Be sure to review the "What to Look Out For" section and entire detailed summary - read here).
>>> The latest Featured Stock Update with an annotated graph appeared on 6/25/2009. click here.
|
|
C
A
S
I |
News |
Chart |
SEC
View all notes Alert
me of new notes
Company
Profile
|
SYNA
- NASDAQ
Synaptics Inc
COMPUTER SOFTWARE & SERVICES - Information Technology Service
|
$37.01
|
N/A
|
N/A
N/A
|
5/18/2009
(Date
Featured) |
$32.58
(Price
Featured) |
PP = $34.52 |
G |
| MB = $36.25 |
Most Recent Note - 6/25/2009 2:44:36 PM
G - Quietly consolidating above its August 2008 chart highs ($36), its 50 DMA line, and recent chart highs that coincide -defining an important support level. First featured in yellow in the May 18, 2009 mid-day report (read here). The number of top-rated funds owning its shares rose from 123 in June '08 to 196 in March '09, which is good news concerning the I criteria. Its annual earnings (the A criteria) history showed a dowturn in 2006, leaving concerns, but it followed that up with strong growth the next 2 years. Its small supply of shares (the S criteria) outstanding could contribute to especially great volatility in the event of institutional accumulation or distribution.
>>> The latest Featured Stock Update with an annotated graph appeared on 6/15/2009. click here.
|
|
C
A
S
I |
News |
Chart |
SEC
View all notes Alert
me of new notes
Company
Profile
|
TNDM
- NASDAQ
Tandem Diabetes Care Inc
TELECOMMUNICATIONS - Wireless Communications
|
$28.26
|
N/A
|
N/A
N/A
|
3/2/2009
(Date
Featured) |
$18.89
(Price
Featured) |
PP = $29.85 |
G |
| MB = $31.34 |
Most Recent Note - 6/25/2009 2:45:42 PM
G - Volume is drying up while it quietly consolidates after rebounding above its 50 DMA line. A sound base needs to form before new buying efforts might be justified under the investment system's guidelines. It traded up as much as +72.42% since first featured at $18.89 in the 3/02/09 Mid-Day BreakOuts Report (read here).
>>> The latest Featured Stock Update with an annotated graph appeared on 6/24/2009. click here.
|
|
C
A
S
I |
News |
Chart |
SEC
View all notes Alert
me of new notes
Company
Profile
|
|
|
|
THESE ARE NOT BUY RECOMMENDATIONS!
Comments contained in the body of this report are technical
opinions only. The material herein has been obtained
from sources believed to be reliable and accurate, however,
its accuracy and completeness cannot be guaranteed.
This site is not an investment advisor, hence it does
not endorse or recommend any securities or other investments.
Any recommendation contained in this report may not
be suitable for all investors and it is not to be deemed
an offer or solicitation on our part with respect to
the purchase or sale of any securities. All trademarks,
service marks and trade names appearing in this report
are the property of their respective owners, and are
likewise used for identification purposes only.
This report is a service available
only to active Paid Premium Members.
You may opt-out of receiving report notifications
at any time. Questions or comments may be submitted
by writing to Premium Membership Services 665 S.E. 10 Street, Suite 201 Deerfield Beach, FL 33441-5634 or by calling 1-800-965-8307
or 954-785-1121.
|
|
|

