You are not logged in.
This means you
CAN ONLY VIEW reports that were published prior to Monday, April 14, 2025.
You
MUST UPGRADE YOUR MEMBERSHIP if you want to see any current reports.
AFTER MARKET UPDATE - MONDAY, JUNE 24TH, 2013
Previous After Market Report Next After Market Report >>>
|
|
|
|
DOW |
-139.84 |
14,659.56 |
-0.94% |
|
Volume |
968,421,750 |
-52% |
|
Volume |
1,951,128,270 |
-27% |
|
NASDAQ |
-36.49 |
3,320.76 |
-1.09% |
|
Advancers |
393 |
12% |
|
Advancers |
594 |
23% |
|
S&P 500 |
-19.34 |
1,573.09 |
-1.21% |
|
Decliners |
2,711 |
86% |
|
Decliners |
1,951 |
75% |
|
Russell 2000 |
-12.63 |
951.05 |
-1.31% |
|
52 Wk Highs |
18 |
|
|
52 Wk Highs |
50 |
|
|
S&P 600 |
-6.95 |
536.32 |
-1.28% |
|
52 Wk Lows |
572 |
|
|
52 Wk Lows |
111 |
|
|
 |
Indices Rebounded From Lows But Still Lost More Ground
Kenneth J. Gruneisen - Passed the CAN SLIM® Master's Exam
The major averages ended Monday's session lower, albeit off of their worst levels. Volume totals were reported lighter than the prior session totals on the NYSE and on the Nasdaq exchange. Breadth was very negative as decliners led advancers by more than a 6-1 margin on the NYSE and by more than 3-1 on the Nasdaq exchange. There were 13 high-ranked companies from the CANSLIM.net Leaders List made new 52-week highs and appeared on the CANSLIM.net BreakOuts Page, up from the prior session total of 9 stocks, but a far cry from the total of 72 last Tuesday. The list of stocks hitting new 52-lows expanded and solidly outnumbered new 52-week highs on both the NYSE and the Nasdaq exchange. There was a gain for only 1 of the 8 high-ranked companies currently included on the Featured Stocks Page, a list that has been waning in recent weeks.
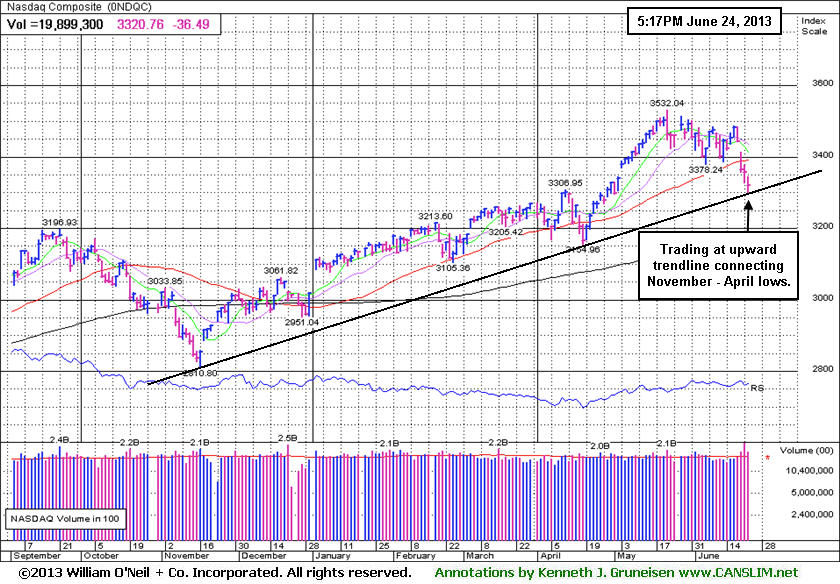
The Dow Jones Industrial Average fell almost 140 points to 14,659 after being down by as many as 248 points in early action. Stocks were under pressure from the opening bell as investors faced concerns over the health of China's banking system and their economic growth. Despite this, equities trimmed their losses following optimistic comments from several regional Fed Presidents.
Nine of the 10 sectors on the S&P finished lower led by declines in telecom stocks. Shares of Aruba Networks Inc (ARUN -3.22%). On the M&A front, Vanguard Health Systems Inc (VHS +67.34%) rallied on news that the company was being acquired by Tenet Healthcare Corp (THC +4.49%) for about $4.3 billion. In other news, Apple Inc (AAPL -2.65%) to $402.54 after briefly breaking below $400 per share.
Turning to fixed income markets, Treasuries ended mixed along the curve. The benchmark 10-year note was down 7/32 to yield 2.57% and the 30-year bond advanced 1/4 of a point to yield 3.57%.
The market (M criteria) weakness has been noted as a "correction" and this commentary has repeatedly reminded members - "Be protective of any gains, and limit losses! Be especially watchful for any individual issues flashing technical sell signals. It is vitally important to your success with the fact-based investment system to reduce exposure and preserve cash during market downdrafts."
There is a need for caution until a follow-through day of meaningful gains from at least one of the major averages on higher volume coupled with an expansion in leadership (stocks hitting new 52-week highs). Watch upcoming CANSLIM.net reports and especially the bold portion for us to observe any noteworthy shifts in the market direction (M criteria).
Individual leaders best matching the winning models of the fact-based investment system are on the Featured Stocks Page - with our Certified experts' latest notes and links to additional resources including detailed analysis with annotated graphs. The Premium Member Homepage - includes "dynamic archives" to all prior pay reports published. Watch for an announcement via email concerning the next WEBCAST.
PICTURED: The Nasdaq Composite Index traded near an upward trendline connecting its November - April lows after a damaging violation of its 50-day moving average (DMA) line and prior lows last week.
|
 Kenneth J. Gruneisen started out as a licensed stockbroker in August 1987, a couple of months prior to the historic stock market crash that took the Dow Jones Industrial Average down -22.6% in a single day. He has published daily fact-based fundamental and technical analysis on high-ranked stocks online for two decades. Through FACTBASEDINVESTING.COM, Kenneth provides educational articles, news, market commentary, and other information regarding proven investment systems that work in good times and bad.
Comments contained in the body of this report are technical opinions only and are not necessarily those of Gruneisen Growth Corp. The material herein has been obtained from sources believed to be reliable and accurate, however, its accuracy and completeness cannot be guaranteed. Our firm, employees, and customers may effect transactions, including transactions contrary to any recommendation herein, or have positions in the securities mentioned herein or options with respect thereto. Any recommendation contained in this report may not be suitable for all investors and it is not to be deemed an offer or solicitation on our part with respect to the purchase or sale of any securities. |
|
 |
Financial, Retail, Tech, and Commodity-Linked Groups Ended Lower
Kenneth J. Gruneisen - Passed the CAN SLIM® Master's Exam
On Monday the Gold & Silver Index ($XAU -4.46%) was a standout decliner with yet another big loss. The Networking Index ($NWX -2.53%), Semiconductor Index ($SOX -2.02%), and the Internet Index ($IIX -1.48%) led the tech sector lower, meanwhile the Biotechnology Index ($BTK +0.05%) and the Healthcare Index ($HMO +0.26%) eked out very slight gains. The Bank Index ($BKX -1.60%) and Broker/Dealer Index ($XBD -1.58%) lost ground as weakness in financial shares and the Retail Index ($RLX -0.95%) weighed on the major averages. Weakness in energy-related shares pressured the Integrated Oil Index ($XOI -1.67%) and the Oil Services Index ($OSX -1.31%) which both ended with losses.
Charts courtesy www.stockcharts.com
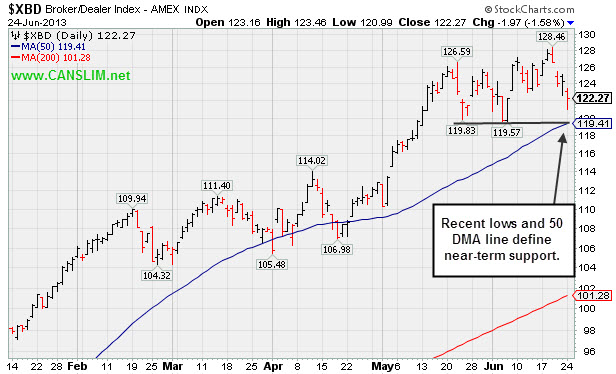
PICTURED: The Broker/Dealer Index ($XBD -1.58%) is consolidating above its 50-day moving average (DMA) line and recent lows defining near-term support.
| Oil Services |
$OSX |
247.92 |
-3.29 |
-1.31% |
+12.61% |
| Healthcare |
$HMO |
3,139.74 |
+8.16 |
+0.26% |
+24.88% |
| Integrated Oil |
$XOI |
1,300.80 |
-22.14 |
-1.67% |
+4.75% |
| Semiconductor |
$SOX |
451.55 |
-9.30 |
-2.02% |
+17.57% |
| Networking |
$NWX |
253.92 |
-6.60 |
-2.53% |
+12.08% |
| Internet |
$IIX |
368.67 |
-5.55 |
-1.48% |
+12.74% |
| Broker/Dealer |
$XBD |
122.27 |
-1.97 |
-1.58% |
+29.62% |
| Retail |
$RLX |
765.56 |
-7.35 |
-0.95% |
+17.23% |
| Gold & Silver |
$XAU |
87.33 |
-4.08 |
-4.46% |
-47.26% |
| Bank |
$BKX |
59.19 |
-0.96 |
-1.60% |
+15.43% |
| Biotech |
$BTK |
1,863.69 |
+0.98 |
+0.05% |
+20.47% |
|
|
|
 |
Completed Public Offering Following M&A News
Kenneth J. Gruneisen - Passed the CAN SLIM® Master's Exam
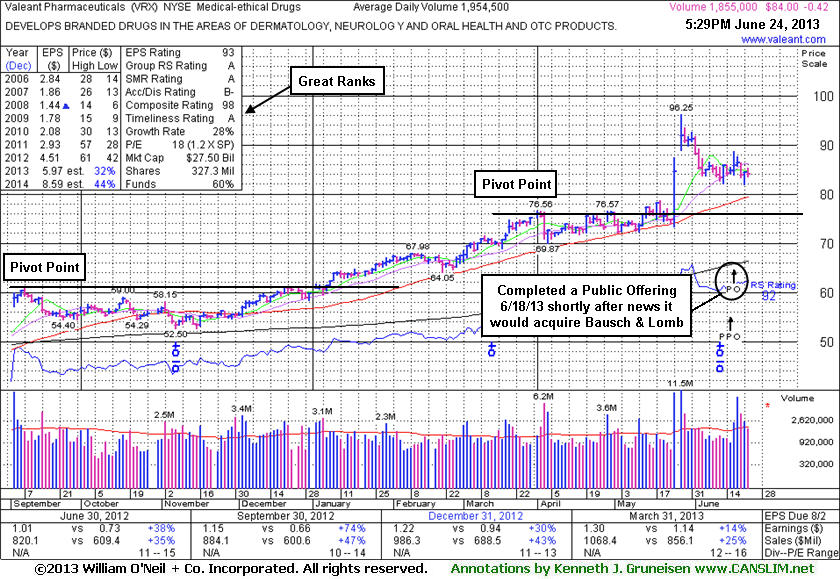
Valeant Pharmaceuticals International, Inc (VRX -$0.42 or -0.50% to $84.00) completed a new Public Offering on 6/18/13. Concerns were raised by its sub par Mar '13 earnings report. Its 50 DMA line ($78.95) defines near-term support above prior highs in the $76 area. VRX was last shown in this FSU section on 6/07/13 with an annotated graph under the headline, "Rallied on Recently Announced Acquisition News", after the high-ranked Medical - Ethical Drugs firm announced plans to buy Bausch & Lomb for $8.7 billion. Time alone will tell if its recent acquisitions will result in stronger earnings in the upcoming quarterly comparisons.
Prior reports noted - "Investors are taught in the Certification to only buy stocks with a combination of both strong fundamentals and strong technical action, however stocks should be sold based on their technical action only. In this example, more bullish action rewarded patient investors still giving it the benefit of the doubt until any technical sell signals start adding up."
The number of top-rated funds owning its shares rose from 818 in Mar '12 in to 968 in Mar '13, a reassuring trend concerning the I criteria. Quarterly earnings increases (C criteria) had been strong and well above the +25% guideline until the Mar '13 period, which only showed a +14% earnings increase (see red circle) over the year-ago period. A downturn in FY '07 and '08 earnings (A criteria) has been followed by a strong earnings rebound in recent years. Return On Equity is currently reported at 37%, well above the 17% minimum guideline of the fact-based system.
|
|
|
Color Codes Explained :
Y - Better candidates highlighted by our
staff of experts.
G - Previously featured
in past reports as yellow but may no longer be buyable under the
guidelines.
***Last / Change / Volume data in this table is the closing quote data***
Symbol/Exchange
Company Name
Industry Group |
PRICE |
CHANGE
(%Change) |
Day High |
Volume
(% DAV)
(% 50 day avg vol) |
52 Wk Hi
% From Hi |
Featured
Date |
Price
Featured |
Pivot Featured |
|
Max Buy |
AMBA
-
NASDAQ
Ambarella Inc
ELECTRONICS - Semiconductor - Specialized
|
$15.95
|
-1.12
-6.56% |
$16.55
|
1,850,387
172.68% of 50 DAV
50 DAV is 1,071,600
|
$18.58
-14.16%
|
5/6/2013
|
$15.31
|
PP = $16.10
|
|
MB = $16.91
|
 Most Recent Note - 6/24/2013 11:50:07 AM
G - Gapped down today, retreating near recent lows and its 50 DMA line ($15.24 now) defining important chart support to watch on pullbacks. Losses on above average volume last week indicated distributional pressure while reversing from its 52-week high.
>>> The latest Featured Stock Update with an annotated graph appeared on 6/14/2013. Click here.
View all notes |
Alert me of new notes |
CANSLIM.net Company Profile |
SEC |
Zacks Reports |
StockTalk |
News |
Chart |
Request a new note
C
A N
S L
I M


|
EQM
-
NYSE
E Q T Midstream Partners
ENERGY - Oil and Gas Pipelines
|
$48.92
|
-0.95
-1.90% |
$49.74
|
157,914
115.27% of 50 DAV
50 DAV is 137,000
|
$51.72
-5.41%
|
4/25/2013
|
$40.16
|
PP = $40.84
|
|
MB = $42.88
|
Most Recent Note - 6/21/2013 4:56:24 PM
G - Encountered distributional pressure and ended with a loss with above average volume after challenging its 52-week high this week. Recent low and its 50 DMA line define important near-term support in the $45 area. See the latest FSU analysis for more details and a new annotated graph.
>>> The latest Featured Stock Update with an annotated graph appeared on 6/21/2013. Click here.
View all notes |
Alert me of new notes |
CANSLIM.net Company Profile |
SEC |
Zacks Reports |
StockTalk |
News |
Chart |
Request a new note
C
A N
S L
I M
|
FLT
-
NYSE
Fleetcor Technologies
DIVERSIFIED SERVICES - Business/Management Services
|
$82.38
|
-1.42
-1.69% |
$83.24
|
1,100,298
122.81% of 50 DAV
50 DAV is 895,900
|
$89.75
-8.21%
|
5/29/2013
|
$86.02
|
PP = $85.66
|
|
MB = $89.94
|
Most Recent Note - 6/20/2013 7:52:37 PM
Y- Fell with above average volume today, slumping below its pivot point and toward its 50 DMA line ($81.64) defining important near-term chart support. See the latest FSU analysis for more details and an annotated graph.
>>> The latest Featured Stock Update with an annotated graph appeared on 6/18/2013. Click here.
View all notes |
Alert me of new notes |
CANSLIM.net Company Profile |
SEC |
Zacks Reports |
StockTalk |
News |
Chart |
Request a new note
C
A N
S L
I M
|
LOPE
-
NASDAQ
Grand Canyon Education
DIVERSIFIED SERVICES - Education and; Training Services
|
$30.88
|
-0.44
-1.40% |
$31.41
|
446,967
114.78% of 50 DAV
50 DAV is 389,400
|
$34.07
-9.36%
|
6/19/2013
|
$31.47
|
PP = $34.17
|
|
MB = $35.88
|
Most Recent Note - 6/19/2013 8:23:07 PM
Y - Color code is changed to yellow with a new pivot point cited based on its 5/22/13 high plus 10 cents. Subsequent volume driven gains above its pivot point may trigger a new technical buy signal. Consolidating above its 50 DMA line and well above additional support at prior highs in the $27 area. See the latest FSU analysis for more details and a new annotated graph.
>>> The latest Featured Stock Update with an annotated graph appeared on 6/19/2013. Click here.
View all notes |
Alert me of new notes |
CANSLIM.net Company Profile |
SEC |
Zacks Reports |
StockTalk |
News |
Chart |
Request a new note
C
A N
S L
I M
|
PRAA
-
NASDAQ
Portfolio Recovery Assoc
DIVERSIFIED SERVICES - Business/Management Services
|
$155.14
|
-4.59
-2.87% |
$159.07
|
166,286
211.83% of 50 DAV
50 DAV is 78,500
|
$163.87
-5.33%
|
5/1/2013
|
$130.77
|
PP = $127.88
|
|
MB = $134.27
|
Most Recent Note - 6/24/2013 5:45:43 PM
G - Retreating from its all-time high with a loss today backed by above average volume. Extended from any sound base, it has rallied with no resistance due to overhead supply. Its 50 DMA line defines important near-term chart support.
>>> The latest Featured Stock Update with an annotated graph appeared on 6/10/2013. Click here.
View all notes |
Alert me of new notes |
CANSLIM.net Company Profile |
SEC |
Zacks Reports |
StockTalk |
News |
Chart |
Request a new note
C
A N
S L
I M
|
Symbol/Exchange
Company Name
Industry Group |
PRICE |
CHANGE
(%Change) |
Day High |
Volume
(% DAV)
(% 50 day avg vol) |
52 Wk Hi
% From Hi |
Featured
Date |
Price
Featured |
Pivot Featured |
|
Max Buy |
PRLB
-
NYSE
Proto Labs Inc
MANUFACTURING - Small Tools and Accessories
|
$61.40
|
+1.40
2.33% |
$61.72
|
631,735
121.39% of 50 DAV
50 DAV is 520,400
|
$65.12
-5.71%
|
6/17/2013
|
$59.37
|
PP = $59.94
|
|
MB = $62.94
|
Most Recent Note - 6/24/2013 11:54:04 AM
Y- Gapped down today raising concerns following 2 consecutive losses with above average volume, now undercutting its pivot point and prior highs previously noted as initial support to watch. Disciplined investors always limit losses if any stock falls more than -7% from their purchase price. A close below its old high close ($59.13 on 5/10/13) would completely negate the prior technical breakout.
>>> The latest Featured Stock Update with an annotated graph appeared on 6/12/2013. Click here.
View all notes |
Alert me of new notes |
CANSLIM.net Company Profile |
SEC |
Zacks Reports |
StockTalk |
News |
Chart |
Request a new note
C
A N
S L
I M
|
RRTS
-
NYSE
Roadrunner Trans Systems
TRANSPORTATION - Air Delivery and Freight Service
|
$26.36
|
-0.19
-0.72% |
$26.55
|
115,829
56.92% of 50 DAV
50 DAV is 203,500
|
$29.52
-10.70%
|
4/3/2013
|
$22.77
|
PP = $23.75
|
|
MB = $24.94
|
Most Recent Note - 6/20/2013 7:49:35 PM
G - Followed a "negative reversal" at its 52-week high with 3 losses on lighter volume. Fundamental concerns were raised by its sub par earnings increase in the Mar '13 quarter. See the latest FSU analysis for more details and a new annotated graph.
>>> The latest Featured Stock Update with an annotated graph appeared on 6/20/2013. Click here.
View all notes |
Alert me of new notes |
CANSLIM.net Company Profile |
SEC |
Zacks Reports |
StockTalk |
News |
Chart |
Request a new note
C
A N
S L
I M
|
VRX
-
NYSE
Valeant Pharmaceuticals
DRUGS - Drug Manufacturers - Other
|
$84.00
|
-0.42
-0.50% |
$85.33
|
1,860,405
95.19% of 50 DAV
50 DAV is 1,954,500
|
$96.25
-12.73%
|
4/30/2013
|
$60.24
|
PP = $76.66
|
|
MB = $80.49
|
Most Recent Note - 6/24/2013 5:44:12 PM
G- Completed a new Public Offering on 6/18/13 following recent M&A news. Concerns were raised by its sub par Mar '13 earnings report. See latest FSU analysis for more details and a new annotated graph.
>>> The latest Featured Stock Update with an annotated graph appeared on 6/24/2013. Click here.
View all notes |
Alert me of new notes |
CANSLIM.net Company Profile |
SEC |
Zacks Reports |
StockTalk |
News |
Chart |
Request a new note
C
A N
S L
I M
|
|
|
|
THESE ARE NOT BUY RECOMMENDATIONS!
Comments contained in the body of this report are technical
opinions only. The material herein has been obtained
from sources believed to be reliable and accurate, however,
its accuracy and completeness cannot be guaranteed.
This site is not an investment advisor, hence it does
not endorse or recommend any securities or other investments.
Any recommendation contained in this report may not
be suitable for all investors and it is not to be deemed
an offer or solicitation on our part with respect to
the purchase or sale of any securities. All trademarks,
service marks and trade names appearing in this report
are the property of their respective owners, and are
likewise used for identification purposes only.
This report is a service available
only to active Paid Premium Members.
You may opt-out of receiving report notifications
at any time. Questions or comments may be submitted
by writing to Premium Membership Services 665 S.E. 10 Street, Suite 201 Deerfield Beach, FL 33441-5634 or by calling 1-800-965-8307
or 954-785-1121.
|
|
|

