You are not logged in.
This means you
CAN ONLY VIEW reports that were published prior to Monday, April 14, 2025.
You
MUST UPGRADE YOUR MEMBERSHIP if you want to see any current reports.
AFTER MARKET UPDATE - WEDNESDAY, JUNE 24TH, 2009
Previous After Market Report Next After Market Report >>>
|
|
|
|
DOW |
-23.05 |
8,299.86 |
-0.28% |
|
Volume |
1,100,878,610 |
-9% |
|
Volume |
2,208,244,190 |
-0% |
|
NASDAQ |
+27.42 |
1,792.34 |
+1.55% |
|
Advancers |
2,186 |
70% |
|
Advancers |
1,613 |
56% |
|
S&P 500 |
+5.84 |
900.94 |
+0.65% |
|
Decliners |
841 |
27% |
|
Decliners |
1,120 |
39% |
|
Russell 2000 |
+5.18 |
494.95 |
+1.06% |
|
52 Wk Highs |
10 |
|
|
52 Wk Highs |
25 |
|
|
S&P 600 |
+2.05 |
259.03 |
+0.80% |
|
52 Wk Lows |
3 |
|
|
52 Wk Lows |
12 |
|
|
 |
Major Indices Finish Mixed Again: Fed Holds Rates Near Zero
Adam Sarhan, Contributing Writer,
The major averages ended mixed again after a stronger than expected durable goods report was released and the Fed decided to hold interest rates steady. Advancers led decliners by over a 2-to-1 ratio on the NYSE and by about a 3-to-2 ratio on the Nasdaq exchange. Volume was reported lower on the NYSE and very near the prior session total on the Nasdaq exchange. There were only 6 high-ranked companies from the CANSLIM.net Leaders List that made a new 52-week high and appeared on the CANSLIM.net BreakOuts Page, lower than the 8 issues that appeared on the prior session. A greater expansion in the new highs list would offer encouraging news for growth oriented investors.
Investors sold stocks after the Federal Reserve did not increase the size of its $1.75 trillion bond-purchase program, sending the Dow Jones Industrial Average into negative territory. The Fed indicated in its after-meeting commentary that the rate of economic contraction is slowing and inflation will remain "subdued for some time." This helped allay concerns that the rate of economic slowdown will increase and that inflation will spread. The central bank has kept its benchmark interest rate between zero and 0.25% since the fourth quarter of 2008. The Fed said its overnight lending rate will stay at "exceptionally low levels" for "an extended period."
News on the economic front was mostly positive, which helped the major averages rally in the first half of the session. The Organization for Economic Cooperation and Development (OECD) raised its forecast for the economy of its 30 member nations for the first time since 2007 as the US slump shows signs of easing. The report showed that the combined economy of the world’s largest countries will fall -4.1% in 2009 and expand by +0.7% in 2010. The Commerce Department surprised the Street when they said that durable goods orders unexpectedly jumped in May. This was the latest in a series of stronger than expected economic data. Durable goods rose +1.8% and matched the previous month’s increase. Not all the news was positive, a separate report showed that sales of new houses unexpectedly fell in May, which put a flurry of downward pressure on most housing-related stocks.
PICTURED: The Dow Jones Industrial Average negatively reversed and closed below its 50-day moving average (DMA) line.
|
|
|
 |
Tech Strength Helps Nasdaq Lead Major Indices
Kenneth J. Gruneisen - Passed the CAN SLIM® Master's Exam
The Bank ($BKX +1.14%) and Broker/Dealer ($XBD +1.69%) indexes posted modest gains, and a smaller gain from the Retail Index ($RLX +0.68%) was also a positive influence on the market averages. Oracle Corp's (ORCL +7.00%) better-than-expected fourth quarter results and upside first quarter earnings per share guidance helped inspire the tech sector's strength. This allowed the Nasdaq Composite to outpace its peers as the Internet ($IIX +1.63%), Networking ($NWX +1.69%), Semiconductor ($SOX +1.74%), and Biotechnology ($BTK +1.86%) indexes collectively boosted the tech-heavy index. The Gold & Silver Index ($XAU +2.93%) posted a second consecutive solid gain and rallied back above its 50-day moving average (DMA) line. The Oil Services ($OSX -0.03%) and Integrated Oil ($XOI +0.20%) indexes were little changed and the Healthcare ($HMO -1.08%) group was among the session's laggards ending in the red.
Charts courtesy www.stockcharts.com
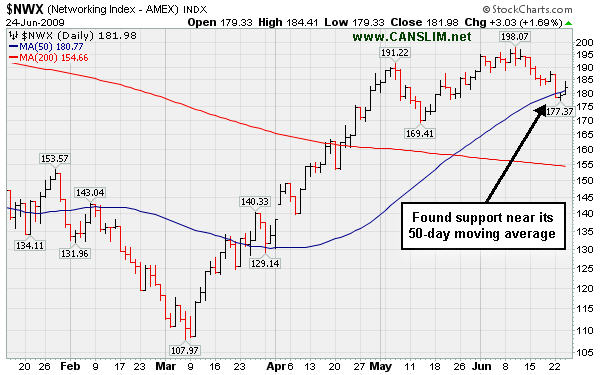
PICTURED: The Networking Index ($NWX +1.69%) found support near its 50-day moving average line.
| Oil Services |
$OSX |
156.51 |
-0.04 |
-0.03% |
+28.93% |
| Healthcare |
$HMO |
1,068.76 |
-11.64 |
-1.08% |
+11.31% |
| Integrated Oil |
$XOI |
902.10 |
+1.79 |
+0.20% |
-7.92% |
| Semiconductor |
$SOX |
258.08 |
+4.42 |
+1.74% |
+21.64% |
| Networking |
$NWX |
181.98 |
+3.03 |
+1.69% |
+26.47% |
| Internet |
$IIX |
182.97 |
+2.94 |
+1.63% |
+36.78% |
| Broker/Dealer |
$XBD |
95.60 |
+1.59 |
+1.69% |
+23.40% |
| Retail |
$RLX |
311.34 |
+2.11 |
+0.68% |
+11.49% |
| Gold & Silver |
$XAU |
140.37 |
+3.99 |
+2.93% |
+13.34% |
| Bank |
$BKX |
35.58 |
+0.40 |
+1.14% |
-19.72% |
| Biotech |
$BTK |
677.15 |
+12.37 |
+1.86% |
+4.63% |
|
|
|
 |
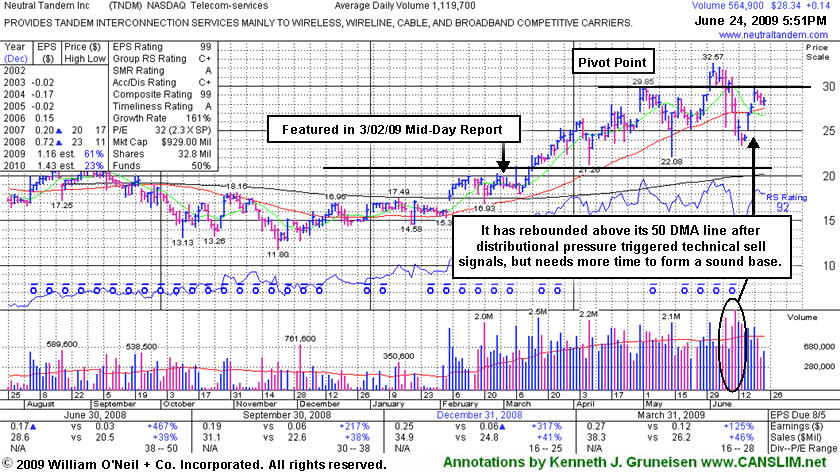
No Ideal Entry Point in Current Choppy Chart
Kenneth J. Gruneisen - Passed the CAN SLIM® Master's Exam
Neutral Tandem Inc (TNDM +$0.14 or +0.50% to $28.34) is quietly consolidating after rebounding above its 50-day moving average (DMA) line. Disciplined investors know that a sound base needs to form before new buying efforts might be justified under the investment system's guidelines. It recently triggered technical sell signals as heavy distribution completely negated its latest technical breakout and led to a 50 DMA violation. Its latest pivot point of $29.85 was based upon the stock's May 1st high. TNDM traded up as much as +72.42% since first featured at $18.89 in the 3/02/09 Mid-Day BreakOuts Report (read here).
Concerns had been raised under the headline "Second Distribution Day This Week For Telecom Services Leader" in TNDM's last appearance in this Featured Stock Update section on June 10, 2009 (read here). In that detailed summary the following was noted - "For investors who miss a proper buy point whenever any high-ranked stock breaks out from a first stage base, a stock's first pullback to its 50 DMA line (or its 10-week average when viewing a weekly chart) may offer an ideal secondary buy point. Odds of success taper off upon each subsequent test of support at that important short-term average line." Although the stock has already repaired its latest 50 DMA violation, its choppy chart now offers no ideal entry point within the investment system's guidelines. This high-ranked leader should remain on an active watch list until a sound new base has formed.
|
|
|
Color Codes Explained :
Y - Better candidates highlighted by our
staff of experts.
G - Previously featured
in past reports as yellow but may no longer be buyable under the
guidelines.
***Last / Change / Volume quote data in this table corresponds with the timestamp on the note***
Symbol/Exchange
Company Name
Industry Group |
Last |
Chg. |
Vol
% DAV |
Date Featured |
Price Featured |
Latest Pivot Point
Featured |
Status |
| Latest Max Buy Price |
GMCR
- NASDAQ
Green Mtn Coffee Roastrs
FOOD & BEVERAGE - Processed & Packaged Goods
|
$55.36
|
N/A
|
N/A
N/A
|
1/1/2008
(Date
Featured) |
$27.13
(Price
Featured) |
PP = $28.66 |
G |
| MB = $30.09 |
Most Recent Note - 6/24/2009 4:00:01 PM
G - Consolidating toward its 50 DMA line -important support to watch. On 6/09/09 it reached a new all-time high with a gain on light volume as a 3:2 stock split took effect. GMCR traded up more than +144% since appearing with an annotated graph under the headline "It May Soon Be Time To Go Green" when featured in the January 2009 CANSLIM.net News (read here).
>>> The latest Featured Stock Update with an annotated graph appeared on 6/22/2009. click here.
|
|
C
A
S
I |
News |
Chart |
SEC
View all notes Alert
me of new notes
Company
Profile
|
HMSY
- NASDAQ
H M S Holdings Corp
COMPUTER SOFTWARE & SERVICES - Healthcare Information Service
|
$39.13
|
N/A
|
N/A
N/A
|
2/20/2009
(Date
Featured) |
$34.08
(Price
Featured) |
PP = $38.38 |
Y |
| MB = $40.30 |
Most Recent Note - 6/24/2009 12:32:40 PM
Y - Consolidating quietly after recently rallying to new all-time highs with gains on higher volume. Gap up gain on 6/16/09 with heavy volume triggered a technical buy signal. No overhead supply is left to hinder the progress for this Commercial Services - Healthcare firm.
>>> The latest Featured Stock Update with an annotated graph appeared on 6/16/2009. click here.
|
|
C
A
S
I |
News |
Chart |
SEC
View all notes Alert
me of new notes
Company
Profile
|
LFT
-
|
$24.75
|
N/A
|
N/A
N/A
|
4/2/2009
(Date
Featured) |
$22.19
(Price
Featured) |
PP = $21.81 |
G |
| MB = $22.90 |
Most Recent Note - 6/24/2009 4:05:25 PM
G - Violated its 50 DMA line on the prior session, raising concerns. Its outlook remains questionable the longer it lingers below that important short-term average. Previously noted on 6/05/09 as it rose from a choppy (improper) base pattern. Its progress could be hindered by future share offerings. This Chinese Computer Software firm recently filed a registration of approximately 16 million shares for resale, and it also revealed a planned acquisition of another Chinese service provider.
>>> The latest Featured Stock Update with an annotated graph appeared on 6/18/2009. click here.
|
|
C
A
S
I |
News |
Chart |
SEC
View all notes Alert
me of new notes
Company
Profile
|
NTES
- NASDAQ
Netease Inc Adr
INTERNET - Internet Information Providers
|
$36.58
|
N/A
|
N/A
N/A
|
5/21/2009
(Date
Featured) |
$31.19
(Price
Featured) |
PP = $32.75 |
G |
| MB = $34.39 |
Most Recent Note - 6/24/2009 4:07:01 PM
G - Rallied today on average volume, consolidating above prior chart highs and its 50 DMA line (both near $32) - important support to watch. Its 5/28/09 gap up and considerable gain with +79% above average volume confirmed a technical buy signal as it rose above its pivot point. Indications of institutional (the I criteria) buying demand have been noted after earnings news on 5/20/09 a shakeout tested support near its 50 DMA line. First featured at $26.75 in the 3/31/09 CANSLIM.net Mid-Day Breakouts Report (read here). This high-ranked Chinese Internet - Content firm was also summarized in greater detail including an annotated graph in the April 2009 issue of CANSLIM.net News (read here).
>>> The latest Featured Stock Update with an annotated graph appeared on 6/19/2009. click here.
|
|
C
A
S
I |
News |
Chart |
SEC
View all notes Alert
me of new notes
Company
Profile
|
NVEC
- NASDAQ
N V E Corp
ELECTRONICS - Semiconductor - Specialized
|
$45.39
|
N/A
|
N/A
N/A
|
3/13/2009
(Date
Featured) |
$33.85
(Price
Featured) |
PP = $45.50 |
Y |
| MB = $47.78 |
Most Recent Note - 6/24/2009 4:13:38 PM
Y - Consolidating near its pivot point. Weak action promptly negated a large part of its 6/19/09 gain with volume more than 2 times average which helped it rise from an "ascending base" type pattern to a new 52-week high and multi-year high, triggering a technical buy signal. Color code was changed to yellow with new pivot point and max buy prices noted in the 6/19 mid-day report (read here). Found support above its 50 DMA line in May which was an encouraging sign. Sales increases in recent comparisons have been under the +25% guideline and still rather minuscule, leaving concerns, especially in the event of any hiccups. This is a reason to be especially disciplined about proper entries and exits.
>>> The latest Featured Stock Update with an annotated graph appeared on 6/23/2009. click here.
|
|
C
A
S
I |
News |
Chart |
SEC
View all notes Alert
me of new notes
Company
Profile
|
SNDA
-
|
$57.00
|
N/A
|
N/A
N/A
|
5/31/2009
(Date
Featured) |
$57.62
(Price
Featured) |
PP = $53.95 |
Y |
| MB = $56.65 |
Most Recent Note - 6/24/2009 4:18:51 PM
Y - Considerable gain today on slightly higher volume helped promptly repair this week's violation of its 50 DMA line and prior chart highs -weakness which had raised concerns and triggered a technical sell signal. Its color code is changed to yellow based on its resilience after the recently noted distributional pressure. Detailed analysis was included when recently featured in the June 2009 issue of CANSLIM.net News. Be sure to review the "What to Look Out For" section and entire detailed summary - read here).
>>> The latest Featured Stock Update with an annotated graph appeared on 6/17/2009. click here.
|
|
C
A
S
I |
News |
Chart |
SEC
View all notes Alert
me of new notes
Company
Profile
|
SYNA
- NASDAQ
Synaptics Inc
COMPUTER SOFTWARE & SERVICES - Information Technology Service
|
$37.29
|
N/A
|
N/A
N/A
|
5/18/2009
(Date
Featured) |
$32.58
(Price
Featured) |
PP = $34.52 |
G |
| MB = $36.25 |
Most Recent Note - 6/24/2009 4:19:57 PM
G - Consolidating above its August 2008 chart highs ($36), its 50 DMA line, and recent chart highs that define an important support level. First featured in yellow in the May 18, 2009 mid-day report (read here). The number of top-rated funds owning its shares rose from 123 in June '08 to 196 in March '09, which is good news concerning the I criteria. Its annual earnings (the A criteria) history showed a dowturn in 2006, leaving concerns, but it followed that up with strong growth the next 2 years. Its small supply of shares (the S criteria) outstanding could contribute to especially great volatility in the event of institutional accumulation or distribution.
>>> The latest Featured Stock Update with an annotated graph appeared on 6/15/2009. click here.
|
|
C
A
S
I |
News |
Chart |
SEC
View all notes Alert
me of new notes
Company
Profile
|
TNDM
- NASDAQ
Tandem Diabetes Care Inc
TELECOMMUNICATIONS - Wireless Communications
|
$28.20
|
N/A
|
N/A
N/A
|
3/2/2009
(Date
Featured) |
$18.89
(Price
Featured) |
PP = $29.85 |
G |
| MB = $31.34 |
Most Recent Note - 6/23/2009 4:15:22 PM
G - Quietly consolidating after its recent rebound above its 50 DMA line. A sound base needs to form before new buying efforts might be justified under the investment system's guidelines. It traded up as much as +72.42% since first featured at $18.89 in the 3/02/09 Mid-Day BreakOuts Report (read here).
>>> The latest Featured Stock Update with an annotated graph appeared on 6/24/2009. click here.
|
|
C
A
S
I |
News |
Chart |
SEC
View all notes Alert
me of new notes
Company
Profile
|
|
 |
| Subscriber Questions: |
June 23, 2009 |
Ken,
In tonight's "Featured Stock Update" you mentioned that 'No resistance remains due to overhead supply' on NVE Corp. I've seen this comment many times in your writings, but don't really understand what it means. Is this worthy of an 'educational moment' for all members?
Thanks,
Rick |
| Ken's Response: |
June 24, 2009 |
Rick,
Great question, and perfect material for tonight's "Mailbag" section. The concept of overhead supply is described in How To Make Money In Stocks as "critically important" to learn. The book warns investors about the "fatal mistake of buying a stock that has a large amount of overhead supply." Overhead supply is when there are significant areas of price resistance in a stock as it moves up after experiencing a downtrend. Investors who own the stock at higher levels limit and frustrate its upward movement because they are motivated to sell (which is human nature) when they can finally get out and break even. Supply areas more than a year and three quarters or two years old create less resistance.
A stock that has just broken out into new all-time high ground has no overhead supply to contend with, which adds greatly to its appeal. In the months ahead, market conditions may allow us to see many stocks reaching new 52-week highs. Some may emerge from ideal base patterns and be ideal buy candidates even though they may not be at all-time highs. Our experts will look beyond the past 52-weeks in their analysis, and alert members in cases where overhead supply may be a concern with notes to that effect.

Kenneth J. Gruneisen
Founder & Contributing Writer for CANSLIM.net StockNews
www.canslim.net |
|
|
|
THESE ARE NOT BUY RECOMMENDATIONS!
Comments contained in the body of this report are technical
opinions only. The material herein has been obtained
from sources believed to be reliable and accurate, however,
its accuracy and completeness cannot be guaranteed.
This site is not an investment advisor, hence it does
not endorse or recommend any securities or other investments.
Any recommendation contained in this report may not
be suitable for all investors and it is not to be deemed
an offer or solicitation on our part with respect to
the purchase or sale of any securities. All trademarks,
service marks and trade names appearing in this report
are the property of their respective owners, and are
likewise used for identification purposes only.
This report is a service available
only to active Paid Premium Members.
You may opt-out of receiving report notifications
at any time. Questions or comments may be submitted
by writing to Premium Membership Services 665 S.E. 10 Street, Suite 201 Deerfield Beach, FL 33441-5634 or by calling 1-800-965-8307
or 954-785-1121.
|
|
|


