You are not logged in.
This means you
CAN ONLY VIEW reports that were published prior to Monday, April 14, 2025.
You
MUST UPGRADE YOUR MEMBERSHIP if you want to see any current reports.
AFTER MARKET UPDATE - TUESDAY, JUNE 23RD, 2009
Previous After Market Report Next After Market Report >>>
|
|
|
|
DOW |
-16.10 |
8,322.91 |
-0.19% |
|
Volume |
1,209,722,300 |
-13% |
|
Volume |
2,218,928,480 |
+23% |
|
NASDAQ |
-1.27 |
1,764.92 |
-0.07% |
|
Advancers |
1,417 |
46% |
|
Advancers |
1,102 |
39% |
|
S&P 500 |
+2.06 |
895.10 |
+0.23% |
|
Decliners |
1,576 |
51% |
|
Decliners |
1,609 |
56% |
|
Russell 2000 |
-3.04 |
489.77 |
-0.62% |
|
52 Wk Highs |
2 |
|
|
52 Wk Highs |
11 |
|
|
S&P 600 |
-2.24 |
256.98 |
-0.86% |
|
52 Wk Lows |
5 |
|
|
52 Wk Lows |
19 |
|
|
 |
Major Indices End Quiet Session With Mixed Results Again
Adam Sarhan, Contributing Writer,
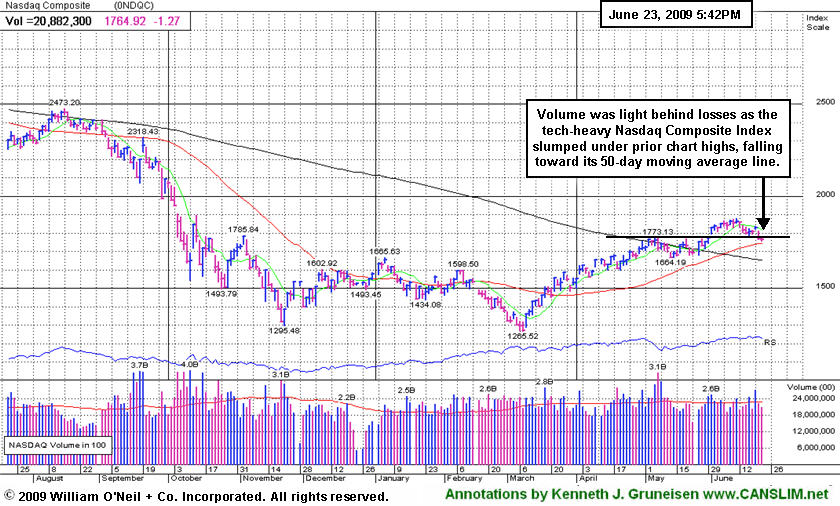
The major averages traded between positive and negative territory all day as investors digested the latest headlines and the latest speech from President Obama. The final results for the major averages were mixed, and so were the volume totals on the exchanges. Decliners outnumbered advancers by about a 3-to-2 ratio on the Nasdaq exchange with a higher volume total reported, yet the tally was closer to even on the NYSE with a lighter volume total reported. There were only 3 high-ranked companies from the CANSLIM.net Leaders List that made a new 52-week high and appeared on the CANSLIM.net BreakOuts Page, lower than the 5 issues that appeared on the prior session. A further expansion in the new highs list would offer encouraging news for growth oriented investors.
The market averages ended mixed after President Obama defended the powers of the Federal Reserve in a speech on Tuesday. Obama explained his plan to allow the central bank to be in charge of monitoring broad risks facing the financial system. A mid-day press conference highlighted several important roles of the Fed and also defended the performance of Fed Chairman Ben Bernanke during and after the financial crisis, saying Bernanke has done a "fine job" and "performed well." The President also addressed those that disagree with expanding the Fed's power to monitor systemic risk.
In other news, the Federal Reserve began a two-day meeting on Tuesday. The Fed is expected to hold interest rates steady when it concludes its meeting Wednesday afternoon. The Street expects the central bank to hold rates steady on its plans for asset purchases. The S&P 500 Index's price/earnings (P/E) ratio fell to 10.1 in early March which was the lowest level since 1985! The S&P 500 Index plunged nearly -58% from its October 2007 high of 1,576 to its March 2009 low of 666.
PICTURED: The Nasdaq Composite Index closed back under its prior chart highs with a second loss on lighter volume, yet it remains trading above its 50-day moving average line.
|
|
|
 |
Retail Index Closes At Lowest Since Early April
Kenneth J. Gruneisen - Passed the CAN SLIM® Master's Exam
The Gold & Silver Index ($XAU +4.06%) repaired a large part of the prior session's loss and was a standout gainer. The Integrated Oil ($XOI +1.38%) and Oil Services ($OSX +1.40%) indexes posted modest gains as energy-related shares were on the rise. The Bank ($BKX +0.98%) and Broker/Dealer ($XBD +1.06%) indexes also posted gains. However, weak action in the retail group, losses in the Healthcare ($HMO -0.68%) group, and lackluster action in the tech sector limited the major indices' ability to make progress as the Semiconductor ($SOX -0.37%), Biotechnology ($BTK +0.08%), Internet ($IIX +0.15%), and Networking ($NWX +0.30%) indexes showed no decisiveness in direction.
Charts courtesy www.stockcharts.com
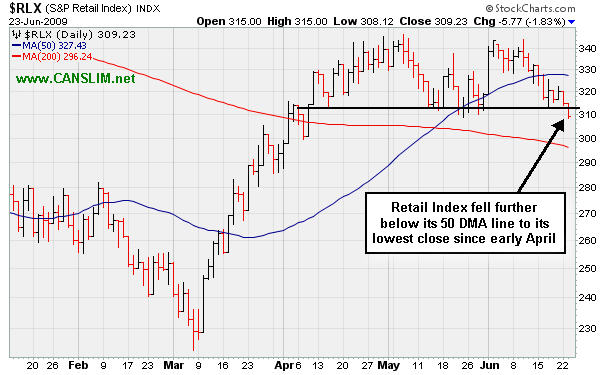
PICTURED: The Retail Index ($RLX -1.83%) fell further below its 50-day moving (DMA) line to its lowest close since early April.
| Oil Services |
$OSX |
156.55 |
+2.16 |
+1.40% |
+28.96% |
| Healthcare |
$HMO |
1,080.40 |
-7.36 |
-0.68% |
+12.52% |
| Integrated Oil |
$XOI |
900.31 |
+12.22 |
+1.38% |
-8.10% |
| Semiconductor |
$SOX |
253.66 |
-0.94 |
-0.37% |
+19.56% |
| Networking |
$NWX |
178.95 |
+0.54 |
+0.30% |
+24.37% |
| Internet |
$IIX |
180.03 |
+0.27 |
+0.15% |
+34.58% |
| Broker/Dealer |
$XBD |
94.01 |
+0.99 |
+1.06% |
+21.35% |
| Retail |
$RLX |
309.23 |
-5.77 |
-1.83% |
+10.73% |
| Gold & Silver |
$XAU |
136.38 |
+5.32 |
+4.06% |
+10.12% |
| Bank |
$BKX |
35.18 |
+0.34 |
+0.98% |
-20.62% |
| Biotech |
$BTK |
664.71 |
+0.54 |
+0.08% |
+2.71% |
|
|
|
 |
High-Ranked Leader Consolidating Near Latest Pivot Point
Kenneth J. Gruneisen - Passed the CAN SLIM® Master's Exam
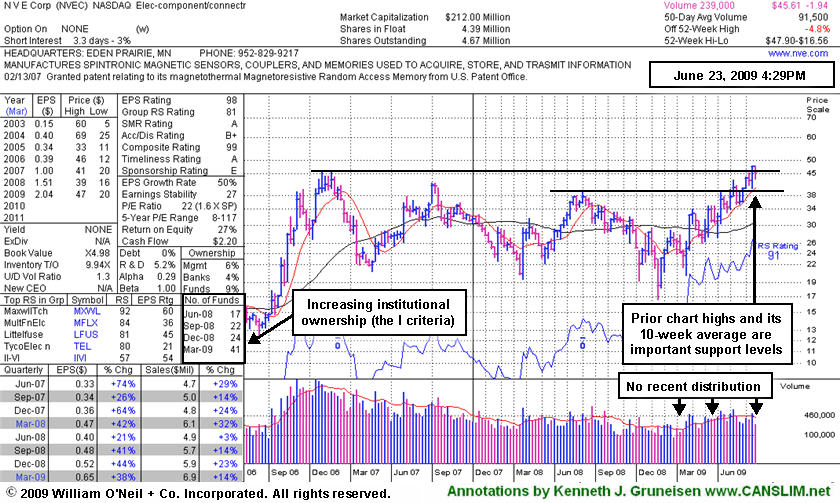
NVE Corp (NVEC +$1.28 or +2.86% to $45.61) made a positive reversal today to end the session near its pivot point. Weak action promptly negated a large part of its 6/19/09 gain with volume more than 2 times average which helped it rise from an "ascending base" type pattern to a new 52-week high and multi-year high, triggering its latest technical buy signal. Its color code was changed to yellow with new pivot point and max buy prices noted in the 6/19 mid-day report (read here). The weekly chart below illustrates how it found support above its 10-week average line (the red line) in recent months, which is an encouraging sign. Its 10-week average line is an important support level to watch now, which coincides with prior chart highs in the $39 area. It has a very small supply of only 4.67 million shares outstanding. A small supply is generally considered a good sign with respect to the S criteria, yet could contribute to great volatility in the event of institutional accumulation or distribution. NVEC has traded up as much as +41.51% since it was first featured in yellow at $33.85 in the Friday, March 13, 2009 Mid-Day Breakouts Report (read here).
Earnings per share rose +38% in the period ended March 31, 2009 versus the year ago quarter, yet sales were up just +14% and, as previously noted, the company's sales revenues thus far have been rather minuscule. At less than $7 million per quarter in each of the past 8 quarters, sales have growing at a mostly lackluster pace percentage-wise. Companies reporting more substantial sales revenues generally make more reliable buy candidates, while companies with little "meat on the bone" can be particularly vulnerable to bad stumbles, fundamentally and technically. Nonetheless, this high-ranked Electronics - Components leader has a good quarterly and annual earnings growth history (C & A criteria). No resistance remains due to overhead supply.
|
|
|
Color Codes Explained :
Y - Better candidates highlighted by our
staff of experts.
G - Previously featured
in past reports as yellow but may no longer be buyable under the
guidelines.
***Last / Change / Volume quote data in this table corresponds with the timestamp on the note***
Symbol/Exchange
Company Name
Industry Group |
Last |
Chg. |
Vol
% DAV |
Date Featured |
Price Featured |
Latest Pivot Point
Featured |
Status |
| Latest Max Buy Price |
GMCR
- NASDAQ
Green Mtn Coffee Roastrs
FOOD & BEVERAGE - Processed & Packaged Goods
|
$52.29
|
N/A
|
N/A
N/A
|
1/1/2008
(Date
Featured) |
$27.13
(Price
Featured) |
PP = $28.66 |
G |
| MB = $30.09 |
Most Recent Note - 6/23/2009 3:55:43 PM
G - Down today on lighter volume, falling toward its 50 DMA line -important support to watch. It has slumped -17% from its 6/09/09 all-time high which it reached with a gain on light volume as a 3:2 stock split took effect. GMCR traded up more than +144% since appearing with an annotated graph under the headline "It May Soon Be Time To Go Green" when featured in the January 2009 CANSLIM.net News (read here).
>>> The latest Featured Stock Update with an annotated graph appeared on 6/22/2009. click here.
|
|
C
A
S
I |
News |
Chart |
SEC
View all notes Alert
me of new notes
Company
Profile
|
HMSY
- NASDAQ
H M S Holdings Corp
COMPUTER SOFTWARE & SERVICES - Healthcare Information Service
|
$38.82
|
N/A
|
N/A
N/A
|
2/20/2009
(Date
Featured) |
$34.08
(Price
Featured) |
PP = $38.38 |
Y |
| MB = $40.30 |
Most Recent Note - 6/23/2009 3:57:46 PM
Y - Pulling back from all-time highs with a second consecutive loss on average volume today following prior gains on higher volume. Gap up gain on 6/16/09 with heavy volume triggered a technical buy signal. No overhead supply is left to hinder the progress for this Commercial Services - Healthcare firm.
>>> The latest Featured Stock Update with an annotated graph appeared on 6/16/2009. click here.
|
|
C
A
S
I |
News |
Chart |
SEC
View all notes Alert
me of new notes
Company
Profile
|
LFT
-
|
$23.90
|
N/A
|
N/A
N/A
|
4/2/2009
(Date
Featured) |
$22.19
(Price
Featured) |
PP = $21.81 |
G |
| MB = $22.90 |
Most Recent Note - 6/23/2009 11:56:23 AM
G - Gapped down today and violated its 50 DMA line, raising concerns. Previously noted on 6/05/09 as it rose from a choppy (improper) base pattern. Its progress could be hindered by future share offerings. Prompt repair of its recent 50 DMA line violation, and its gap up, were noted as signs of solid institutional (the I criteria) support and buying demand. This Chinese Computer Software firm recently filed a registration of approximately 16 million shares for resale, and it also revealed a planned acquisition of another Chinese service provider.
>>> The latest Featured Stock Update with an annotated graph appeared on 6/18/2009. click here.
|
|
C
A
S
I |
News |
Chart |
SEC
View all notes Alert
me of new notes
Company
Profile
|
NTES
- NASDAQ
Netease Inc Adr
INTERNET - Internet Information Providers
|
$33.80
|
N/A
|
N/A
N/A
|
5/21/2009
(Date
Featured) |
$31.19
(Price
Featured) |
PP = $32.75 |
G |
| MB = $34.39 |
Most Recent Note - 6/22/2009 9:39:03 PM
G - Consolidating above prior chart highs and its 50 DMA line (both near $32) - important support to watch. Its 5/28/09 gap up and considerable gain with +79% above average volume confirmed a technical buy signal as it rose above its pivot point. Indications of institutional (the I criteria) buying demand have been noted after earnings news on 5/20/09 a shakeout tested support near its 50 DMA line. First featured at $26.75 in the 3/31/09 CANSLIM.net Mid-Day Breakouts Report (read here). This high-ranked Chinese Internet - Content firm was also summarized in greater detail including an annotated graph in the April 2009 issue of CANSLIM.net News (read here).
>>> The latest Featured Stock Update with an annotated graph appeared on 6/19/2009. click here.
|
|
C
A
S
I |
News |
Chart |
SEC
View all notes Alert
me of new notes
Company
Profile
|
NVEC
- NASDAQ
N V E Corp
ELECTRONICS - Semiconductor - Specialized
|
$45.67
|
N/A
|
N/A
N/A
|
3/13/2009
(Date
Featured) |
$33.85
(Price
Featured) |
PP = $45.50 |
Y |
| MB = $47.78 |
Most Recent Note - 6/23/2009 4:05:17 PM
Y - Positive reversal today helped it end the session near its pivot point. Weak action promptly negated a large part of its 6/19/09 gain with volume more than 2 times average which helped it rise from an "ascending base" type pattern to a new 52-week high and multi-year high, triggering a technical buy signal. Color code was changed to yellow with new pivot point and max buy prices noted in the 6/19 mid-day report (read here). Found support above its 50 DMA line in May which was an encouraging sign. Sales increases in recent comparisons have been under the +25% guideline and still rather minuscule, leaving concerns, especially in the event of any hiccups. This is a reason to be especially disciplined about proper entries and exits.
>>> The latest Featured Stock Update with an annotated graph appeared on 6/23/2009. click here.
|
|
C
A
S
I |
News |
Chart |
SEC
View all notes Alert
me of new notes
Company
Profile
|
SNDA
-
|
$51.10
|
N/A
|
N/A
N/A
|
5/31/2009
(Date
Featured) |
$57.62
(Price
Featured) |
PP = $53.95 |
G |
| MB = $56.65 |
Most Recent Note - 6/23/2009 4:10:32 PM
G - Down again today on lighter volume. Weakness on 6/22/09 under its previously cited pivot point and a violation of its 50 DMA line raised concerns and triggered a technical sell signal. Last week a worrisome 5-session losing streak and distributional pressure raised concerns. Its color code was changed to green. Detailed analysis was included when recently featured in the June 2009 issue of CANSLIM.net News. Be sure to review the "What to Look Out For" section and entire detailed summary - read here).
>>> The latest Featured Stock Update with an annotated graph appeared on 6/17/2009. click here.
|
|
C
A
S
I |
News |
Chart |
SEC
View all notes Alert
me of new notes
Company
Profile
|
SYNA
- NASDAQ
Synaptics Inc
COMPUTER SOFTWARE & SERVICES - Information Technology Service
|
$36.36
|
N/A
|
N/A
N/A
|
5/18/2009
(Date
Featured) |
$32.58
(Price
Featured) |
PP = $34.52 |
G |
| MB = $36.25 |
Most Recent Note - 6/23/2009 4:13:13 PM
G - Down for a second session on below average volume, consolidating above its August 2008 chart highs ($36), its 50 DMA line, and recent chart highs that define an important support level. First featured in yellow in the May 18, 2009 mid-day report (read here). The number of top-rated funds owning its shares rose from 123 in June '08 to 196 in March '09, which is good news concerning the I criteria. Its annual earnings (the A criteria) history showed a dowturn in 2006, leaving concerns, but it followed that up with strong growth the next 2 years. Its small supply of shares (the S criteria) outstanding could contribute to especially great volatility in the event of institutional accumulation or distribution.
>>> The latest Featured Stock Update with an annotated graph appeared on 6/15/2009. click here.
|
|
C
A
S
I |
News |
Chart |
SEC
View all notes Alert
me of new notes
Company
Profile
|
TNDM
- NASDAQ
Tandem Diabetes Care Inc
TELECOMMUNICATIONS - Wireless Communications
|
$28.20
|
N/A
|
N/A
N/A
|
3/2/2009
(Date
Featured) |
$18.89
(Price
Featured) |
PP = $29.85 |
G |
| MB = $31.34 |
Most Recent Note - 6/23/2009 4:15:22 PM
G - Quietly consolidating after its recent rebound above its 50 DMA line. A sound base needs to form before new buying efforts might be justified under the investment system's guidelines. It traded up as much as +72.42% since first featured at $18.89 in the 3/02/09 Mid-Day BreakOuts Report (read here).
>>> The latest Featured Stock Update with an annotated graph appeared on 6/10/2009. click here.
|
|
C
A
S
I |
News |
Chart |
SEC
View all notes Alert
me of new notes
Company
Profile
|
|
|
|
THESE ARE NOT BUY RECOMMENDATIONS!
Comments contained in the body of this report are technical
opinions only. The material herein has been obtained
from sources believed to be reliable and accurate, however,
its accuracy and completeness cannot be guaranteed.
This site is not an investment advisor, hence it does
not endorse or recommend any securities or other investments.
Any recommendation contained in this report may not
be suitable for all investors and it is not to be deemed
an offer or solicitation on our part with respect to
the purchase or sale of any securities. All trademarks,
service marks and trade names appearing in this report
are the property of their respective owners, and are
likewise used for identification purposes only.
This report is a service available
only to active Paid Premium Members.
You may opt-out of receiving report notifications
at any time. Questions or comments may be submitted
by writing to Premium Membership Services 665 S.E. 10 Street, Suite 201 Deerfield Beach, FL 33441-5634 or by calling 1-800-965-8307
or 954-785-1121.
|
|
|


