You are not logged in.
This means you
CAN ONLY VIEW reports that were published prior to Monday, April 14, 2025.
You
MUST UPGRADE YOUR MEMBERSHIP if you want to see any current reports.
AFTER MARKET UPDATE - FRIDAY, JUNE 22ND, 2012
Previous After Market Report Next After Market Report >>>
|
|
|
|
DOW |
+67.21 |
12,640.78 |
+0.53% |
|
Volume |
1,578,043,640 |
+82% |
|
Volume |
2,214,425,770 |
+28% |
|
NASDAQ |
+33.33 |
2,892.42 |
+1.17% |
|
Advancers |
2,103 |
66% |
|
Advancers |
1,773 |
68% |
|
S&P 500 |
+9.51 |
1,335.02 |
+0.72% |
|
Decliners |
945 |
30% |
|
Decliners |
741 |
28% |
|
Russell 2000 |
+10.33 |
775.16 |
+1.35% |
|
52 Wk Highs |
48 |
|
|
52 Wk Highs |
59 |
|
|
S&P 600 |
+5.47 |
431.30 |
+1.28% |
|
52 Wk Lows |
36 |
|
|
52 Wk Lows |
45 |
|
|
 |
Major Averages Rallied Back With Much Higher Volume
Kenneth J. Gruneisen - Passed the CAN SLIM® Master's Exam
For the week the Dow Jones Industrial Average fell -1.0%, the S&P 500 Index lost -0.6%, and the Nasdaq Composite Index ended the week in positive territory with a +0.7% gain. On Friday's session the indices posted respectable gains and the volume totals were reported much higher than the prior session totals on the Nasdaq exchange and on the NYSE. Breadth was positive as advancers led decliners by more than a 2-1 ratio on the NYSE and on the Nasdaq exchange. The total number of new 52-week highs again exceeded new 52-week lows on both the NYSE and on the Nasdaq exchange. There were 18 high-ranked companies from the CANSLIM.net Leaders List made new 52-week highs and appeared on the CANSLIM.net BreakOuts Page, down from the prior session total of 22 stocks. At the session's close there were gains for 15 of the 17 high-ranked companies currently included on the Featured Stocks Page.
Stocks were higher from the opening bell as investors looked to capitalize on Thursday's steep declines. The financial sector helped lead the rebound after Moody's telegraphed rating downgrades on many of the 15 global banks were less severe than expected. Stocks also received a lift from the European Central Banks plan to ease collateral rules for banks to receive funds. JP Morgan Chase & Co (JPM +1.35%) and Morgan Stanley (MS +1.29%) advanced.
Merck & Co Inc (MRK +1.85%) rallied to pace an advance in health care stocks. Darden Restaurant (DRI -0.69%) declined after the owner of Red Lobster reported fourth-quarter revenues below analyst projections. In other news, Ryder System Inc (R -13.03%) fell after the fleet-management company lowered its quarterly and full year earnings guidance.
Treasuries finished the session lower with the 10-year note down 1/2 a point to yield 1.67%.
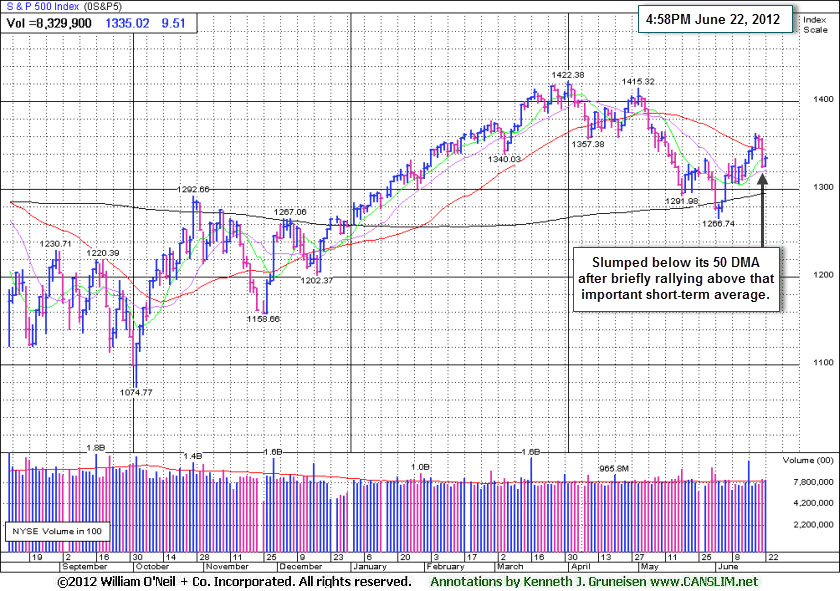
The nascent rally and confirmed uptrend came under pressure Thursday as all 3 major averages surrendered gains which had lifted them each above their respective 50-day moving average (DMA) lines earlier in the week. Technically, the major averages' (M criteria) current rally still allows fact-based investors to make new buying efforts, but only in sound buy candidates near proper entry points. As always, disciplined investors limit losses if any stock ever falls more than -7% from its purchase price.
The Q2 2012 Webcast is scheduled for Wednesday, June 27th at 8PM EST and will be available "ON DEMAND" afterward. All who have the UPGRADED membership now get access to these informative *Quarterly Webcasts included at no additional cost. (*Previously sold separately at $99 per webcast.) Links to archived webcasts and all prior reports are on the Premium Member Homepage. Please use the inquiry form to submit any questions that you would like to see answered in the upcoming webcast or to make any suggestions or comments about our website and services. Thank you!
PICTURED: The S&P 500 Index slumped back below its downward sloping 50-day moving average (DMA) line after briefly getting above that important short-term average. Additional distributional action could quickly quash the recently confirmed rally.
|
 Kenneth J. Gruneisen started out as a licensed stockbroker in August 1987, a couple of months prior to the historic stock market crash that took the Dow Jones Industrial Average down -22.6% in a single day. He has published daily fact-based fundamental and technical analysis on high-ranked stocks online for two decades. Through FACTBASEDINVESTING.COM, Kenneth provides educational articles, news, market commentary, and other information regarding proven investment systems that work in good times and bad.
Comments contained in the body of this report are technical opinions only and are not necessarily those of Gruneisen Growth Corp. The material herein has been obtained from sources believed to be reliable and accurate, however, its accuracy and completeness cannot be guaranteed. Our firm, employees, and customers may effect transactions, including transactions contrary to any recommendation herein, or have positions in the securities mentioned herein or options with respect thereto. Any recommendation contained in this report may not be suitable for all investors and it is not to be deemed an offer or solicitation on our part with respect to the purchase or sale of any securities. |
|
 |
Financial, Tech and Healthcare Indexes Led Group Gainers
Kenneth J. Gruneisen - Passed the CAN SLIM® Master's Exam
Financial shares repaired some of the prior session's damage as the Bank Index ($BKX +1.66%) and Broker/Dealer Index ($XBD +1.23%) bounced back. The Retail Index ($RLX +0.69%) posted a modest gains and the Biotechnology Index ($BTK +2.24%), Internet Index ($IIX +1.22%), Semiconductor Index ($SOX +1.59%), and the Networking Index ($NWX +1.61%) produced unanimous gains in the tech sector. The Healthcare Index ($HMO +1.43%) also had a positive bias. The Integrated Oil Index ($XOI +0.79%) rose, meanwhile, the Gold & Silver Index ($XAU -0.48%) and Oil Services Index ($OSX -0.08%) ended with small losses.
Charts courtesy www.stockcharts.com
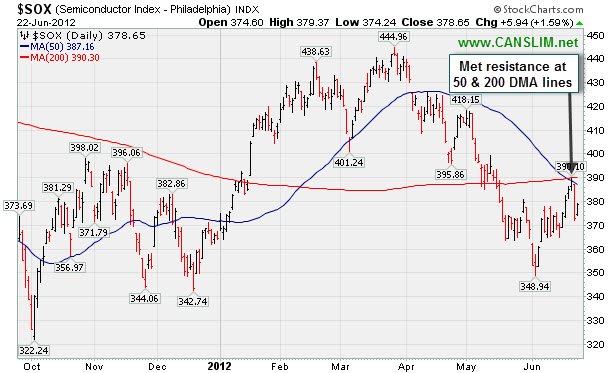
PICTURED: The Semiconductor Index ($SOX +1.59%) posted a gain. It recently met resistance at its 50-day and 200-day moving average (DMA) lines which recently converged.
| Oil Services |
$OSX |
192.72 |
-0.16 |
-0.08% |
-10.89% |
| Healthcare |
$HMO |
2,273.92 |
+32.05 |
+1.43% |
-0.34% |
| Integrated Oil |
$XOI |
1,115.63 |
+8.78 |
+0.79% |
-9.23% |
| Semiconductor |
$SOX |
378.65 |
+5.94 |
+1.59% |
+3.90% |
| Networking |
$NWX |
211.20 |
+3.35 |
+1.61% |
-1.84% |
| Internet |
$IIX |
298.17 |
+3.59 |
+1.22% |
+5.83% |
| Broker/Dealer |
$XBD |
85.75 |
+1.04 |
+1.23% |
+2.98% |
| Retail |
$RLX |
609.76 |
+4.19 |
+0.69% |
+16.54% |
| Gold & Silver |
$XAU |
156.29 |
-0.75 |
-0.48% |
-13.48% |
| Bank |
$BKX |
45.23 |
+0.74 |
+1.66% |
+14.86% |
| Biotech |
$BTK |
1,468.98 |
+32.16 |
+2.24% |
+34.59% |
|
|
|
 |
Rebound Near 52-Week High Makes an Ideal Set-Up
Kenneth J. Gruneisen - Passed the CAN SLIM® Master's Exam
Often, when a leading stock is setting up to breakout of a solid base it is highlighted in CANSLIM.net's Mid-Day Breakouts Report. The most relevant factors are noted in the report which alerts prudent CANSLIM oriented investors to place the issue in their watch list. After doing any necessary backup research, the investor is prepared to act after the stock triggers a technical buy signal (breaks above its pivot point on more than +50% average turnover) but before it gets too extended from a sound base. In the event the stock fails to trigger a technical buy signal and its price declines then it will simply be removed from the watch list. Disciplined investors know to buy as near as possible to the pivot point and avoid chasing stocks after they have rallied more than +5% above their pivot point. It is crucial to always limit losses whenever any stock heads the wrong direction, and disciplined investors sell if a struggling stock ever falls more than -7% from their purchase price.
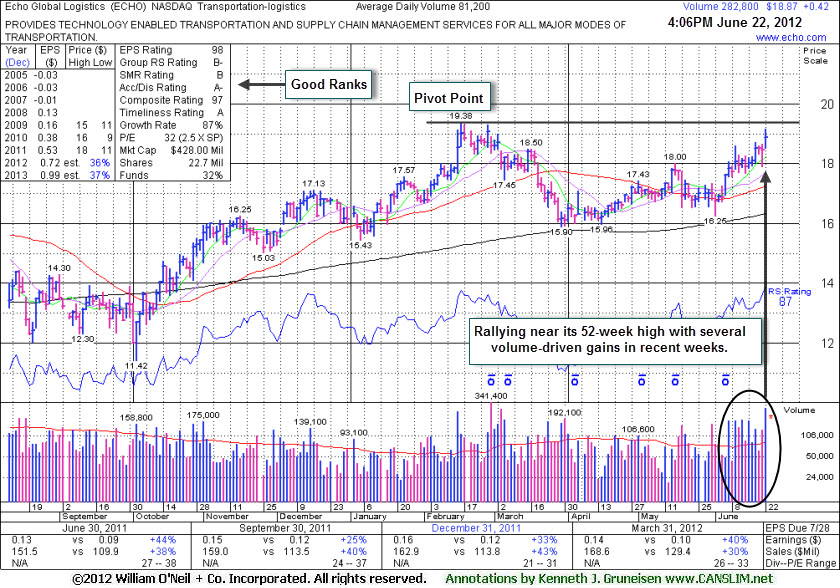
Echo Global Logistics (ECHO +$0.50 or +2.71% to $18.95) now faces little resistance due to overhead supply after rallying within close striking distance of its 52-week high today with another volume-driven gain. It was highlighted in the mid-day report in yellow today (read here) with a new pivot point cited based on its 2/16/12 high plus 10 cents. A volume-driven gain above its pivot point may trigger a technical buy signal. Its fundamentals remain strong with respect to the C and A criteria.
Following its last appearance in this FSU section on 2/23/12 with an annotated graph under the headline, "Favorable Characteristics in Another Transportation Issue", it failed to make any further progress. Then it triggered sell signals as damaging losses negated the prior breakout and violated its 50-day moving average (DMA) line. It found support above its 200 (DMA) line and rebounded back above its 50 DMA line in recent weeks since 3/28/12 when it was dropped from the Featured Stocks list.
Ownership by top-rated funds rose from 86 in Dec '10 to 141 in Mar '12, a reassuring sign concerning the I criteria. Recent leadership (L criteria) from at least one other high-ranked firm in the Transportation - Logistics group is reassuring, although the group has a weak (54) Relative Strength Rating.
|
|
|
Color Codes Explained :
Y - Better candidates highlighted by our
staff of experts.
G - Previously featured
in past reports as yellow but may no longer be buyable under the
guidelines.
***Last / Change / Volume data in this table is the closing quote data***
Symbol/Exchange
Company Name
Industry Group |
PRICE |
CHANGE
(%Change) |
Day High |
Volume
(% DAV)
(% 50 day avg vol) |
52 Wk Hi
% From Hi |
Featured
Date |
Price
Featured |
Pivot Featured |
|
Max Buy |
ALXN
-
NASDAQ
Alexion Pharmaceuticals
DRUGS - Drug Manufacturers - Other
|
$95.95
|
+0.96
1.01% |
$96.19
|
1,626,048
75.65% of 50 DAV
50 DAV is 2,149,500
|
$99.41
-3.48%
|
5/1/2012
|
$91.73
|
PP = $95.11
|
|
MB = $99.87
|
Most Recent Note - 6/19/2012 10:10:54 AM
Y - Gapped up today, clearing resistance in the $94-95 area and rising above its pivot point for a new 52-week high.
>>> The latest Featured Stock Update with an annotated graph appeared on 5/31/2012. Click here.
View all notes |
Alert me of new notes |
CANSLIM.net Company Profile |
SEC |
Zacks Reports |
StockTalk |
News |
Chart |
Request a new note
C
A N
S L
I M


|
ASPS
-
NASDAQ
Altisource Ptf Sltns Sa
REAL ESTATE - Property Management/Developmen
|
$70.85
|
+0.50
0.71% |
$71.50
|
68,442
48.68% of 50 DAV
50 DAV is 140,600
|
$72.61
-2.42%
|
6/5/2012
|
$60.01
|
PP = $63.00
|
|
MB = $66.15
|
Most Recent Note - 6/19/2012 11:47:50 AM
G - Hitting another new 52-week high today. Prior highs in the $65 area define initial support to watch on pullbacks, meanwhile it is getting extended from its prior base.
>>> The latest Featured Stock Update with an annotated graph appeared on 6/5/2012. Click here.
View all notes |
Alert me of new notes |
CANSLIM.net Company Profile |
SEC |
Zacks Reports |
StockTalk |
News |
Chart |
Request a new note
C
A N
S L
I M
|
CERN
-
NASDAQ
Cerner Corp
COMPUTER SOFTWARE and SERVICES - Healthcare Information Service
|
$80.80
|
+1.10
1.38% |
$81.26
|
2,012,112
140.16% of 50 DAV
50 DAV is 1,435,600
|
$88.32
-8.51%
|
6/7/2012
|
$78.36
|
PP = $84.20
|
|
MB = $88.41
|
 Most Recent Note - 6/22/2012 12:02:58 PM
Y - Halted its slide above its 50 DMA line today. It slumped below its pivot point raising concerns with above average volume behind 2 consecutive losses which negated its recent breakout. Disciplined investors always limit losses if ever a stock falls more than -7% from their purchase price.
>>> The latest Featured Stock Update with an annotated graph appeared on 6/7/2012. Click here.
View all notes |
Alert me of new notes |
CANSLIM.net Company Profile |
SEC |
Zacks Reports |
StockTalk |
News |
Chart |
Request a new note
C
A N
S L
I M
|
CMCSA
-
NASDAQ
Comcast Corp Cl A
MEDIA - CATV Systems
|
$30.83
|
+0.16
0.51% |
$30.95
|
18,179,552
130.13% of 50 DAV
50 DAV is 13,970,400
|
$31.65
-2.59%
|
6/11/2012
|
$29.94
|
PP = $30.98
|
|
MB = $32.53
|
Most Recent Note - 6/20/2012 1:06:46 PM
Y - Perched at its 52-week high today, holding its ground after 4 consecutive gains. Its gain on 6/15/12 with +55% above average volume while rising above the new pivot point recently cited triggered a technical buy signal. The prior low ($28.09 on 5/21/12) defines important near-term support to watch.
>>> The latest Featured Stock Update with an annotated graph appeared on 6/11/2012. Click here.
View all notes |
Alert me of new notes |
CANSLIM.net Company Profile |
SEC |
Zacks Reports |
StockTalk |
News |
Chart |
Request a new note
C
A N
S L
I M
|
DG
-
NYSE
Dollar General Corp
RETAIL - Discount, Variety Stores
|
$52.60
|
+0.22
0.42% |
$52.83
|
8,619,358
250.99% of 50 DAV
50 DAV is 3,434,200
|
$53.06
-0.87%
|
5/7/2012
|
$48.51
|
PP = $47.69
|
|
MB = $50.07
|
Most Recent Note - 6/22/2012 5:23:39 PM
G - Inched up today for a small gain with above average volume, perched near its all-time high. Completed another Secondary Offering on 6/05/12, its 4th Secondary Offering since September '11.
>>> The latest Featured Stock Update with an annotated graph appeared on 6/12/2012. Click here.
View all notes |
Alert me of new notes |
CANSLIM.net Company Profile |
SEC |
Zacks Reports |
StockTalk |
News |
Chart |
Request a new note
C
A N
S L
I M
|
Symbol/Exchange
Company Name
Industry Group |
PRICE |
CHANGE
(%Change) |
Day High |
Volume
(% DAV)
(% 50 day avg vol) |
52 Wk Hi
% From Hi |
Featured
Date |
Price
Featured |
Pivot Featured |
|
Max Buy |
ECHO
-
NASDAQ
Echo Global Logistics
DIVERSIFIED SERVICES - Business/Management Services
|
$18.95
|
+0.50
2.71% |
$19.16
|
882,427
1,086.73% of 50 DAV
50 DAV is 81,200
|
$19.38
-2.22%
|
6/22/2012
|
$18.98
|
PP = $19.48
|
|
MB = $20.45
|
Most Recent Note - 6/22/2012 12:14:07 PM
Y - Faces little resistance due to overhead supply while rallying within close striking distance of its 52-week high today with another volume-driven gain. Color code is changed to yellow with new pivot point cited based on its 2/16/12 high plus 10 cents. A volume-driven gain above its pivot point may trigger a technical buy signal. Its fundamentals remain strong with respect to the C and A criteria. Found support above its 200 DMA line and it rebounded above its 50 DMA line in recent weeks since 3/28/12 when it was dropped from the Featured Stocks list.
>>> The latest Featured Stock Update with an annotated graph appeared on 6/22/2012. Click here.
View all notes |
Alert me of new notes |
CANSLIM.net Company Profile |
SEC |
Zacks Reports |
StockTalk |
News |
Chart |
Request a new note
C
A N
S L
I M
|
EXPE
-
NASDAQ
Expedia Inc
INTERNET - Internet Information Providers
|
$48.03
|
+0.20
0.42% |
$48.38
|
4,107,633
87.16% of 50 DAV
50 DAV is 4,712,700
|
$50.66
-5.19%
|
4/27/2012
|
$41.80
|
PP = $35.57
|
|
MB = $37.35
|
Most Recent Note - 6/20/2012 12:05:32 PM
G - Pulling back from its 52-week high today with a 3rd consecutive loss. It is extended from its prior highs in the $43 area which define initial support above its 50 DMA line.
>>> The latest Featured Stock Update with an annotated graph appeared on 6/8/2012. Click here.
View all notes |
Alert me of new notes |
CANSLIM.net Company Profile |
SEC |
Zacks Reports |
StockTalk |
News |
Chart |
Request a new note
C
A N
S L
I M
|
GNC
-
NYSE
G N C Holdings Inc
RETAIL - Drug Stores
|
$37.08
|
+0.60
1.64% |
$37.37
|
6,610,859
301.85% of 50 DAV
50 DAV is 2,190,100
|
$41.95
-11.61%
|
1/19/2012
|
$28.99
|
PP = $29.60
|
|
MB = $31.08
|
Most Recent Note - 6/22/2012 5:16:25 PM
G - Posted a gain today with 3 times average volume as it continued rebounding toward its 50 DMA line which may now act as a resistance level. Gains above that short-term average would help its technical stance and improve the outlook.
>>> The latest Featured Stock Update with an annotated graph appeared on 6/6/2012. Click here.
View all notes |
Alert me of new notes |
CANSLIM.net Company Profile |
SEC |
Zacks Reports |
StockTalk |
News |
Chart |
Request a new note
C
A N
S L
I M
|
MLNX
-
NASDAQ
Mellanox Technologies
ELECTRONICS - Semiconductor - Broad Line
|
$69.33
|
+3.33
5.05% |
$70.13
|
1,406,630
212.55% of 50 DAV
50 DAV is 661,800
|
$74.27
-6.65%
|
6/18/2012
|
$70.90
|
PP = $67.30
|
|
MB = $70.67
|
Most Recent Note - 6/22/2012 5:19:45 PM
Y - Managed a "positive reversal" today for a solid volume-driven gain and close back above its pivot point. Prior highs define chart support to watch. Disciplined investors limit losses if ever a stock falls more than -7% from their purchase price. On 6/18/12 it was highlighted in yellow in the mid-day report after it gapped up, rising from an 9-week cup-shaped base without a handle triggering a technical buy signal. Reported earnings +113% on +61% sales revenues for the quarter ended March 31, 2012 versus the year ago period. Its streak of 3 strong quarterly earnings comparisons now satisfies the C criteria. A downturn in FY '09 earnings is a small flaw in its annual earnings (A criteria) history. Gapped up on 4/17/12 for a new all-time high following an analyst upgrade. Top-rated funds owning its shares rose from 108 in Jun '11 to 177 in Mar '12 a reassuring sign concerning the I criteria.

There are no Featured Stock Updates™ available for this stock at this time. You may request one by clicking the Request a New Note link below
View all notes |
Alert me of new notes |
CANSLIM.net Company Profile |
SEC |
Zacks Reports |
StockTalk |
News |
Chart |
Request a new note
C
A N
S L
I M
|
N
-
NYSE
Netsuite Inc
DIVERSIFIED SERVICES - Business/Management Services
|
$52.04
|
+0.54
1.05% |
$52.82
|
2,656,783
567.93% of 50 DAV
50 DAV is 467,800
|
$52.79
-1.42%
|
6/20/2012
|
$51.83
|
PP = $51.88
|
|
MB = $54.47
|
Most Recent Note - 6/22/2012 5:22:02 PM
Y - Posted a small gain today with more than 5 times average volume. It finished the week back above the pivot point cited based on its 3/27/12 high plus 10 cents.
>>> The latest Featured Stock Update with an annotated graph appeared on 6/20/2012. Click here.
View all notes |
Alert me of new notes |
CANSLIM.net Company Profile |
SEC |
Zacks Reports |
StockTalk |
News |
Chart |
Request a new note
C
A N
S L
I M
|
Symbol/Exchange
Company Name
Industry Group |
PRICE |
CHANGE
(%Change) |
Day High |
Volume
(% DAV)
(% 50 day avg vol) |
52 Wk Hi
% From Hi |
Featured
Date |
Price
Featured |
Pivot Featured |
|
Max Buy |
NTES
-
NASDAQ
Netease Inc Adr
INTERNET - Internet Information Providers
|
$59.71
|
-1.54
-2.51% |
$61.81
|
494,023
68.85% of 50 DAV
50 DAV is 717,500
|
$65.54
-8.90%
|
3/19/2012
|
$56.18
|
PP = $55.10
|
|
MB = $57.86
|
Most Recent Note - 6/22/2012 5:14:15 PM
G - Today's 3rd consecutive loss with below average volume has it testing its 50 DMA line again. Prior lows near the $55 area define additional chart support. Violations may trigger a worrisome technical sell signals.
>>> The latest Featured Stock Update with an annotated graph appeared on 6/19/2012. Click here.
View all notes |
Alert me of new notes |
CANSLIM.net Company Profile |
SEC |
Zacks Reports |
StockTalk |
News |
Chart |
Request a new note
C
A N
S L
I M
|
SWI
-
NYSE
Solarwinds Inc
COMPUTER SOFTWARE and SERVICES - Application Software
|
$45.54
|
+1.41
3.20% |
$46.05
|
5,144,452
525.86% of 50 DAV
50 DAV is 978,300
|
$48.64
-6.37%
|
4/26/2012
|
$45.15
|
PP = $42.32
|
|
MB = $44.44
|
Most Recent Note - 6/22/2012 5:25:21 PM
Y - Posted a gain today with more than 5 times average volume, rallying from support at its 50 DMA line. A valid secondary buy point exists up to +5% above the recent high. The 6/04/11 low ($41.24) defines important support to watch on pullbacks.
>>> The latest Featured Stock Update with an annotated graph appeared on 6/15/2012. Click here.
View all notes |
Alert me of new notes |
CANSLIM.net Company Profile |
SEC |
Zacks Reports |
StockTalk |
News |
Chart |
Request a new note
C
A N
S L
I M
|
SXCI
-
NASDAQ
S X C Health Solutions
COMPUTER SOFTWARE and SERVICES - Healthcare Information Service
|
$95.51
|
+2.23
2.39% |
$96.02
|
1,249,130
94.15% of 50 DAV
50 DAV is 1,326,700
|
$103.97
-8.14%
|
6/14/2012
|
$94.71
|
PP = $100.60
|
|
MB = $105.63
|
Most Recent Note - 6/22/2012 5:27:06 PM
Y - Today's gain halted a 3 session losing streak. There was a "negative reversal" on 6/19/12 after hitting a new 52-week high, failing to close the session above its pivot point to clinch a convincing technical buy signal. Its 50 DMA line defines important support for chart readers.
>>> The latest Featured Stock Update with an annotated graph appeared on 6/14/2012. Click here.
View all notes |
Alert me of new notes |
CANSLIM.net Company Profile |
SEC |
Zacks Reports |
StockTalk |
News |
Chart |
Request a new note
C
A N
S L
I M
|
TDG
-
NYSE
Transdigm Group Inc
AEROSPACE/DEFENSE - Aerospace/Defense Products and; Services
|
$127.14
|
-0.36
-0.28% |
$128.13
|
341,599
62.42% of 50 DAV
50 DAV is 547,300
|
$132.69
-4.18%
|
6/18/2012
|
$127.00
|
PP = $132.79
|
|
MB = $139.43
|
Most Recent Note - 6/20/2012 1:22:21 PM
Y - Today's 3rd consecutive gain has it poised for a best ever close and perched within close striking distance of its all-time high. Color code was changed to yellow with new pivot point cited. Subsequent volume-driven gains above the pivot point may trigger a new (or add-on) technical buy signal. Its prior low ($118.43 on 5/18/12) defines the next important near-term chart support level to watch.
>>> The latest Featured Stock Update with an annotated graph appeared on 6/18/2012. Click here.
View all notes |
Alert me of new notes |
CANSLIM.net Company Profile |
SEC |
Zacks Reports |
StockTalk |
News |
Chart |
Request a new note
C
A N
S L
I M
|
UA
-
NYSE
Under Armour Inc Cl A
CONSUMER NON-DURABLES - Textile - Apparel Clothing
|
$99.76
|
+1.29
1.31% |
$100.00
|
1,113,314
108.73% of 50 DAV
50 DAV is 1,023,900
|
$107.86
-7.51%
|
2/15/2012
|
$85.77
|
PP = $84.86
|
|
MB = $89.10
|
Most Recent Note - 6/21/2012 6:02:30 PM
G - Fell to its 50 DMA line today with a damaging loss on heavy volume after a gap down following an analyst downgrade. Its recently wedged to new 52-week highs without especially great volume conviction behind its gains. See the latest FSU analysis for additional details and a new annotated graph.
>>> The latest Featured Stock Update with an annotated graph appeared on 6/21/2012. Click here.
View all notes |
Alert me of new notes |
CANSLIM.net Company Profile |
SEC |
Zacks Reports |
StockTalk |
News |
Chart |
Request a new note
C
A N
S L
I M
|
Symbol/Exchange
Company Name
Industry Group |
PRICE |
CHANGE
(%Change) |
Day High |
Volume
(% DAV)
(% 50 day avg vol) |
52 Wk Hi
% From Hi |
Featured
Date |
Price
Featured |
Pivot Featured |
|
Max Buy |
VSI
-
NYSE
Vitamin Shoppe Inc
SPECIALTY RETAIL - Specialty Retail, Other
|
$54.16
|
+0.82
1.54% |
$55.03
|
979,415
202.86% of 50 DAV
50 DAV is 482,800
|
$55.29
-2.04%
|
4/25/2012
|
$47.77
|
PP = $48.46
|
|
MB = $50.88
|
Most Recent Note - 6/20/2012 1:11:12 PM
Y - Up today for a 4th consecutive gain, poised for a best-ever close. Found support above prior highs in the $48 area and above its 50 DMA line. One may consider a secondary buy point from its successful test of the 10 week average up to +5% above the recent high. Disciplined investors always limit losses by selling if a stock falls more than -7% from their buy price.
>>> The latest Featured Stock Update with an annotated graph appeared on 6/4/2012. Click here.
View all notes |
Alert me of new notes |
CANSLIM.net Company Profile |
SEC |
Zacks Reports |
StockTalk |
News |
Chart |
Request a new note
C
A N
S L
I M
|
WFM
-
NASDAQ
Whole Foods Market Inc
RETAIL - Grocery Stores
|
$96.27
|
+2.10
2.23% |
$96.96
|
3,442,183
180.11% of 50 DAV
50 DAV is 1,911,200
|
$96.79
-0.54%
|
6/13/2012
|
$89.90
|
PP = $91.60
|
|
MB = $96.18
|
Most Recent Note - 6/22/2012 5:29:49 PM
G - Rallied to a new high close and new 52-week high with +80% above average volume behind its gain today. Color code is changed to green after closing above its "max buy" level. No resistance remains due to overhead supply. Its 50 DMA line and prior lows define important near-term support.
>>> The latest Featured Stock Update with an annotated graph appeared on 6/13/2012. Click here.
View all notes |
Alert me of new notes |
CANSLIM.net Company Profile |
SEC |
Zacks Reports |
StockTalk |
News |
Chart |
Request a new note
C
A N
S L
I M
|
|
|
|
THESE ARE NOT BUY RECOMMENDATIONS!
Comments contained in the body of this report are technical
opinions only. The material herein has been obtained
from sources believed to be reliable and accurate, however,
its accuracy and completeness cannot be guaranteed.
This site is not an investment advisor, hence it does
not endorse or recommend any securities or other investments.
Any recommendation contained in this report may not
be suitable for all investors and it is not to be deemed
an offer or solicitation on our part with respect to
the purchase or sale of any securities. All trademarks,
service marks and trade names appearing in this report
are the property of their respective owners, and are
likewise used for identification purposes only.
This report is a service available
only to active Paid Premium Members.
You may opt-out of receiving report notifications
at any time. Questions or comments may be submitted
by writing to Premium Membership Services 665 S.E. 10 Street, Suite 201 Deerfield Beach, FL 33441-5634 or by calling 1-800-965-8307
or 954-785-1121.
|
|
|

