You are not logged in.
This means you
CAN ONLY VIEW reports that were published prior to Monday, April 14, 2025.
You
MUST UPGRADE YOUR MEMBERSHIP if you want to see any current reports.
AFTER MARKET UPDATE - TUESDAY, JUNE 22ND, 2010
Previous After Market Report Next After Market Report >>>
|
|
|
|
DOW |
-148.89 |
10,293.52 |
-1.43% |
|
Volume |
1,118,283,110 |
+5% |
|
Volume |
1,844,499,890 |
-0% |
|
NASDAQ |
-27.29 |
2,261.80 |
-1.19% |
|
Advancers |
618 |
19% |
|
Advancers |
589 |
21% |
|
S&P 500 |
-17.89 |
1,095.31 |
-1.61% |
|
Decliners |
2,467 |
78% |
|
Decliners |
2,078 |
75% |
|
Russell 2000 |
-14.12 |
645.91 |
-2.14% |
|
52 Wk Highs |
31 |
|
|
52 Wk Highs |
29 |
|
|
S&P 600 |
-7.10 |
344.71 |
-2.02% |
|
52 Wk Lows |
20 |
|
|
52 Wk Lows |
61 |
|
|
 |
Indices Reversed Early Gains Once Again
Adam Sarhan, Contributing Writer,
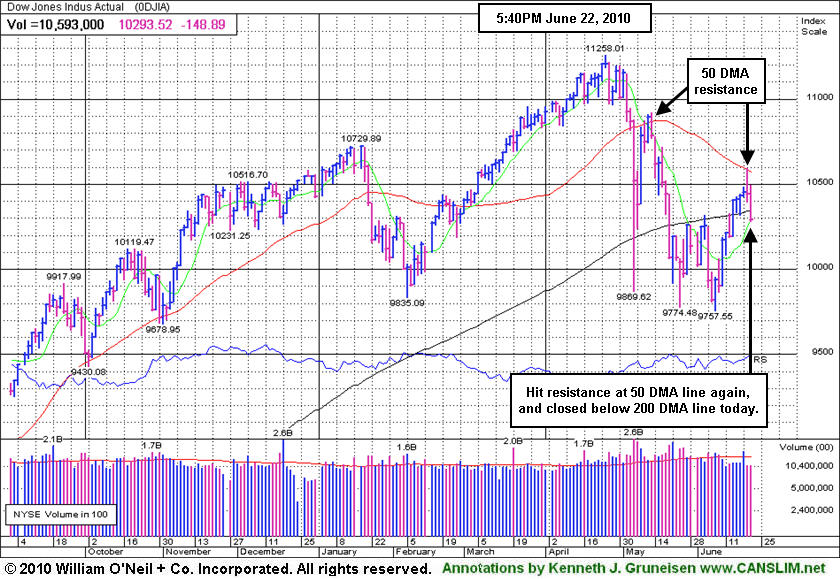
The major averages negatively reversed for a second straight day as the dollar rallied, putting pressure on the current rally. It was disconcerting to see both the Dow Jones Industrial Average and the benchmark S&P 500 Index close below their respective 200 DMA lines only one week after the latest follow-through day (FTD) confirmed a new rally. Volume totals were reported very near Monday's levels on the Nasdaq exchange and higher on the NYSE which marked a distribution day and suggested large institutions are selling stocks. Decliners led advancers by approximately 4-to-1 on the NYSE and on the Nasdaq exchange. There were 12 high-ranked companies from the CANSLIM.net Leaders List that made a new 52-week high and appeared on the CANSLIM.net BreakOuts Page, substantially lower than the 50 issues that appeared on the prior session. Without a healthy crop of leaders hitting new highs it is hard for the major averages to sustain a rally. New 52-week highs outnumbered new 52-week lows on the NYSE but trailed on the Nasdaq exchange.
Stocks opened higher but closed lower after the National Association of Realtors said sales of previously owned homes fell -2.2% last month and the euro fell for a second consecutive day. Elsewhere, the Obama administration said it would appeal a Louisiana judge's verdict to overthrow the six-month ban on new deep-water drilling projects.
Technically, the fact that both the Dow Jones Industrial Average and the S&P 500 Index closed below their respective 200-day moving average (DMA) lines suggests the market may retest its recent lows. Looking forward, the 50 DMA line may act as stubborn resistance and this month's lows should act as support. Since last Tuesday's FTD, this column has steadily noted the importance of remaining very selective and disciplined because all of the major averages are still trading below their downward sloping 50-day moving average (DMA) lines. This week's sell-off simply confirms that view. Trade accordingly.
Are You Ready For This NEW Confirmed Rally?
Inquire Today About Our Professional Money Management Services:
If your portfolio is greater than $100,000 and you need assistance, click here to get connected with one of our portfolio managers. ** Serious inquires only, please.
PICTURED: The Dow Jones Industrial Average's rally ran into resistance at its 50 DMA line as it reversed on Monday. Today's loss led to a close back below its 200 DMA line.
|
|
|
 |
Energy, Retail, and Defensive Groups Leading Decliners
Kenneth J. Gruneisen - Passed the CAN SLIM® Master's Exam
The Healthcare Index ($HMO -2.52%) fell and the Gold & Silver Index ($XAU -1.02%) slumped as defensive areas offered investors no reward as a "safe haven" area. Energy-related shares were standout decliners on Tuesday's widely negative session as the Oil Services Index ($OSX -3.52%) and Integrated Oil Index ($XOI -2.25%) sank. The Retail Index ($RLX -2.05%) sank to its first close below its 200-day moving average line since April 2009, yet it stayed a couple of points above its recent chart low shown in yesterday's Industry Group Watch section (read here). Bank Index ($BKX -1.50%) and Broker/Dealer Index ($XBD -0.72%) had a negative influence on the major averages. The tech sector also came under pressure as the Networking Index ($NWX -2.01%), Biotechnology Index ($BTK -1.90%), Semiconductor Index ($SOX -1.81%), and Internet Index ($IIX -1.29%) ended unanimously lower.
Charts courtesy www.stockcharts.com
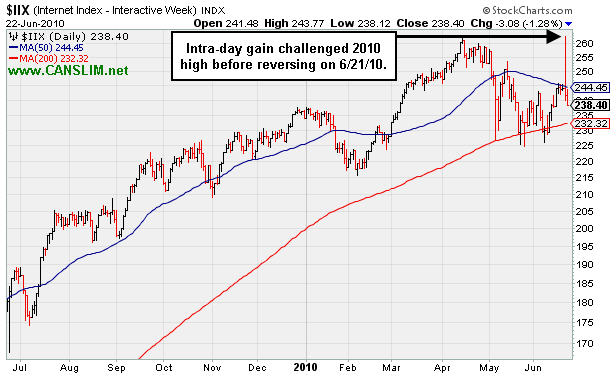
PICTURED: The Internet Index's ($IIX -1.29%) intra-day gain challenged 2010 high before reversing on 6/21/10. Today it slumped further below its 50 DMA line.
| Oil Services |
$OSX |
175.55 |
-6.40 |
-3.52% |
-9.94% |
| Healthcare |
$HMO |
1,516.82 |
-39.26 |
-2.52% |
+2.98% |
| Integrated Oil |
$XOI |
952.87 |
-21.90 |
-2.25% |
-10.80% |
| Semiconductor |
$SOX |
361.39 |
-6.65 |
-1.81% |
+0.41% |
| Networking |
$NWX |
232.51 |
-4.77 |
-2.01% |
+0.63% |
| Internet |
$IIX |
238.36 |
-3.12 |
-1.29% |
+1.93% |
| Broker/Dealer |
$XBD |
104.75 |
-0.76 |
-0.72% |
-8.95% |
| Retail |
$RLX |
415.73 |
-8.69 |
-2.05% |
+1.12% |
| Gold & Silver |
$XAU |
179.75 |
-1.85 |
-1.02% |
+6.84% |
| Bank |
$BKX |
49.23 |
-0.75 |
-1.50% |
+15.27% |
| Biotech |
$BTK |
1,069.20 |
-20.70 |
-1.90% |
+13.49% |
|
|
|
 |
High-Ranked Mining Firm Headquartered In Colorodo
Adam Sarhan, Contributing Writer,
| Newmont Mining Corp |
|
|
Ticker Symbol: NEM (NYSE) |
Industry Group: Mining- Gold/Silver/Gems |
Shares Outstanding: 478,600,000 |
|
Price: $59.60 6/22/2010 3:25PM |
Day's Volume: 4,840,200 6/22/2010 3:25PM |
Shares in Float: 483,000,000 |
|
52 Week High: $61.78 6/18/2010 |
50-Day Average Volume: 9,318,400 |
Up/Down Volume Ratio: 1.4 |
|
Pivot Point: $59.67 5/12/2010 high plus $0.10 |
Pivot Point +5% = Max Buy Price: $62.66 |
Web Address: http://www.newmont.com
|
 CANSLIM.net Profile: Newmont Mining Corporation (NEM), together with its subsidiaries, engages in the acquisition, exploration, and production of gold and copper properties. Its assets or operations are located in the United States, Australia, Peru, Indonesia, Ghana, Canada, New Zealand, and Mexico. As of December 31, 2009, Newmont had proven and probable gold reserves of approximately 91.8 million equity ounces and an aggregate land position of approximately 33,400 square miles. The C and A criteria are satisfied as the company has demonstrated solid quarterly sales revenues and earnings increases (above the +25% minimum guideline) in recent comparisons and it has a good annual earnings history. The group's Relative Strength rank of 91 provides a nice reassurance for the L criteria. The company was founded in 1916 and is headquartered in Greenwood Village, Colorado. Many other gold mining interests are headquartered overseas which increases their potential pitfalls due to geopolitical shifts.
What to Look For and What to Look Out For: Look for the stock to confirm a new technical buy signal by confirming its recent gain above its $59.67 pivot point with gains on heavy volume in the coming days and weeks. Buyable breakouts require that the stock rise above its pivot point with considerable gains and those gains must be backed by a minimum of at least +40%-50% above average volume, ideally much more. As always, it is of the utmost importance to sell a stock if it drops 7-8% below your purchase price. This high-ranked leader should remain on an active watchlist and could be considered as a new buy candidate in the event it closes above its pivot point on the necessary volume needed to trigger a technical buy signal. Look for an opportunity to properly pyramid buying efforts with chasing the stock more than 5% above its Pivot Point or "Max Buy" level.
Technical Analysis: NEM is currently pulling back to retest its pivot point and prior chart highs. Recent gains lacked the heavy volume required to trigger a proper buy signal. No overhead supply remains to act as resistance. Keep in mind it is also near its January 2006 all-time high ($62.72) and it is within striking distance of a long-term technical breakout. Newmont is trading above its upward sloping 50-day moving average line, which is another healthy sign considering all the major averages are currently trading below their respective 50 DMA lines. In addition, the 50 DMA line is sloping higher and is currently above its longer term 200 DMA line which is also another positive. |
|
|
Color Codes Explained :
Y - Better candidates highlighted by our
staff of experts.
G - Previously featured
in past reports as yellow but may no longer be buyable under the
guidelines.
***Last / Change / Volume data in this table is the closing quote data***
Symbol/Exchange
Company Name
Industry Group |
PRICE |
CHANGE
(%Change) |
Day High |
Volume
(% DAV)
(% 50 day avg vol) |
52 Wk Hi
% From Hi |
Featured
Date |
Price
Featured |
Pivot Featured |
|
Max Buy |
AAPL
-
NASDAQ
Apple Inc
COMPUTER HARDWARE - Personal Computers
|
$273.85
|
+3.68
1.36% |
$275.97
|
25,558,798
93.71% of 50 DAV
50 DAV is 27,273,700
|
$279.01
-1.85%
|
6/17/2010
|
$270.95
|
PP = $272.56
|
|
MB = $286.19
|
 Most Recent Note - 6/22/2010 6:17:21 PM
Y - Gapped up today for a small gain on lighter volume. Hit a new all-time high on 6/21/10 and then negatively reversed, breaking a streak of 7 consecutive gains. In the 6/17/10 mid-day report (read here) it was featured again in yellow with a new pivot point cited based upon its all-time high plus ten cents while "working on the right side of a choppy 9-week consolidation marked by heavy distribution."
>>> The latest Featured Stock Update with an annotated graph appeared on 6/17/2010. Click here.
View all notes |
Alert me of new notes |
CANSLIM.net Company Profile |
SEC |
Zacks Reports |
StockTalk |
News |
Chart |
Request a new note
C
A N
S L
I M


|
APEI
-
NASDAQ
American Public Educ Inc
DIVERSIFIED SERVICES - Education and Training Services
|
$46.44
|
-1.56
-3.25% |
$48.00
|
115,746
67.29% of 50 DAV
50 DAV is 172,000
|
$48.95
-5.13%
|
6/7/2010
|
$46.60
|
PP = $46.29
|
|
MB = $48.60
|
Most Recent Note - 6/22/2010 6:19:25 PM
Y - Considerable loss today on lighter than average volume, pulling back near its pivot point after gains to new highs on better volume.
>>> The latest Featured Stock Update with an annotated graph appeared on 6/14/2010. Click here.
View all notes |
Alert me of new notes |
CANSLIM.net Company Profile |
SEC |
Zacks Reports |
StockTalk |
News |
Chart |
Request a new note
C
A N
S L
I M
|
BIDU
-
NASDAQ
Baidu Inc Ads
INTERNET - Internet Information Providers
|
$75.68
|
-0.68
-0.89% |
$77.50
|
12,315,650
82.19% of 50 DAV
50 DAV is 14,984,000
|
$82.29
-8.03%
|
1/13/2010
|
$43.13
|
PP = $42.68
|
|
MB = $44.81
|
Most Recent Note - 6/22/2010 6:25:02 PM
G - Holding its ground perched about -8% below its 52-week high while building a sloppy late-stage base.
>>> The latest Featured Stock Update with an annotated graph appeared on 6/21/2010. Click here.
View all notes |
Alert me of new notes |
CANSLIM.net Company Profile |
SEC |
Zacks Reports |
StockTalk |
News |
Chart |
Request a new note
C
A N
S L
I M
|
BRLI
-
NASDAQ
Bio Reference Labs Inc
HEALTH SERVICES - Medical Laboratories and Researc
|
$22.80
|
-0.13
-0.57% |
$23.37
|
252,754
135.16% of 50 DAV
50 DAV is 187,000
|
$24.67
-7.59%
|
6/15/2010
|
$23.57
|
PP = $24.77
|
|
MB = $26.01
|
Most Recent Note - 6/22/2010 6:29:53 PM
Y - Small loss today on higher volume, ending just below its 50 DMA line again. Perched within close striking distance of its all-time high.
>>> The latest Featured Stock Update with an annotated graph appeared on 6/15/2010. Click here.
View all notes |
Alert me of new notes |
CANSLIM.net Company Profile |
SEC |
Zacks Reports |
StockTalk |
News |
Chart |
Request a new note
C
A N
S L
I M
|
CISG
-
NASDAQ
Cninsure Inc Ads
INSURANCE - Insurance Brokers
|
$27.50
|
+0.00
0.00% |
$27.69
|
304,651
101.21% of 50 DAV
50 DAV is 301,000
|
$28.62
-3.91%
|
6/16/2010
|
$27.20
|
PP = $27.75
|
|
MB = $29.14
|
Most Recent Note - 6/21/2010 12:12:42 PM
Y - Near the session low after early gains today helped it briefly trade above its pivot point. Featured in the 6/16/10 mid-day report (read here) with new pivot point cited based upon its 5/13/10 high.
>>> The latest Featured Stock Update with an annotated graph appeared on 6/18/2010. Click here.
View all notes |
Alert me of new notes |
CANSLIM.net Company Profile |
SEC |
Zacks Reports |
StockTalk |
News |
Chart |
Request a new note
C
A N
S L
I M
|
Symbol/Exchange
Company Name
Industry Group |
PRICE |
CHANGE
(%Change) |
Day High |
Volume
(% DAV)
(% 50 day avg vol) |
52 Wk Hi
% From Hi |
Featured
Date |
Price
Featured |
Pivot Featured |
|
Max Buy |
CRM
-
NYSE
Salesforce.Com Inc
INTERNET - Internet Software and Services
|
$91.90
|
-3.51
-3.68% |
$95.81
|
3,297,939
123.37% of 50 DAV
50 DAV is 2,673,200
|
$97.94
-6.17%
|
6/2/2010
|
$88.44
|
PP = $89.60
|
|
MB = $94.08
|
Most Recent Note - 6/22/2010 6:43:02 PM
G - Today marked its 3rd consecutive loss and volume was above average while it fell toward its old pivot point. Prior highs in the $89 area are an important support level to watch above its 50 DMA line.
>>> The latest Featured Stock Update with an annotated graph appeared on 6/22/2010. Click here.
View all notes |
Alert me of new notes |
CANSLIM.net Company Profile |
SEC |
Zacks Reports |
StockTalk |
News |
Chart |
Request a new note
C
A N
S L
I M
|
DECK
-
NASDAQ
Deckers Outdoor Corp
CONSUMER NON-DURABLES - Textile - Apparel Footwear
|
$156.97
|
-3.36
-2.10% |
$162.55
|
572,879
109.20% of 50 DAV
50 DAV is 524,600
|
$168.52
-6.85%
|
6/11/2010
|
$157.34
|
PP = $158.57
|
|
MB = $166.50
|
Most Recent Note - 6/22/2010 6:45:50 PM
Y - Pulling back today, it closed below its pivot point. After reaching a new all-time high it negatively reversed on the prior session. Prior chart highs may now serve as initial support on pullbacks.
>>> The latest Featured Stock Update with an annotated graph appeared on 6/11/2010. Click here.
View all notes |
Alert me of new notes |
CANSLIM.net Company Profile |
SEC |
Zacks Reports |
StockTalk |
News |
Chart |
Request a new note
C
A N
S L
I M
|
FFIV
-
NASDAQ
F 5 Networks Inc
INTERNET - Internet Software and Services
|
$73.17
|
-1.05
-1.41% |
$76.00
|
1,478,384
89.11% of 50 DAV
50 DAV is 1,659,100
|
$77.10
-5.10%
|
6/16/2010
|
$74.50
|
PP = $74.10
|
|
MB = $77.81
|
Most Recent Note - 6/22/2010 6:48:07 PM
Y - Revered into the red today after early gains. It hit a new all-time high on the prior session but reversed and closed near its session low. Gain on 6/16/10 with +55% above average volume helped it trigger a technical buy signal with its breakout from a flat base of about 5-weeks.
>>> The latest Featured Stock Update with an annotated graph appeared on 6/16/2010. Click here.
View all notes |
Alert me of new notes |
CANSLIM.net Company Profile |
SEC |
Zacks Reports |
StockTalk |
News |
Chart |
Request a new note
C
A N
S L
I M
|
MELI
-
NASDAQ
Mercadolibre Inc
INTERNET - Internet Software and; Services
|
$57.52
|
-3.11
-5.13% |
$62.00
|
1,505,361
192.40% of 50 DAV
50 DAV is 782,400
|
$62.14
-7.43%
|
5/13/2010
|
$54.21
|
PP = $55.85
|
|
MB = $58.64
|
Most Recent Note - 6/22/2010 6:51:04 PM
G - Considerable loss today with above average volume. Prior chart highs in the $55 area define support to watch on pullbacks.
>>> The latest Featured Stock Update with an annotated graph appeared on 6/10/2010. Click here.
View all notes |
Alert me of new notes |
CANSLIM.net Company Profile |
SEC |
Zacks Reports |
StockTalk |
News |
Chart |
Request a new note
C
A N
S L
I M
|
NEM
-
NYSE
Newmont Mining Corp
METALS and MINING - Gold
|
$59.52
|
+0.04
0.07% |
$60.39
|
6,328,228
68.33% of 50 DAV
50 DAV is 9,261,800
|
$61.78
-3.66%
|
6/22/2010
|
$59.60
|
PP = $59.67
|
|
MB = $62.65
|
Most Recent Note - 6/22/2010 6:55:34 PM
Y - A timely new Stock Bulletin with annotated graph was released on this high-ranked leader late this afternoon (read here).
>>> The latest Featured Stock Update with an annotated graph appeared on 6/22/2010. Click here.
View all notes |
Alert me of new notes |
CANSLIM.net Company Profile |
SEC |
Zacks Reports |
StockTalk |
News |
Chart |
Request a new note
C
A N
S L
I M
|
Symbol/Exchange
Company Name
Industry Group |
PRICE |
CHANGE
(%Change) |
Day High |
Volume
(% DAV)
(% 50 day avg vol) |
52 Wk Hi
% From Hi |
Featured
Date |
Price
Featured |
Pivot Featured |
|
Max Buy |
ROVI
-
NASDAQ
Rovi Corp
COMPUTER SOFTWARE andamp; SERVICES - Security Software andamp; Services
|
$36.26
|
-1.15
-3.07% |
$37.60
|
681,587
50.45% of 50 DAV
50 DAV is 1,351,100
|
$40.06
-9.49%
|
6/3/2010
|
$38.70
|
PP = $40.16
|
|
MB = $42.17
|
Most Recent Note - 6/22/2010 6:58:52 PM
G - Slumped under its 50 DMA line with a loss today on light volume. Recently found support near prior lows in the $35 area, and stayed above its October 2009 chart high.
>>> The latest Featured Stock Update with an annotated graph appeared on 6/9/2010. Click here.
View all notes |
Alert me of new notes |
CANSLIM.net Company Profile |
SEC |
Zacks Reports |
StockTalk |
News |
Chart |
Request a new note
C
A N
S L
I M
|
SUMR
-
NASDAQ
Summer Infant Inc
CONSUMER NON-DURABLES - Personal Products
|
$6.99
|
-0.17
-2.37% |
$7.13
|
48,366
60.38% of 50 DAV
50 DAV is 80,100
|
$8.42
-16.98%
|
5/4/2010
|
$6.85
|
PP = $7.09
|
|
MB = $7.44
|
Most Recent Note - 6/22/2010 6:59:58 PM
G - Consolidating on light volume near its 50 DMA line and prior chart highs in the $7 area. Recent chart lows in the $6.25 area define important support to watch now.
>>> The latest Featured Stock Update with an annotated graph appeared on 6/8/2010. Click here.
View all notes |
Alert me of new notes |
CANSLIM.net Company Profile |
SEC |
Zacks Reports |
StockTalk |
News |
Chart |
Request a new note
C
A N
S L
I M
|
THOR
-
NASDAQ
Thoratec Corp
HEALTH SERVICES - Medical Instruments and Supplies
|
$44.27
|
-2.16
-4.65% |
$46.67
|
961,361
98.44% of 50 DAV
50 DAV is 976,600
|
$47.93
-7.64%
|
6/3/2010
|
$44.38
|
PP = $45.35
|
|
MB = $47.62
|
Most Recent Note - 6/22/2010 7:03:25 PM
Y- Considerable loss today on average volume, slumping to a close under its pivot point, raising concerns.
>>> The latest Featured Stock Update with an annotated graph appeared on 6/3/2010. Click here.
View all notes |
Alert me of new notes |
CANSLIM.net Company Profile |
SEC |
Zacks Reports |
StockTalk |
News |
Chart |
Request a new note
C
A N
S L
I M
|
ULTA
-
NASDAQ
Ulta Salon Cosm & Frag
SPECIALTY RETAIL - Specialty Retail, Other
|
$25.05
|
-0.50
-1.96% |
$25.87
|
701,253
113.42% of 50 DAV
50 DAV is 618,300
|
$26.75
-6.36%
|
5/28/2010
|
$25.58
|
PP = $25.86
|
|
MB = $27.15
|
Most Recent Note - 6/22/2010 7:05:41 PM
Y - Pulled back further today after a negative reversal from an all-time high on the prior session. No overhead supply remains to act as resistance, however, on 6/11/10 it completed a Secondary Offering which may hinder upward price progress for the near-term.
>>> The latest Featured Stock Update with an annotated graph appeared on 6/7/2010. Click here.
View all notes |
Alert me of new notes |
CANSLIM.net Company Profile |
SEC |
Zacks Reports |
StockTalk |
News |
Chart |
Request a new note
C
A N
S L
I M
|
|
|
|
THESE ARE NOT BUY RECOMMENDATIONS!
Comments contained in the body of this report are technical
opinions only. The material herein has been obtained
from sources believed to be reliable and accurate, however,
its accuracy and completeness cannot be guaranteed.
This site is not an investment advisor, hence it does
not endorse or recommend any securities or other investments.
Any recommendation contained in this report may not
be suitable for all investors and it is not to be deemed
an offer or solicitation on our part with respect to
the purchase or sale of any securities. All trademarks,
service marks and trade names appearing in this report
are the property of their respective owners, and are
likewise used for identification purposes only.
This report is a service available
only to active Paid Premium Members.
You may opt-out of receiving report notifications
at any time. Questions or comments may be submitted
by writing to Premium Membership Services 665 S.E. 10 Street, Suite 201 Deerfield Beach, FL 33441-5634 or by calling 1-800-965-8307
or 954-785-1121.
|
|
|


