You are not logged in.
This means you
CAN ONLY VIEW reports that were published prior to Monday, April 14, 2025.
You
MUST UPGRADE YOUR MEMBERSHIP if you want to see any current reports.
AFTER MARKET UPDATE - MONDAY, JUNE 22ND, 2009
Previous After Market Report Next After Market Report >>>
|
|
|
|
DOW |
-164.98 |
8,374.75 |
-1.93% |
|
Volume |
1,390,570,000 |
-35% |
|
Volume |
1,806,181,570 |
-43% |
|
NASDAQ |
-51.15 |
1,776.32 |
-2.80% |
|
Advancers |
403 |
13% |
|
Advancers |
475 |
17% |
|
S&P 500 |
-23.16 |
898.07 |
-2.51% |
|
Decliners |
2,634 |
85% |
|
Decliners |
2,264 |
81% |
|
Russell 2000 |
-15.27 |
497.45 |
-2.98% |
|
52 Wk Highs |
8 |
|
|
52 Wk Highs |
13 |
|
|
S&P 600 |
-7.94 |
261.76 |
-2.94% |
|
52 Wk Lows |
3 |
|
|
52 Wk Lows |
17 |
|
|
 |
Breadth Turns Very Negative As Indices Violate Important Averages
Adam Sarhan, Contributing Writer,
The major averages got smacked and the dollar rallied after the World Bank said the recession will be deeper than previously forecast. As expected, volume totals were reported lower on both major US exchanges due to Friday's options expirations. Decliners trumped advancers by over a 6-to-1 ratio on the NYSE and by over a 5-to-1 ratio on the Nasdaq exchange. There were only 5 high-ranked companies from the CANSLIM.net Leaders List that made a new 52-week high and appeared on the CANSLIM.net BreakOuts Page, lower than the 12 issues that appeared on the prior session. A further expansion in the new highs list would offer encouraging news for growth oriented investors.
The stock market and a slew of commodities sold off after the World Bank cast a dark cloud over the current global economic recovery. The World Bank believes that unemployment and poverty will rise in developing nations and predicted the global economy will fall by -2.9% for the rest of the year. That is lower than the World Bank's prior report of a -1.7% contraction. The Bank believes that economic growth will return in 2010 at a +2% rate. That is also lower than last quarter's estimate of a +2.3% rate.
A separate report showed that corporate insiders (i.e. executives at publicly traded US companies), are taking advantage of the largest 16-week rally in 71 years and are selling shares at a very fast clip. Insider selling hit the fastest level since the bear market began in October 2007. The report showed that insiders of S&P 500 companies are net sellers for the past 14 consecutive weeks as the market raced higher. The data was compiled by www.InsiderScore.com.
Looking at the market, the current rally is under serious pressure and has all but ended as the Dow Jones Industrail Average and S&P 500 sliced and closed below both their 50-day and 200-day moving average (DMA) lines. The Nasdaq Composite Index remains the strongest of the major averages as it continues trading above both its 50 and 200 DMA lines. Leading stocks are beginning to falter which is another disconcerting sign. Nouriel Roubini, the now famous New York University economics professor who forecasted the current financial crisis, said the global economy may suffer another hit due to higher oil prices and widening budget deficits. This sent a slew of commodities lower as investors rush to cash out healthy multi month moves. The Reuters/Jefferies CRB Index which measures 19 raw materials lost ground.
PICTURED: The 945 area is formidable resistance for the benchmark S&P 500 Index.
|
|
|
 |
Commodity, Financial, and Tech Groups Led Decliners
Kenneth J. Gruneisen - Passed the CAN SLIM® Master's Exam
Losses in the energy group smacked the Oil Services ($OSX -6.87%) and Integrated Oil ($XOI -4.47%) indexes on a decisively down session. Financial shares also dove as the Bank ($BKX -6.65%) and Broker/Dealer ($XBD -5.33%) indexes contributed to the major averages' unanimously negative bias. The Networking ($NWX -4.66%), Internet ($IIX -3.99%), Semiconductor ($SOX -3.73%), and Biotechnology ($BTK -2.20%) indexes were collectively punished as the tech sector stumbled. The Healthcare ($HMO -3.92%) group also was among the laggards, meanwhile the Retail Index ($RLX -1.58%) held its ground rather admirably.
Charts courtesy www.stockcharts.com
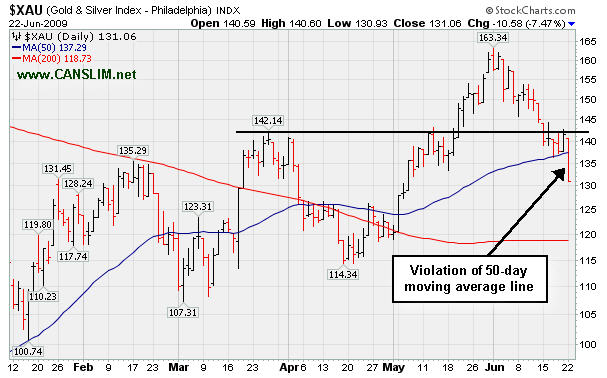
PICTURED: The Gold & Silver ($XAU -7.47%) violated its 50-day moving average line with a considerable loss on Monday.
| Oil Services |
$OSX |
154.39 |
-11.39 |
-6.87% |
+27.19% |
| Healthcare |
$HMO |
1,087.76 |
-44.39 |
-3.92% |
+13.29% |
| Integrated Oil |
$XOI |
888.09 |
-41.56 |
-4.47% |
-9.35% |
| Semiconductor |
$SOX |
254.60 |
-9.87 |
-3.73% |
+20.00% |
| Networking |
$NWX |
178.41 |
-8.73 |
-4.66% |
+23.99% |
| Internet |
$IIX |
179.76 |
-7.48 |
-3.99% |
+34.38% |
| Broker/Dealer |
$XBD |
93.02 |
-5.24 |
-5.33% |
+20.07% |
| Retail |
$RLX |
315.00 |
-5.07 |
-1.58% |
+12.80% |
| Gold & Silver |
$XAU |
131.06 |
-10.58 |
-7.47% |
+5.82% |
| Bank |
$BKX |
34.84 |
-2.48 |
-6.65% |
-21.39% |
| Biotech |
$BTK |
664.17 |
-14.96 |
-2.20% |
+2.63% |
|
|
|
 |
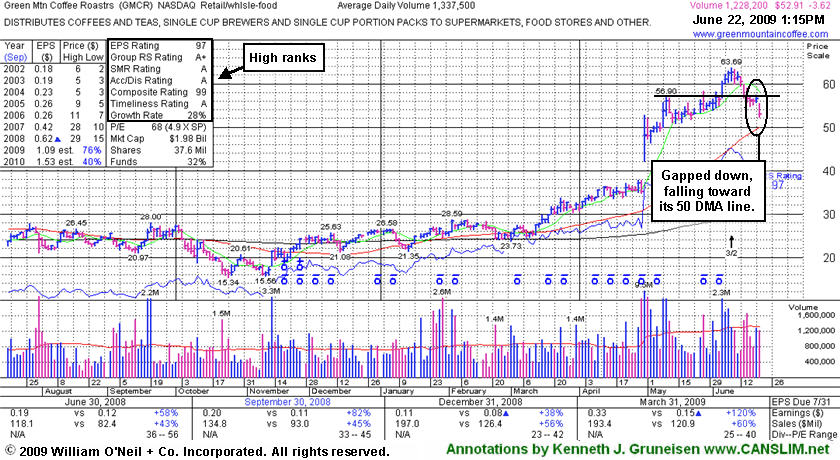
Gap Down Today Indicative Of Distributional Pressure
Kenneth J. Gruneisen - Passed the CAN SLIM® Master's Exam
Green Mountain Coffee Roasters (GMCR -$3.46 or -6.12% to $53.07) gapped down today and volume was almost twice its daily average volume while falling toward its 50 DMA line -important support to watch. Gaps down are worrisome signs of distributional pressure. It recently showed signs of institutional selling when volume spiked behind losses that negated its latest breakout from a "high-tight flag" type pattern. It had vaulted to a fresh all-time high when it made its last appearance in the Featured Stock Update section on Monday, June 8th (read here). It barely claimed its all-time high with a small gain on light volume as its 3:2 stock split took effect on 6/09/09. GMCR traded up more than +144% since appearing with an annotated graph under the headline "It May Soon Be Time To Go Green" when featured in the January 2009 CANSLIM.net News (read here).
|
|
|
Color Codes Explained :
Y - Better candidates highlighted by our
staff of experts.
G - Previously featured
in past reports as yellow but may no longer be buyable under the
guidelines.
***Last / Change / Volume quote data in this table corresponds with the timestamp on the note***
Symbol/Exchange
Company Name
Industry Group |
Last |
Chg. |
Vol
% DAV |
Date Featured |
Price Featured |
Latest Pivot Point
Featured |
Status |
| Latest Max Buy Price |
GMCR
- NASDAQ
Green Mtn Coffee Roastrs
FOOD & BEVERAGE - Processed & Packaged Goods
|
$53.07
|
N/A
|
N/A
N/A
|
1/1/2008
(Date
Featured) |
$27.13
(Price
Featured) |
PP = $28.66 |
G |
| MB = $30.09 |
Most Recent Note - 6/22/2009 9:12:28 PM
G - Gapped down today, raising concerns as volume was well above average while it fell toward its 50 DMA line -important support to watch. It barely claimed a new high on light volume as its 3:2 stock split took effect 6/09/09. GMCR traded up more than +144% since appearing with an annotated graph under the headline "It May Soon Be Time To Go Green" when featured in the January 2009 CANSLIM.net News (read here).
>>> The latest Featured Stock Update with an annotated graph appeared on 6/22/2009. click here.
|
|
C
A
S
I |
News |
Chart |
SEC
View all notes Alert
me of new notes
Company
Profile
|
HMSY
- NASDAQ
H M S Holdings Corp
COMPUTER SOFTWARE & SERVICES - Healthcare Information Service
|
$39.84
|
N/A
|
N/A
N/A
|
2/20/2009
(Date
Featured) |
$34.08
(Price
Featured) |
PP = $38.38 |
Y |
| MB = $40.30 |
Most Recent Note - 6/22/2009 9:22:36 PM
Y - Stubbornly held its recent gains today, trading just under its max buy level. Gap up gain on 6/16/09 with heavy volume triggered a technical buy signal. No overhead supply is left to hinder the progress for this Commercial Services - Healthcare firm.
>>> The latest Featured Stock Update with an annotated graph appeared on 6/16/2009. click here.
|
|
C
A
S
I |
News |
Chart |
SEC
View all notes Alert
me of new notes
Company
Profile
|
LFT
-
|
$25.33
|
N/A
|
N/A
N/A
|
4/2/2009
(Date
Featured) |
$22.19
(Price
Featured) |
PP = $21.81 |
G |
| MB = $22.90 |
Most Recent Note - 6/22/2009 9:37:06 PM
G - Loss today on light volume while closing still above support at its 50 DMA line. Previously noted on 6/05/09 as it rose from a choppy (improper) base pattern. Its progress could be hindered by future share offerings. Prompt repair of its recent 50 DMA line violation, and its gap up, were noted as signs of solid institutional (the I criteria) support and buying demand. This Chinese Computer Software firm recently filed a registration of approximately 16 million shares for resale, and it also revealed a planned acquisition of another Chinese service provider.
>>> The latest Featured Stock Update with an annotated graph appeared on 6/18/2009. click here.
|
|
C
A
S
I |
News |
Chart |
SEC
View all notes Alert
me of new notes
Company
Profile
|
NTES
- NASDAQ
Netease Inc Adr
INTERNET - Internet Information Providers
|
$33.80
|
N/A
|
N/A
N/A
|
5/21/2009
(Date
Featured) |
$31.19
(Price
Featured) |
PP = $32.75 |
G |
| MB = $34.39 |
Most Recent Note - 6/22/2009 9:39:03 PM
G - Consolidating above prior chart highs and its 50 DMA line (both near $32) - important support to watch. Its 5/28/09 gap up and considerable gain with +79% above average volume confirmed a technical buy signal as it rose above its pivot point. Indications of institutional (the I criteria) buying demand have been noted after earnings news on 5/20/09 a shakeout tested support near its 50 DMA line. First featured at $26.75 in the 3/31/09 CANSLIM.net Mid-Day Breakouts Report (read here). This high-ranked Chinese Internet - Content firm was also summarized in greater detail including an annotated graph in the April 2009 issue of CANSLIM.net News (read here).
>>> The latest Featured Stock Update with an annotated graph appeared on 6/19/2009. click here.
|
|
C
A
S
I |
News |
Chart |
SEC
View all notes Alert
me of new notes
Company
Profile
|
NVEC
- NASDAQ
N V E Corp
ELECTRONICS - Semiconductor - Specialized
|
$44.33
|
N/A
|
N/A
N/A
|
3/13/2009
(Date
Featured) |
$33.85
(Price
Featured) |
PP = $45.50 |
Y |
| MB = $47.78 |
Most Recent Note - 6/22/2009 9:40:42 PM
Y - Weak action negated a large part of Friday's gain. Volume more than 2 times average on 6/19/09 helped it rise from an "ascending base" type pattern to a new 52-week high and multi-year high, triggering a technical buy signal. Color code was changed to yellow with new pivot point and max buy prices noted in today's mid-day report (read here). Found support above its 50 DMA line in May which was an encouraging sign. Sales increases in recent comparisons have been under the +25% guideline and still rather minuscule, leaving concerns, especially in the event of any hiccups. This is a reason to be especially disciplined about proper entries and exits.
>>> The latest Featured Stock Update with an annotated graph appeared on 6/9/2009. click here.
|
|
C
A
S
I |
News |
Chart |
SEC
View all notes Alert
me of new notes
Company
Profile
|
SNDA
-
|
$51.83
|
N/A
|
N/A
N/A
|
5/31/2009
(Date
Featured) |
$57.62
(Price
Featured) |
PP = $53.95 |
G |
| MB = $56.65 |
Most Recent Note - 6/22/2009 9:43:13 PM
G - Weakness under its previously cited pivot point and a violation of its 50 DMA line today raised concerns and triggered a technical sell signal. Last week a worrisome 5-session losing streak and distributional pressure raised concerns. Its color code was changed to green. Detailed analysis was included when recently featured in the June 2009 issue of CANSLIM.net News. Be sure to review the "What to Look Out For" section and entire detailed summary - read here).
>>> The latest Featured Stock Update with an annotated graph appeared on 6/17/2009. click here.
|
|
C
A
S
I |
News |
Chart |
SEC
View all notes Alert
me of new notes
Company
Profile
|
SYNA
- NASDAQ
Synaptics Inc
COMPUTER SOFTWARE & SERVICES - Information Technology Service
|
$36.76
|
N/A
|
N/A
N/A
|
5/18/2009
(Date
Featured) |
$32.58
(Price
Featured) |
PP = $34.52 |
G |
| MB = $36.25 |
Most Recent Note - 6/22/2009 9:06:00 PM
G - Gapped down today for a considerable loss, yet volume was below average. Consolidating above its August 2008 chart highs ($36), its 50 DMA line, and recent chart highs that define an important support level. First featured in yellow in the May 18, 2009 mid-day report (read here). The number of top-rated funds owning its shares rose from 123 in June '08 to 194 in March '09, which is good news concerning the I criteria. Its annual earnings (the A criteria) history showed a dowturn in 2006, leaving concerns, but it followed that up with strong growth the next 2 years. Its small supply of shares (the S criteria) outstanding could contribute to especially great volatility in the event of institutional accumulation or distribution.
>>> The latest Featured Stock Update with an annotated graph appeared on 6/15/2009. click here.
|
|
C
A
S
I |
News |
Chart |
SEC
View all notes Alert
me of new notes
Company
Profile
|
TNDM
- NASDAQ
Tandem Diabetes Care Inc
TELECOMMUNICATIONS - Wireless Communications
|
$28.73
|
N/A
|
N/A
N/A
|
3/2/2009
(Date
Featured) |
$18.89
(Price
Featured) |
PP = $29.85 |
G |
| MB = $31.34 |
Most Recent Note - 6/22/2009 9:07:49 PM
G - Consolidating after its recent rebound above its 50 DMA line. A sound base needs to form before new buying efforts might be justified under the investment system's guidelines. It traded up as much as +72.42% since first featured at $18.89 in the 3/02/09 Mid-Day BreakOuts Report (read here).
>>> The latest Featured Stock Update with an annotated graph appeared on 6/10/2009. click here.
|
|
C
A
S
I |
News |
Chart |
SEC
View all notes Alert
me of new notes
Company
Profile
|
|
|
|
THESE ARE NOT BUY RECOMMENDATIONS!
Comments contained in the body of this report are technical
opinions only. The material herein has been obtained
from sources believed to be reliable and accurate, however,
its accuracy and completeness cannot be guaranteed.
This site is not an investment advisor, hence it does
not endorse or recommend any securities or other investments.
Any recommendation contained in this report may not
be suitable for all investors and it is not to be deemed
an offer or solicitation on our part with respect to
the purchase or sale of any securities. All trademarks,
service marks and trade names appearing in this report
are the property of their respective owners, and are
likewise used for identification purposes only.
This report is a service available
only to active Paid Premium Members.
You may opt-out of receiving report notifications
at any time. Questions or comments may be submitted
by writing to Premium Membership Services 665 S.E. 10 Street, Suite 201 Deerfield Beach, FL 33441-5634 or by calling 1-800-965-8307
or 954-785-1121.
|
|
|


