You are not logged in.
This means you
CAN ONLY VIEW reports that were published prior to Monday, April 14, 2025.
You
MUST UPGRADE YOUR MEMBERSHIP if you want to see any current reports.
AFTER MARKET UPDATE - FRIDAY, JUNE 21ST, 2013
Previous After Market Report Next After Market Report >>>
|
|
|
|
DOW |
+41.08 |
14,799.40 |
+0.28% |
|
Volume |
2,009,458,570 |
+88% |
|
Volume |
2,679,131,470 |
+36% |
|
NASDAQ |
-7.38 |
3,357.25 |
-0.22% |
|
Advancers |
1,536 |
49% |
|
Advancers |
1,486 |
57% |
|
S&P 500 |
+4.24 |
1,592.43 |
+0.27% |
|
Decliners |
1,518 |
48% |
|
Decliners |
1,016 |
39% |
|
Russell 2000 |
+3.16 |
963.68 |
+0.33% |
|
52 Wk Highs |
31 |
|
|
52 Wk Highs |
49 |
|
|
S&P 600 |
+2.16 |
543.27 |
+0.40% |
|
52 Wk Lows |
267 |
|
|
52 Wk Lows |
75 |
|
|
 |
Indices Halt Slide Following Damaging Losses This Week
Kenneth J. Gruneisen - Passed the CAN SLIM® Master's Exam
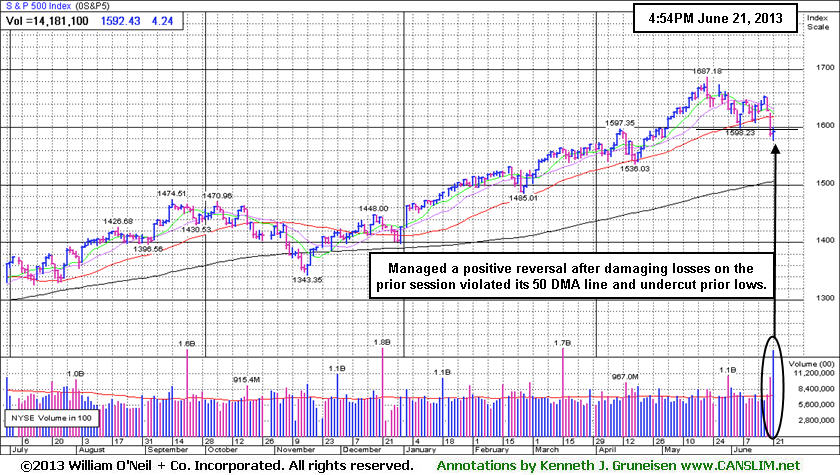
For the week, the Dow Jones Industrial Average was down -1.8%, the S&P 500 Index lost almost -2.1% and the Nasdaq Composite Index fell -1.9%. The indices ended Friday's trading session mixed, with the Dow Jones Industrial Average and S&P 500 Index managing positive reversals - trying to halt their slide after damaging losses violated their recent lows and also their respective 50-day moving average (DMA) lines. Friday's volume totals were reported higher than the prior session totals on the NYSE and on the Nasdaq exchange. Breadth was positive as advancers led decliners by a 7-5 margin on the Nasdaq exchange while the the totals were nearly even on the NYSE. There were 9 high-ranked companies from the CANSLIM.net Leaders List made new 52-week highs and appeared on the CANSLIM.net BreakOuts Page, up from the prior session total of 3 stocks, but a far cry from the total of 72 on Tuesday. Stocks hitting new 52-lows again outnumbered new 52-week highs on both the NYSE and the Nasdaq exchange, whereas new highs had consistently trounced new lows on both exchanges in recent months. There were only 3 gains among the 11 high-ranked companies currently included on the Featured Stocks Page.
Stocks toggled between gains and losses throughout the session as investors continued to digest Fed Chairman Bernanke's comments from earlier in the week. Seven of the 10 sectors on the S&P finished higher led by gains in consumer stocks as Procter & Gamble (PG +2.90%) led the space. On the earnings front, Oracle Corp (ORCL -9.26%) fell following a weaker-than-expected profit tally. Darden Restaurants (DRI -2.17%) was also lower after the company posted earnings that missed analysts' estimates.
Turning to fixed income markets, Treasuries were lower along the curve. The benchmark 10-year note was off nearly a full point to yield 2.54% and the 30-year bond gave up over a full point to yield 3.59%.
The market (M criteria) weakness has been noted as a "correction" and this commentary has repeatedly reminded members - "Be protective of any gains, and limit losses! Be especially watchful for any individual issues flashing technical sell signals. It is vitally important to your success with the fact-based investment system to reduce exposure and preserve cash during market downdrafts."
There is a need for caution until a follow-through day of meaningful gains from at least one of the major averages on higher volume coupled with an expansion in leadership (stocks hitting new 52-week highs). Watch upcoming CANSLIM.net reports and especially the bold portion for us to observe any noteworthy shifts in the market direction (M criteria).
Individual leaders best matching the winning models of the fact-based investment system are on the Featured Stocks Page - with our Certified experts' latest notes and links to additional resources including detailed analysis with annotated graphs. The Premium Member Homepage - includes "dynamic archives" to all prior pay reports published. Watch for an announcement via email concerning the next WEBCAST.
PICTURED: The S&P 500 Index violated its 50-day moving average (DMA) line and prior lows on the prior session, yet managed a "positive reversal" for a gain on heavier volume to end the week on an encouraging note.
|
 Kenneth J. Gruneisen started out as a licensed stockbroker in August 1987, a couple of months prior to the historic stock market crash that took the Dow Jones Industrial Average down -22.6% in a single day. He has published daily fact-based fundamental and technical analysis on high-ranked stocks online for two decades. Through FACTBASEDINVESTING.COM, Kenneth provides educational articles, news, market commentary, and other information regarding proven investment systems that work in good times and bad.
Comments contained in the body of this report are technical opinions only and are not necessarily those of Gruneisen Growth Corp. The material herein has been obtained from sources believed to be reliable and accurate, however, its accuracy and completeness cannot be guaranteed. Our firm, employees, and customers may effect transactions, including transactions contrary to any recommendation herein, or have positions in the securities mentioned herein or options with respect thereto. Any recommendation contained in this report may not be suitable for all investors and it is not to be deemed an offer or solicitation on our part with respect to the purchase or sale of any securities. |
|
 |
Defensive Groups Led Friday's Gainers
Kenneth J. Gruneisen - Passed the CAN SLIM® Master's Exam
Defensive groups were the leading gainers on Friday as the Healthcare Index ($HMO +1.03%) and the Gold & Silver Index ($XAU +1.33%) bounced. The Retail Index ($RLX +0.02%) finished flat and the Broker/Dealer Index ($XBD +0.15%) and Bank Index ($BKX +0.28%) eked out small gains. The Semiconductor Index ($SOX +0.25%) and the Biotechnology Index ($BTK +0.57%) posted modest gains while the Internet Index ($IIX -0.21%) and the Networking Index ($NWX -0.09%) edged lower. Energy-related shares were quiet as the Oil Services Index ($OSX -0.06%) and Integrated Oil Index ($XOI +0.03%) finished virtually unchanged.
Charts courtesy www.stockcharts.com
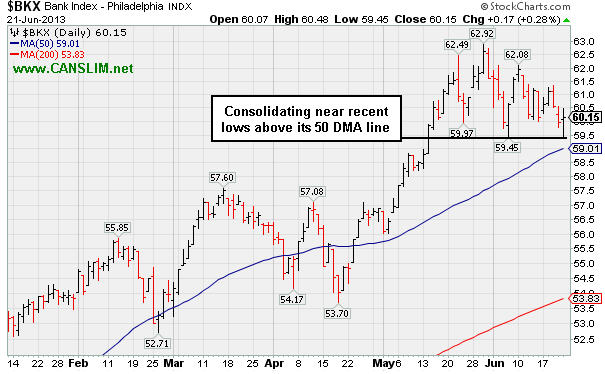
PICTURED: The Bank Index ($BKX +0.28%) is consolidating near recent lows and above its 50-day moving average (DMA) line.
| Oil Services |
$OSX |
251.21 |
-0.14 |
-0.06% |
+14.10% |
| Healthcare |
$HMO |
3,131.58 |
+32.02 |
+1.03% |
+24.56% |
| Integrated Oil |
$XOI |
1,322.93 |
+0.35 |
+0.03% |
+6.53% |
| Semiconductor |
$SOX |
460.85 |
+1.13 |
+0.25% |
+19.99% |
| Networking |
$NWX |
260.51 |
-0.23 |
-0.09% |
+14.99% |
| Internet |
$IIX |
374.22 |
-0.78 |
-0.21% |
+14.44% |
| Broker/Dealer |
$XBD |
124.24 |
+0.18 |
+0.15% |
+31.71% |
| Retail |
$RLX |
772.91 |
+0.16 |
+0.02% |
+18.35% |
| Gold & Silver |
$XAU |
91.41 |
+1.20 |
+1.33% |
-44.80% |
| Bank |
$BKX |
60.15 |
+0.17 |
+0.28% |
+17.30% |
| Biotech |
$BTK |
1,862.72 |
+10.53 |
+0.57% |
+20.41% |
|
|
|
 |
Perched Near 52-Week High Enduring Distributional Pressure
Kenneth J. Gruneisen - Passed the CAN SLIM® Master's Exam
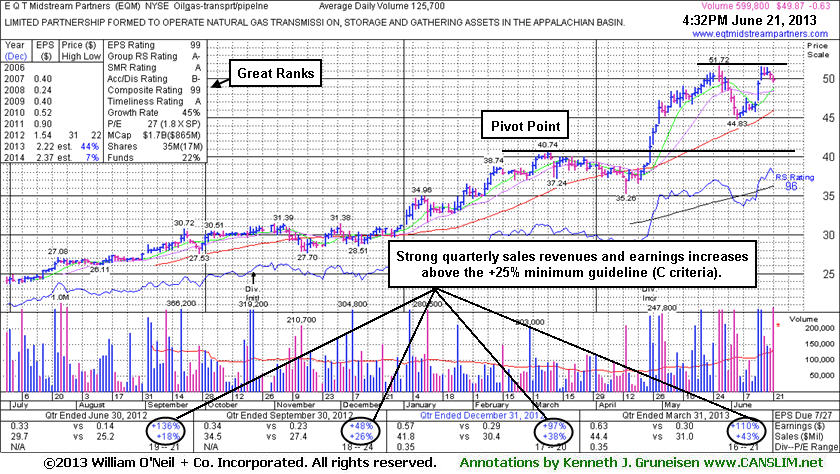
E Q T Midstream Partners (EQM -$0.63 or -1.25% to $49.87) ended with a loss on above average volume, encountering distributional pressure after challenging its 52-week high this week. The recent low and its 50-day moving average (DMA) line define important near-term support in the $45 area. There was a "negative reversal" on 5/28/13 at its 52-week high. Having rallied more than +20% in the first 2-3 weeks after its breakout, the investment system rules suggested holding such winners for a minimum of 8 weeks. This rule is because many of the investment system's biggest winners and best examples among the winning models were those companies that had tallied big gains shortly after their breakouts, then went on to produce dramatic gains. It has been more than 8 weeks since its 4/25/13 breakout now, and it remains in healthy shape, however more damaging losses and subsequent weakness in the broader market may prompt investors into selling and protecting their hard fought gains.
EQM was last shown in this FSU section on 6/06/13 with an annotated graph under the headline, "Retreating Toward 10-Week Moving Average", after 4 consecutive losses and clear signs of distributional pressure. Based on the prior analysis a valid secondary buy point arguably exists from its successful test of support at the 10 WMA line, up to as much as +5% above the latest high ($51.72 X 1.05 = $54.31). However, all new buying efforts are off since the major averages fell into an ugly correction, since 3 out of 4 stocks follow the direction of the major averages (M criteria).
This MLP in the Natural Gas business reported strong results for the Mar '13 quarter, and quarterly earnings increases above the +25% minimum guideline (C criteria). Accelerating sales revenues increases are very reassuring, as its sales revenues increased by +18%, +26%, +38%, and +43% in the Jun, Sep, Dec '12 and Mar '13 quarters versus the year-ago periods, respectively. The number of top-rated funds owning its shares rose from 20 in Jun '12 to 38 in Mar '13, a reassuring sign concerning the I criteria.
|
|
|
Color Codes Explained :
Y - Better candidates highlighted by our
staff of experts.
G - Previously featured
in past reports as yellow but may no longer be buyable under the
guidelines.
***Last / Change / Volume data in this table is the closing quote data***
Symbol/Exchange
Company Name
Industry Group |
PRICE |
CHANGE
(%Change) |
Day High |
Volume
(% DAV)
(% 50 day avg vol) |
52 Wk Hi
% From Hi |
Featured
Date |
Price
Featured |
Pivot Featured |
|
Max Buy |
AL
-
NYSE
Air Lease Corp Cl A
DIVERSIFIED SERVICES - Rental and Leasing Services
|
$26.45
|
-0.54
-2.00% |
$27.18
|
728,900
131.78% of 50 DAV
50 DAV is 553,100
|
$31.00
-14.68%
|
5/9/2013
|
$30.95
|
PP = $29.38
|
|
MB = $30.85
|
 Most Recent Note - 6/21/2013 4:14:04 PM
Slumped further below its 50 DMA line with a loss on average volume. A rebound above its 50 DMA line is needed for its technical stance and outlook to improve. Completed a Secondary Offering on 5/31/13. The prior low ($25.47 on 4/25/13) defines near term support above its 200 DMA line. Due to weak action it will be dropped from the Featured Stocks list.
>>> The latest Featured Stock Update with an annotated graph appeared on 6/17/2013. Click here.
View all notes |
Alert me of new notes |
CANSLIM.net Company Profile |
SEC |
Zacks Reports |
StockTalk |
News |
Chart |
Request a new note
C
A N
S L
I M


|
AMBA
-
NASDAQ
Ambarella Inc
ELECTRONICS - Semiconductor - Specialized
|
$17.07
|
+0.14
0.83% |
$17.33
|
1,161,249
109.22% of 50 DAV
50 DAV is 1,063,200
|
$18.58
-8.13%
|
5/6/2013
|
$15.31
|
PP = $16.10
|
|
MB = $16.91
|
Most Recent Note - 6/20/2013 5:22:02 PM
G - Retreated from its 52-week high with a 2nd loss on above average volume in the span of 3 sessions. Recent lows and its 50 DMA line ($15.11 now) define important chart support to watch on pullbacks.
>>> The latest Featured Stock Update with an annotated graph appeared on 6/14/2013. Click here.
View all notes |
Alert me of new notes |
CANSLIM.net Company Profile |
SEC |
Zacks Reports |
StockTalk |
News |
Chart |
Request a new note
C
A N
S L
I M
|
EQM
-
NYSE
E Q T Midstream Partners
ENERGY - Oil and Gas Pipelines
|
$49.87
|
-0.63
-1.25% |
$50.46
|
604,049
480.55% of 50 DAV
50 DAV is 125,700
|
$51.72
-3.58%
|
4/25/2013
|
$40.16
|
PP = $40.84
|
|
MB = $42.88
|
Most Recent Note - 6/21/2013 4:56:24 PM
G - Encountered distributional pressure and ended with a loss with above average volume after challenging its 52-week high this week. Recent low and its 50 DMA line define important near-term support in the $45 area. See the latest FSU analysis for more details and a new annotated graph.
>>> The latest Featured Stock Update with an annotated graph appeared on 6/21/2013. Click here.
View all notes |
Alert me of new notes |
CANSLIM.net Company Profile |
SEC |
Zacks Reports |
StockTalk |
News |
Chart |
Request a new note
C
A N
S L
I M
|
FLT
-
NYSE
Fleetcor Technologies
DIVERSIFIED SERVICES - Business/Management Services
|
$83.80
|
-0.14
-0.17% |
$84.54
|
2,778,458
326.53% of 50 DAV
50 DAV is 850,900
|
$89.75
-6.63%
|
5/29/2013
|
$86.02
|
PP = $85.66
|
|
MB = $89.94
|
Most Recent Note - 6/20/2013 7:52:37 PM
Y- Fell with above average volume today, slumping below its pivot point and toward its 50 DMA line ($81.64) defining important near-term chart support. See the latest FSU analysis for more details and an annotated graph.
>>> The latest Featured Stock Update with an annotated graph appeared on 6/18/2013. Click here.
View all notes |
Alert me of new notes |
CANSLIM.net Company Profile |
SEC |
Zacks Reports |
StockTalk |
News |
Chart |
Request a new note
C
A N
S L
I M
|
LOPE
-
NASDAQ
Grand Canyon Education
DIVERSIFIED SERVICES - Education and; Training Services
|
$31.32
|
-0.31
-0.98% |
$32.25
|
428,079
110.44% of 50 DAV
50 DAV is 387,600
|
$34.07
-8.07%
|
6/19/2013
|
$31.47
|
PP = $34.17
|
|
MB = $35.88
|
Most Recent Note - 6/19/2013 8:23:07 PM
Y - Color code is changed to yellow with a new pivot point cited based on its 5/22/13 high plus 10 cents. Subsequent volume driven gains above its pivot point may trigger a new technical buy signal. Consolidating above its 50 DMA line and well above additional support at prior highs in the $27 area. See the latest FSU analysis for more details and a new annotated graph.
>>> The latest Featured Stock Update with an annotated graph appeared on 6/19/2013. Click here.
View all notes |
Alert me of new notes |
CANSLIM.net Company Profile |
SEC |
Zacks Reports |
StockTalk |
News |
Chart |
Request a new note
C
A N
S L
I M
|
Symbol/Exchange
Company Name
Industry Group |
PRICE |
CHANGE
(%Change) |
Day High |
Volume
(% DAV)
(% 50 day avg vol) |
52 Wk Hi
% From Hi |
Featured
Date |
Price
Featured |
Pivot Featured |
|
Max Buy |
MRLN
-
NASDAQ
Marlin Business Services
DIVERSIFIED SERVICES - Rental and Leasing Services
|
$21.32
|
-0.65
-2.96% |
$22.12
|
97,198
393.51% of 50 DAV
50 DAV is 24,700
|
$25.97
-17.91%
|
3/15/2013
|
$22.29
|
PP = $23.18
|
|
MB = $24.34
|
Most Recent Note - 6/21/2013 4:10:34 PM
Slumped under its recent low ($21.49 on 5/23/13) today raising concerns. Tested its 200 DMA line ($20.80) which defines very important near-term support. A rebound above its 50 DMA line is needed for its technical stance and outlook to improve. Its Relative Strength rating has slumped to 73, below the 80+ guideline for buy candidates. It will be dropped from the Featured Stocks list tonight.
>>> The latest Featured Stock Update with an annotated graph appeared on 6/11/2013. Click here.
View all notes |
Alert me of new notes |
CANSLIM.net Company Profile |
SEC |
Zacks Reports |
StockTalk |
News |
Chart |
Request a new note
C
A N
S L
I M
|
NSM
-
NYSE
Nationstar Mtg Hldgs Inc
FINANCIAL SERVICES - Credit Services
|
$37.27
|
-2.69
-6.73% |
$40.26
|
2,774,757
226.79% of 50 DAV
50 DAV is 1,223,500
|
$46.91
-20.55%
|
5/7/2013
|
$39.71
|
PP = $42.34
|
|
MB = $44.46
|
Most Recent Note - 6/21/2013 4:17:12 PM
Violated its 50 DMA line with today's damaging loss on heavy volume triggering a technical sell signal. Also violated the prior low ($39.22 on 5/29/13) raising more serious concerns. A prompt rebound above its 50 DMA line is needed for its technical stance and outlook to improve. Due to weak action it has fallen -20% from its 52-week high and it will be dropped from the Featured Stocks list tonight.
>>> The latest Featured Stock Update with an annotated graph appeared on 6/13/2013. Click here.
View all notes |
Alert me of new notes |
CANSLIM.net Company Profile |
SEC |
Zacks Reports |
StockTalk |
News |
Chart |
Request a new note
C
A N
S L
I M
|
PRAA
-
NASDAQ
Portfolio Recovery Assoc
DIVERSIFIED SERVICES - Business/Management Services
|
$159.73
|
+3.03
1.93% |
$160.20
|
197,682
262.53% of 50 DAV
50 DAV is 75,300
|
$163.87
-2.53%
|
5/1/2013
|
$130.77
|
PP = $127.88
|
|
MB = $134.27
|
Most Recent Note - 6/21/2013 4:06:34 PM
G - Tallying a gain backed by above average volume. Perched at its all-time high, extended from any sound base, it has rallied with no resistance due to overhead supply. Its 50 DMA line ($141.97 now) defines important near-term chart support.
>>> The latest Featured Stock Update with an annotated graph appeared on 6/10/2013. Click here.
View all notes |
Alert me of new notes |
CANSLIM.net Company Profile |
SEC |
Zacks Reports |
StockTalk |
News |
Chart |
Request a new note
C
A N
S L
I M
|
PRLB
-
NYSE
Proto Labs Inc
MANUFACTURING - Small Tools and Accessories
|
$60.00
|
-1.01
-1.66% |
$62.18
|
655,153
121.46% of 50 DAV
50 DAV is 539,400
|
$65.12
-7.86%
|
6/17/2013
|
$59.37
|
PP = $59.94
|
|
MB = $62.94
|
Most Recent Note - 6/20/2013 7:57:07 PM
Y- Volume-driven gains earlier this week helped it rally above its pivot point triggering a new (or add-on) technical buy signal. Prior highs define initial support to watch, while any close below its old high close ($59.13 on 5/10/13) would raise concerns and completely negate the prior technical breakout.
>>> The latest Featured Stock Update with an annotated graph appeared on 6/12/2013. Click here.
View all notes |
Alert me of new notes |
CANSLIM.net Company Profile |
SEC |
Zacks Reports |
StockTalk |
News |
Chart |
Request a new note
C
A N
S L
I M
|
RRTS
-
NYSE
Roadrunner Trans Systems
TRANSPORTATION - Air Delivery and Freight Service
|
$26.55
|
-0.75
-2.75% |
$27.38
|
257,242
124.81% of 50 DAV
50 DAV is 206,100
|
$29.52
-10.06%
|
4/3/2013
|
$22.77
|
PP = $23.75
|
|
MB = $24.94
|
Most Recent Note - 6/20/2013 7:49:35 PM
G - Followed a "negative reversal" at its 52-week high with 3 losses on lighter volume. Fundamental concerns were raised by its sub par earnings increase in the Mar '13 quarter. See the latest FSU analysis for more details and a new annotated graph.
>>> The latest Featured Stock Update with an annotated graph appeared on 6/20/2013. Click here.
View all notes |
Alert me of new notes |
CANSLIM.net Company Profile |
SEC |
Zacks Reports |
StockTalk |
News |
Chart |
Request a new note
C
A N
S L
I M
|
Symbol/Exchange
Company Name
Industry Group |
PRICE |
CHANGE
(%Change) |
Day High |
Volume
(% DAV)
(% 50 day avg vol) |
52 Wk Hi
% From Hi |
Featured
Date |
Price
Featured |
Pivot Featured |
|
Max Buy |
VRX
-
NYSE
Valeant Pharmaceuticals
DRUGS - Drug Manufacturers - Other
|
$84.42
|
+0.58
0.69% |
$84.61
|
2,561,290
133.40% of 50 DAV
50 DAV is 1,920,000
|
$96.25
-12.29%
|
4/30/2013
|
$60.24
|
PP = $76.66
|
|
MB = $80.49
|
Most Recent Note - 6/20/2013 8:09:26 PM
G- Completed a new Public Offering on 6/18/13. Concerns were raised by its sub par Mar '13 earnings report, however mostly bullish action has followed. Its 50 DMA line ($78.95) defines near-term support above prior highs in the $76 area.
>>> The latest Featured Stock Update with an annotated graph appeared on 6/7/2013. Click here.
View all notes |
Alert me of new notes |
CANSLIM.net Company Profile |
SEC |
Zacks Reports |
StockTalk |
News |
Chart |
Request a new note
C
A N
S L
I M
|
|
|
|
THESE ARE NOT BUY RECOMMENDATIONS!
Comments contained in the body of this report are technical
opinions only. The material herein has been obtained
from sources believed to be reliable and accurate, however,
its accuracy and completeness cannot be guaranteed.
This site is not an investment advisor, hence it does
not endorse or recommend any securities or other investments.
Any recommendation contained in this report may not
be suitable for all investors and it is not to be deemed
an offer or solicitation on our part with respect to
the purchase or sale of any securities. All trademarks,
service marks and trade names appearing in this report
are the property of their respective owners, and are
likewise used for identification purposes only.
This report is a service available
only to active Paid Premium Members.
You may opt-out of receiving report notifications
at any time. Questions or comments may be submitted
by writing to Premium Membership Services 665 S.E. 10 Street, Suite 201 Deerfield Beach, FL 33441-5634 or by calling 1-800-965-8307
or 954-785-1121.
|
|
|

