You are not logged in.
This means you
CAN ONLY VIEW reports that were published prior to Monday, April 14, 2025.
You
MUST UPGRADE YOUR MEMBERSHIP if you want to see any current reports.
AFTER MARKET UPDATE - THURSDAY, JUNE 21ST, 2012
Previous After Market Report Next After Market Report >>>
|
|
|
|
DOW |
-250.82 |
12,573.57 |
-1.96% |
|
Volume |
865,865,250 |
+15% |
|
Volume |
1,731,219,960 |
+14% |
|
NASDAQ |
-71.36 |
2,859.09 |
-2.44% |
|
Advancers |
573 |
18% |
|
Advancers |
517 |
20% |
|
S&P 500 |
-30.18 |
1,325.51 |
-2.23% |
|
Decliners |
2,549 |
79% |
|
Decliners |
1,976 |
76% |
|
Russell 2000 |
-19.22 |
764.83 |
-2.45% |
|
52 Wk Highs |
61 |
|
|
52 Wk Highs |
43 |
|
|
S&P 600 |
-11.15 |
425.83 |
-2.55% |
|
52 Wk Lows |
39 |
|
|
52 Wk Lows |
44 |
|
|
 |
Indices' Losses Led to Retreat Below 50-Day Averages
Kenneth J. Gruneisen - Passed the CAN SLIM® Master's Exam
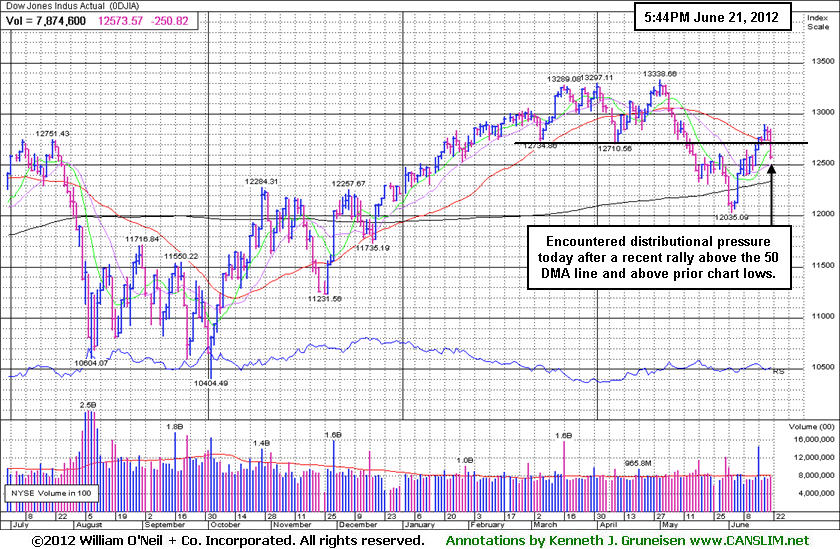
The major averages suffered damaging losses and closed near their session lows on Thursday as fears of an economic slowdown intensified after a batch of disappointing economic data.. The volume totals were reported higher than the prior session totals on the Nasdaq exchange and on the NYSE, a sign that institutional investors were unloading stocks. Decliners led advancers by almost a 4-1 margin on both the NYSE and on the Nasdaq exchange. The total number of new 52-week highs exceeded new 52-week lows on the NYSE, however the new high/low totals were nearly even on the Nasdaq exchange. There were 22 high-ranked companies from the CANSLIM.net Leaders List made new 52-week highs and appeared on the CANSLIM.net BreakOuts Page, down from the prior session total of 46 stocks. At the session's close there were unanimous losses for all of the 16 high-ranked companies currently included on the Featured Stocks Page.
Global manufacturing reports were weak. The Philadelphia Fed Index fell to its lowest level since last August, while euro-area manufacturing shrank at the fastest pace in three years and a gauge for China showed output contracted for an eighth straight month. In separate reports, existing home sales declined in May by -1.5% and the four-week moving average for jobless claims came in at its highest level since December 2011.
A sell-off in commodities led to large losses in materials and energy stocks. In turn, Alcoa Inc (AA -4.15%) and Chevron Corp (CVX -3.48%) fell. In other action, Bed Bath & Beyond Inc (BBBY -16.7%) hit a two-year low following a downbeat earnings forecast. Red Hat Inc (RHT -6.19%) also fell after it gave a disappointing forecast and reported weaker-than-expected billings, a key revenue indicator. CarMax Inc (KMX -7.24%) fell after the used car dealership chain reported a -4% drop in its first-quarter profit due to lackluster sales and profit margins.
In bondland, Treasury prices were higher with the 10-year note up 11/32 to yield 1.62% and the 30-year bond gained a full point to yield 2.69%.
Technically, the major averages' (M criteria) current rally allows fact-based investors to make new buying efforts in sound buy candidates near proper entry points only. As always, disciplined investors limit losses if any stock ever falls more than -7% from its purchase price.
The Q2 2012 Webcast is scheduled for Wednesday, June 27th at 8PM EST and will be available "ON DEMAND" afterward. All who have the UPGRADED membership now get access to these informative *Quarterly Webcasts included at no additional cost. (*Previously sold separately at $99 per webcast.) Links to archived webcasts and all prior reports are on the Premium Member Homepage. Please use the inquiry form to submit any questions that you would like to see answered in the upcoming webcast or to make any suggestions or comments about our website and services. Thank you!
PICTURED: The Dow Jones Industrial Average slumped below its downward sloping 50-day moving average (DMA) along with the other major averages (not shown) on Thursday, hurting the rally. Additional distributional action could quickly quash the recently confirmed rally.
|
 Kenneth J. Gruneisen started out as a licensed stockbroker in August 1987, a couple of months prior to the historic stock market crash that took the Dow Jones Industrial Average down -22.6% in a single day. He has published daily fact-based fundamental and technical analysis on high-ranked stocks online for two decades. Through FACTBASEDINVESTING.COM, Kenneth provides educational articles, news, market commentary, and other information regarding proven investment systems that work in good times and bad.
Comments contained in the body of this report are technical opinions only and are not necessarily those of Gruneisen Growth Corp. The material herein has been obtained from sources believed to be reliable and accurate, however, its accuracy and completeness cannot be guaranteed. Our firm, employees, and customers may effect transactions, including transactions contrary to any recommendation herein, or have positions in the securities mentioned herein or options with respect thereto. Any recommendation contained in this report may not be suitable for all investors and it is not to be deemed an offer or solicitation on our part with respect to the purchase or sale of any securities. |
|
 |
Commodity-Linked, Tech, Retail, and Financial Groups Fell
Kenneth J. Gruneisen - Passed the CAN SLIM® Master's Exam
Commodity-linked groups led the market lower as the Gold & Silver Index ($XAU -5.51%), Oil Services Index ($OSX -5.41%), and Integrated Oil Index ($XOI -4.21%) were hit with large losses. The Semiconductor Index ($SOX -4.09%) led the tech sector's retreat while the Networking Index ($NWX -3.55%), Internet Index ($IIX -2.90%), and the Biotechnology Index ($BTK -2.04%) ended unanimously lower. Weakness in the Retail Index ($RLX -3.00%) and losses in the influential financial group weighed on the major averages as the Broker/Dealer Index ($XBD -3.25%) and Bank Index ($BKX -2.33%) were also smacked with big losses. The Healthcare Index ($HMO -1.42%) was a standout with the least significant loss among the industry groups routinely followed in this section.
Charts courtesy www.stockcharts.com
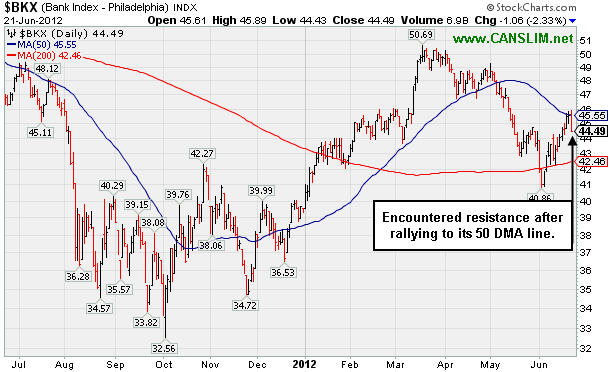
PICTURED 1: The Bank Index ($BKX -2.33%) encountered resistance after rallying to its 50-day moving average (DMA) line.
Charts courtesy www.stockcharts.com
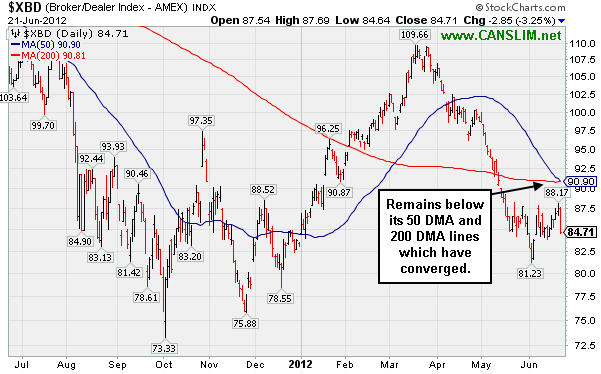
PICTURED 2: The Broker/Dealer Index ($XBD -3.25%) remains below its 50 and 200 DMA lines which have converged.
| Oil Services |
$OSX |
192.88 |
-11.03 |
-5.41% |
-10.82% |
| Healthcare |
$HMO |
2,241.88 |
-32.22 |
-1.42% |
-1.74% |
| Integrated Oil |
$XOI |
1,106.85 |
-48.68 |
-4.21% |
-9.95% |
| Semiconductor |
$SOX |
372.71 |
-15.88 |
-4.09% |
+2.27% |
| Networking |
$NWX |
207.85 |
-7.66 |
-3.55% |
-3.40% |
| Internet |
$IIX |
294.58 |
-8.79 |
-2.90% |
+4.56% |
| Broker/Dealer |
$XBD |
84.71 |
-2.85 |
-3.25% |
+1.73% |
| Retail |
$RLX |
605.57 |
-18.74 |
-3.00% |
+15.74% |
| Gold & Silver |
$XAU |
157.04 |
-9.15 |
-5.51% |
-13.06% |
| Bank |
$BKX |
44.49 |
-1.06 |
-2.33% |
+12.98% |
| Biotech |
$BTK |
1,436.82 |
-29.89 |
-2.04% |
+31.65% |
|
|
|
 |
Heavy Volume on Loss After Analyst Downgrade
Kenneth J. Gruneisen - Passed the CAN SLIM® Master's Exam
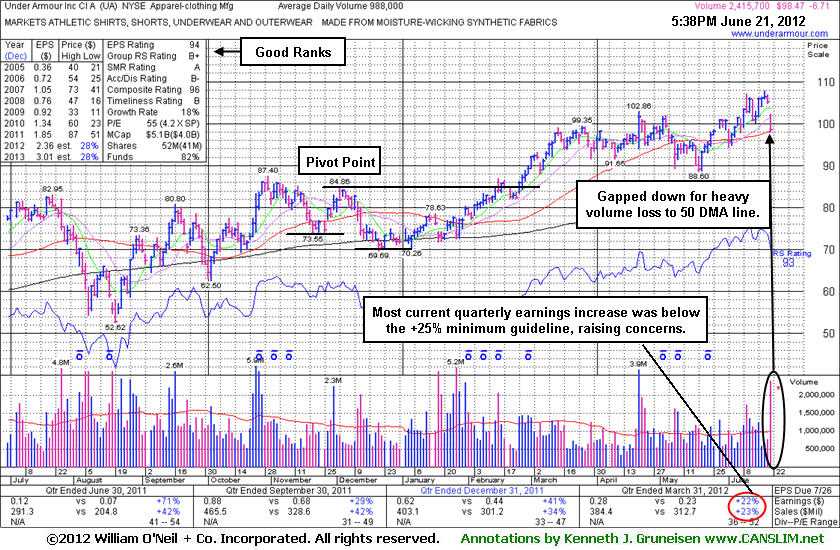
Under Armour Inc (UA -$6.71 or -6.38% to $98.47) fell to its 50-day moving average (DMA) line today with a damaging loss on heavy volume after a gap down following an analyst downgrade. It recently wedged to new 52-week highs without especially great volume conviction behind its gains. Subsequent deterioration may result in it being noted and dropped from the Featured Stocks list, however it may likely find support above its prior "double bottom" base. Its previously cited pivot point is illustrated on the graph below.
It was last shown in this FSU section on 5/29/12 with an annotated graph under the headline, "Apparel Firm Raised Fundamental Concerns With Sub Par Quarter ", as it posted a 6th consecutive gain. Afterward it found support near its 50 DMA line on a brief pullback and then it rose to new 52-week high territory. However, concerns were recently raised by weaker fundamentals in the Mar '12 period, its first quarterly earnings increase below the +25% minimum guideline in more than 2 years. Otherwise, a new pivot point might have been cited based on its recent resilience. The current quarter ends next Friday, and as it approaches its Jun '12 quarterly earnings release the price/volume action may give traders a hint at whether stronger or weaker earnings are coming.
The high-ranked Apparel - Clothing Manufacturing firm has seen the number of top-rated funds owning its shares rise from 367 in Jun '11 to 447 in Mar '12, a reassuring trend concerning the I criteria.
|
|
|
Color Codes Explained :
Y - Better candidates highlighted by our
staff of experts.
G - Previously featured
in past reports as yellow but may no longer be buyable under the
guidelines.
***Last / Change / Volume data in this table is the closing quote data***
Symbol/Exchange
Company Name
Industry Group |
PRICE |
CHANGE
(%Change) |
Day High |
Volume
(% DAV)
(% 50 day avg vol) |
52 Wk Hi
% From Hi |
Featured
Date |
Price
Featured |
Pivot Featured |
|
Max Buy |
ALXN
-
NASDAQ
Alexion Pharmaceuticals
DRUGS - Drug Manufacturers - Other
|
$94.99
|
-2.83
-2.89% |
$98.87
|
1,811,558
85.00% of 50 DAV
50 DAV is 2,131,200
|
$99.41
-4.45%
|
5/1/2012
|
$91.73
|
PP = $95.11
|
|
MB = $99.87
|
Most Recent Note - 6/19/2012 10:10:54 AM
Y - Gapped up today, clearing resistance in the $94-95 area and rising above its pivot point for a new 52-week high.
>>> The latest Featured Stock Update with an annotated graph appeared on 5/31/2012. Click here.
View all notes |
Alert me of new notes |
CANSLIM.net Company Profile |
SEC |
Zacks Reports |
StockTalk |
News |
Chart |
Request a new note
C
A N
S L
I M


|
ASPS
-
NASDAQ
Altisource Ptf Sltns Sa
REAL ESTATE - Property Management/Developmen
|
$70.35
|
-0.62
-0.87% |
$71.76
|
197,342
140.76% of 50 DAV
50 DAV is 140,200
|
$72.61
-3.11%
|
6/5/2012
|
$60.01
|
PP = $63.00
|
|
MB = $66.15
|
Most Recent Note - 6/19/2012 11:47:50 AM
G - Hitting another new 52-week high today. Prior highs in the $65 area define initial support to watch on pullbacks, meanwhile it is getting extended from its prior base.
>>> The latest Featured Stock Update with an annotated graph appeared on 6/5/2012. Click here.
View all notes |
Alert me of new notes |
CANSLIM.net Company Profile |
SEC |
Zacks Reports |
StockTalk |
News |
Chart |
Request a new note
C
A N
S L
I M
|
CERN
-
NASDAQ
Cerner Corp
COMPUTER SOFTWARE and SERVICES - Healthcare Information Service
|
$79.70
|
-3.81
-4.56% |
$83.58
|
2,648,827
189.05% of 50 DAV
50 DAV is 1,401,100
|
$88.32
-9.76%
|
6/7/2012
|
$78.36
|
PP = $84.20
|
|
MB = $88.41
|
 Most Recent Note - 6/21/2012 11:59:35 AM
Y - Slumping below its pivot point today, raising concerns with above average volume behind a 2nd consecutive loss. Disciplined investors always limit losses if ever a stock falls more than -7% from their purchase price.
>>> The latest Featured Stock Update with an annotated graph appeared on 6/7/2012. Click here.
View all notes |
Alert me of new notes |
CANSLIM.net Company Profile |
SEC |
Zacks Reports |
StockTalk |
News |
Chart |
Request a new note
C
A N
S L
I M
|
CMCSA
-
NASDAQ
Comcast Corp Cl A
MEDIA - CATV Systems
|
$30.68
|
-0.52
-1.65% |
$31.34
|
14,262,107
102.85% of 50 DAV
50 DAV is 13,867,500
|
$31.65
-3.08%
|
6/11/2012
|
$29.94
|
PP = $30.98
|
|
MB = $32.53
|
Most Recent Note - 6/20/2012 1:06:46 PM
Y - Perched at its 52-week high today, holding its ground after 4 consecutive gains. Its gain on 6/15/12 with +55% above average volume while rising above the new pivot point recently cited triggered a technical buy signal. The prior low ($28.09 on 5/21/12) defines important near-term support to watch.
>>> The latest Featured Stock Update with an annotated graph appeared on 6/11/2012. Click here.
View all notes |
Alert me of new notes |
CANSLIM.net Company Profile |
SEC |
Zacks Reports |
StockTalk |
News |
Chart |
Request a new note
C
A N
S L
I M
|
DG
-
NYSE
Dollar General Corp
RETAIL - Discount, Variety Stores
|
$52.38
|
-0.22
-0.42% |
$53.06
|
3,868,838
113.93% of 50 DAV
50 DAV is 3,395,800
|
$52.62
-0.46%
|
5/7/2012
|
$48.51
|
PP = $47.69
|
|
MB = $50.07
|
Most Recent Note - 6/20/2012 1:08:04 PM
G - Inching up today for yet another new all-time high. Completed another Secondary Offering on 6/05/12, its 4th Secondary Offering since September '11.
>>> The latest Featured Stock Update with an annotated graph appeared on 6/12/2012. Click here.
View all notes |
Alert me of new notes |
CANSLIM.net Company Profile |
SEC |
Zacks Reports |
StockTalk |
News |
Chart |
Request a new note
C
A N
S L
I M
|
Symbol/Exchange
Company Name
Industry Group |
PRICE |
CHANGE
(%Change) |
Day High |
Volume
(% DAV)
(% 50 day avg vol) |
52 Wk Hi
% From Hi |
Featured
Date |
Price
Featured |
Pivot Featured |
|
Max Buy |
EXPE
-
NASDAQ
Expedia Inc
INTERNET - Internet Information Providers
|
$47.83
|
-0.12
-0.25% |
$48.81
|
3,600,890
76.59% of 50 DAV
50 DAV is 4,701,500
|
$50.66
-5.59%
|
4/27/2012
|
$41.80
|
PP = $35.57
|
|
MB = $37.35
|
Most Recent Note - 6/20/2012 12:05:32 PM
G - Pulling back from its 52-week high today with a 3rd consecutive loss. It is extended from its prior highs in the $43 area which define initial support above its 50 DMA line.
>>> The latest Featured Stock Update with an annotated graph appeared on 6/8/2012. Click here.
View all notes |
Alert me of new notes |
CANSLIM.net Company Profile |
SEC |
Zacks Reports |
StockTalk |
News |
Chart |
Request a new note
C
A N
S L
I M
|
GNC
-
NYSE
G N C Holdings Inc
RETAIL - Drug Stores
|
$36.48
|
-0.59
-1.59% |
$37.48
|
2,296,058
106.19% of 50 DAV
50 DAV is 2,162,200
|
$41.95
-13.04%
|
1/19/2012
|
$28.99
|
PP = $29.60
|
|
MB = $31.08
|
Most Recent Note - 6/19/2012 10:06:14 AM
G - Rebounding toward its 50 DMA line which may now act as a resistance level. Gains above that short-term average would help its technical stance and improve the outlook.
>>> The latest Featured Stock Update with an annotated graph appeared on 6/6/2012. Click here.
View all notes |
Alert me of new notes |
CANSLIM.net Company Profile |
SEC |
Zacks Reports |
StockTalk |
News |
Chart |
Request a new note
C
A N
S L
I M
|
MLNX
-
NASDAQ
Mellanox Technologies
ELECTRONICS - Semiconductor - Broad Line
|
$66.00
|
-4.59
-6.50% |
$70.98
|
867,241
133.61% of 50 DAV
50 DAV is 649,100
|
$74.27
-11.14%
|
6/18/2012
|
$70.90
|
PP = $67.30
|
|
MB = $70.67
|
Most Recent Note - 6/21/2012 2:47:11 PM
Y - Pulling back today toward its pivot point and prior highs that define initial chart support to watch. Disciplined investors limit losses if ever a stock falls more than -7% from their purchase price. On 6/18/12 it was highlighted in yellow in the mid-day report after it gapped up, rising from an 9-week cup-shaped base without a handle triggering a technical buy signal. Reported earnings +113% on +61% sales revenues for the quarter ended March 31, 2012 versus the year ago period. Its streak of 3 strong quarterly earnings comparisons now satisfies the C criteria. A downturn in FY '09 earnings is a small flaw in its annual earnings (A criteria) history. Gapped up on 4/17/12 for a new all-time high following an analyst upgrade. Top-rated funds owning its shares rose from 108 in Jun '11 to 177 in Mar '12 a reassuring sign concerning the I criteria.

There are no Featured Stock Updates™ available for this stock at this time. You may request one by clicking the Request a New Note link below
View all notes |
Alert me of new notes |
CANSLIM.net Company Profile |
SEC |
Zacks Reports |
StockTalk |
News |
Chart |
Request a new note
C
A N
S L
I M
|
N
-
NYSE
Netsuite Inc
DIVERSIFIED SERVICES - Business/Management Services
|
$51.50
|
-0.81
-1.55% |
$52.59
|
994,698
219.39% of 50 DAV
50 DAV is 453,400
|
$52.79
-2.44%
|
6/20/2012
|
$51.83
|
PP = $51.88
|
|
MB = $54.47
|
Most Recent Note - 6/20/2012 5:51:30 PM
Y - Highlighted in yellow in the mid-day report with new pivot point cited based on its 3/27/12 high plus 10 cents. Today's 5th consecutive gain and strong close above the pivot was backed by +86% above average volume, triggering a technical buy signal. Reported earnings above the +25% guideline in the 3 latest quarterly comparisons through Mar '12. Its annual earnings (A criteria) history improved from losses prior to FY '09. The number of top-rated funds owning its shares rose from 201 in Jun '11 to 268 in Mar '12, a reassuring sign concerning the I criteria. See the latest FSU analysis for more details and a new annotated graph.
>>> The latest Featured Stock Update with an annotated graph appeared on 6/20/2012. Click here.
View all notes |
Alert me of new notes |
CANSLIM.net Company Profile |
SEC |
Zacks Reports |
StockTalk |
News |
Chart |
Request a new note
C
A N
S L
I M
|
NTES
-
NASDAQ
Netease Inc Adr
INTERNET - Internet Information Providers
|
$61.25
|
-1.66
-2.64% |
$63.68
|
540,778
75.47% of 50 DAV
50 DAV is 716,500
|
$65.54
-6.55%
|
3/19/2012
|
$56.18
|
PP = $55.10
|
|
MB = $57.86
|
Most Recent Note - 6/19/2012 4:39:04 PM
G - Rallied today for its best 2012 close with a 4th consecutive gain. Its 50 DMA line defines near-term support and prior lows near the $55 area define the next important chart support to watch where violations may trigger a worrisome technical sell signals. See the latest FSU analysis for more details and a new annotated graph.
>>> The latest Featured Stock Update with an annotated graph appeared on 6/19/2012. Click here.
View all notes |
Alert me of new notes |
CANSLIM.net Company Profile |
SEC |
Zacks Reports |
StockTalk |
News |
Chart |
Request a new note
C
A N
S L
I M
|
Symbol/Exchange
Company Name
Industry Group |
PRICE |
CHANGE
(%Change) |
Day High |
Volume
(% DAV)
(% 50 day avg vol) |
52 Wk Hi
% From Hi |
Featured
Date |
Price
Featured |
Pivot Featured |
|
Max Buy |
SWI
-
NYSE
Solarwinds Inc
COMPUTER SOFTWARE and SERVICES - Application Software
|
$44.13
|
-2.38
-5.12% |
$46.44
|
931,923
94.52% of 50 DAV
50 DAV is 986,000
|
$48.64
-9.27%
|
4/26/2012
|
$45.15
|
PP = $42.32
|
|
MB = $44.44
|
Most Recent Note - 6/21/2012 10:16:14 AM
Y - Consolidating above its 50 DMA line. A valid secondary buy point exists up to +5% above the recent high. The 6/04/11 low ($41.24) defines important support to watch on pullbacks.
>>> The latest Featured Stock Update with an annotated graph appeared on 6/15/2012. Click here.
View all notes |
Alert me of new notes |
CANSLIM.net Company Profile |
SEC |
Zacks Reports |
StockTalk |
News |
Chart |
Request a new note
C
A N
S L
I M
|
SXCI
-
NASDAQ
S X C Health Solutions
COMPUTER SOFTWARE and SERVICES - Healthcare Information Service
|
$93.28
|
-4.38
-4.48% |
$98.93
|
1,163,019
89.00% of 50 DAV
50 DAV is 1,306,700
|
$103.97
-10.28%
|
6/14/2012
|
$94.71
|
PP = $100.60
|
|
MB = $105.63
|
Most Recent Note - 6/21/2012 10:19:02 AM
Y - Holding its ground following a "negative reversal" on 6/19/12 after hitting a new 52-week high, failing to close the session above its pivot point. Its 50 DMA line defines important support for chart readers.
>>> The latest Featured Stock Update with an annotated graph appeared on 6/14/2012. Click here.
View all notes |
Alert me of new notes |
CANSLIM.net Company Profile |
SEC |
Zacks Reports |
StockTalk |
News |
Chart |
Request a new note
C
A N
S L
I M
|
TDG
-
NYSE
Transdigm Group Inc
AEROSPACE/DEFENSE - Aerospace/Defense Products and; Services
|
$127.50
|
-2.31
-1.78% |
$130.28
|
397,377
72.79% of 50 DAV
50 DAV is 545,900
|
$132.69
-3.91%
|
6/18/2012
|
$127.00
|
PP = $132.79
|
|
MB = $139.43
|
Most Recent Note - 6/20/2012 1:22:21 PM
Y - Today's 3rd consecutive gain has it poised for a best ever close and perched within close striking distance of its all-time high. Color code was changed to yellow with new pivot point cited. Subsequent volume-driven gains above the pivot point may trigger a new (or add-on) technical buy signal. Its prior low ($118.43 on 5/18/12) defines the next important near-term chart support level to watch.
>>> The latest Featured Stock Update with an annotated graph appeared on 6/18/2012. Click here.
View all notes |
Alert me of new notes |
CANSLIM.net Company Profile |
SEC |
Zacks Reports |
StockTalk |
News |
Chart |
Request a new note
C
A N
S L
I M
|
UA
-
NYSE
Under Armour Inc Cl A
CONSUMER NON-DURABLES - Textile - Apparel Clothing
|
$98.47
|
-6.71
-6.38% |
$102.26
|
2,417,466
244.68% of 50 DAV
50 DAV is 988,000
|
$107.86
-8.71%
|
2/15/2012
|
$85.77
|
PP = $84.86
|
|
MB = $89.10
|
Most Recent Note - 6/21/2012 6:02:30 PM
G - Fell to its 50 DMA line today with a damaging loss on heavy volume after a gap down following an analyst downgrade. Its recently wedged to new 52-week highs without especially great volume conviction behind its gains. See the latest FSU analysis for additional details and a new annotated graph.
>>> The latest Featured Stock Update with an annotated graph appeared on 6/21/2012. Click here.
View all notes |
Alert me of new notes |
CANSLIM.net Company Profile |
SEC |
Zacks Reports |
StockTalk |
News |
Chart |
Request a new note
C
A N
S L
I M
|
VSI
-
NYSE
Vitamin Shoppe Inc
SPECIALTY RETAIL - Specialty Retail, Other
|
$53.34
|
-1.42
-2.59% |
$55.00
|
342,316
71.01% of 50 DAV
50 DAV is 482,100
|
$55.29
-3.53%
|
4/25/2012
|
$47.77
|
PP = $48.46
|
|
MB = $50.88
|
Most Recent Note - 6/20/2012 1:11:12 PM
Y - Up today for a 4th consecutive gain, poised for a best-ever close. Found support above prior highs in the $48 area and above its 50 DMA line. One may consider a secondary buy point from its successful test of the 10 week average up to +5% above the recent high. Disciplined investors always limit losses by selling if a stock falls more than -7% from their buy price.
>>> The latest Featured Stock Update with an annotated graph appeared on 6/4/2012. Click here.
View all notes |
Alert me of new notes |
CANSLIM.net Company Profile |
SEC |
Zacks Reports |
StockTalk |
News |
Chart |
Request a new note
C
A N
S L
I M
|
Symbol/Exchange
Company Name
Industry Group |
PRICE |
CHANGE
(%Change) |
Day High |
Volume
(% DAV)
(% 50 day avg vol) |
52 Wk Hi
% From Hi |
Featured
Date |
Price
Featured |
Pivot Featured |
|
Max Buy |
WFM
-
NASDAQ
Whole Foods Market Inc
RETAIL - Grocery Stores
|
$94.17
|
-1.97
-2.05% |
$96.79
|
1,720,238
90.16% of 50 DAV
50 DAV is 1,908,000
|
$96.38
-2.29%
|
6/13/2012
|
$89.90
|
PP = $91.60
|
|
MB = $96.18
|
Most Recent Note - 6/20/2012 1:12:47 PM
Y - Inching to another new 52-week high while on track for a 5th consecutive gain today. Its 6/15/12 gain with +72% above average volume confirmed a technical buy signal. No resistance remains due to overhead supply. Its 50 DMA line and prior lows define important near-term support.
>>> The latest Featured Stock Update with an annotated graph appeared on 6/13/2012. Click here.
View all notes |
Alert me of new notes |
CANSLIM.net Company Profile |
SEC |
Zacks Reports |
StockTalk |
News |
Chart |
Request a new note
C
A N
S L
I M
|
|
|
|
THESE ARE NOT BUY RECOMMENDATIONS!
Comments contained in the body of this report are technical
opinions only. The material herein has been obtained
from sources believed to be reliable and accurate, however,
its accuracy and completeness cannot be guaranteed.
This site is not an investment advisor, hence it does
not endorse or recommend any securities or other investments.
Any recommendation contained in this report may not
be suitable for all investors and it is not to be deemed
an offer or solicitation on our part with respect to
the purchase or sale of any securities. All trademarks,
service marks and trade names appearing in this report
are the property of their respective owners, and are
likewise used for identification purposes only.
This report is a service available
only to active Paid Premium Members.
You may opt-out of receiving report notifications
at any time. Questions or comments may be submitted
by writing to Premium Membership Services 665 S.E. 10 Street, Suite 201 Deerfield Beach, FL 33441-5634 or by calling 1-800-965-8307
or 954-785-1121.
|
|
|

