You are not logged in.
This means you
CAN ONLY VIEW reports that were published prior to Monday, April 14, 2025.
You
MUST UPGRADE YOUR MEMBERSHIP if you want to see any current reports.
AFTER MARKET UPDATE - WEDNESDAY, JUNE 20TH, 2012
Previous After Market Report Next After Market Report >>>
|
|
|
|
DOW |
-13.40 |
12,823.93 |
-0.10% |
|
Volume |
751,136,600 |
-3% |
|
Volume |
1,522,974,460 |
-14% |
|
NASDAQ |
+0.69 |
2,930.45 |
+0.02% |
|
Advancers |
1,511 |
48% |
|
Advancers |
1,091 |
42% |
|
S&P 500 |
-2.30 |
1,355.68 |
-0.17% |
|
Decliners |
1,528 |
48% |
|
Decliners |
1,367 |
53% |
|
Russell 2000 |
-2.38 |
784.05 |
-0.30% |
|
52 Wk Highs |
88 |
|
|
52 Wk Highs |
80 |
|
|
S&P 600 |
-1.57 |
436.96 |
-0.36% |
|
52 Wk Lows |
8 |
|
|
52 Wk Lows |
19 |
|
|
 |
Major Averages Ended Mixed With Lighter Volume Totals
Kenneth J. Gruneisen - Passed the CAN SLIM® Master's Exam
The major averages ended mixed and little changed on Wednesday. The volume totals were reported lighter than the prior session totals on the Nasdaq exchange and on the NYSE. Decliners held a slight lead over advancers on the NYSE and decliners led advancers by about a 7-5 margin on the Nasdaq exchange. The total number of new 52-week highs easily exceeded new 52-week lows on both the NYSE and on the Nasdaq exchange. Additionally, the new lows total sank into the single digits on the NYSE. There were 46 high-ranked companies from the CANSLIM.net Leaders List made new 52-week highs and appeared on the CANSLIM.net BreakOuts Page, down from the prior session total of 84 stocks. At the session's close there were gains for 6 of the 16 high-ranked companies currently included on the Featured Stocks Page
The major averages lost ground after the FOMC statement failed to meet investor hopes for additional stimulus measures. The Fed said it will expand its "Operation Twist" program and said it is prepared to take further action if needed. Investors also focused on Chairman Bernanke's press conference at 2:15PM ET as he addressed the central bank's assessment of the economy. The Fed's forecasts put a damper on investor sentiment after it projected weaker growth, higher unemployment and softer inflation over the next few years.
With focus on the Fed, economic data was overlooked as mortgage applications declined last week after the biggest increase since November 2010 in the prior reading. On the upside, Greek political parties agreed to form a coalition government that will seek relief from austerity measures, which helped ease fears that it may exit the euro. There was also a report that Germany's Chancellor said bond purchases by the EU bailout fund were a possibility.
Adobe Systems Inc (ADBE -2.71%) fell even after its earnings narrowly beat expectations. Profit tallies will remain in focus, and after Wednesday's close reports were due out from Bed Bath & Beyond Inc (BBBY -1.41%) and Red Hat Inc (RHT -0.74%).
Commodities were under pressure, with copper falling for the first time in six sessions, and crude oil also fell after the Energy Department said U.S. crude stockpiles rose to the highest level in almost 22 years.
In bondland, Treasuries finished mixed with the 10-year note down 9/32 to yield 1.65% and the 30-year bond gained 7/32 to yield 2.72%.
Technically, the major averages (M criteria) have confirmed a new rally attempt and fact-based investors may carefully begin with new buying efforts strictly in sound buy candidates near proper entry points. As always, disciplined investors limit losses if any stock ever falls more than -7% from its purchase price.
The Q2 2012 Webcast is scheduled for Wednesday, June 27th at 8PM EST and will be available "ON DEMAND" afterward. All who have the UPGRADED membership now get access to these informative *Quarterly Webcasts included at no additional cost. (*Previously sold separately at $99 per webcast.) Links to archived webcasts and all prior reports are on the Premium Member Homepage. Please use the inquiry form to submit any questions that you would like to see answered in the upcoming webcast or to make any suggestions or comments about our website and services. Thank you!
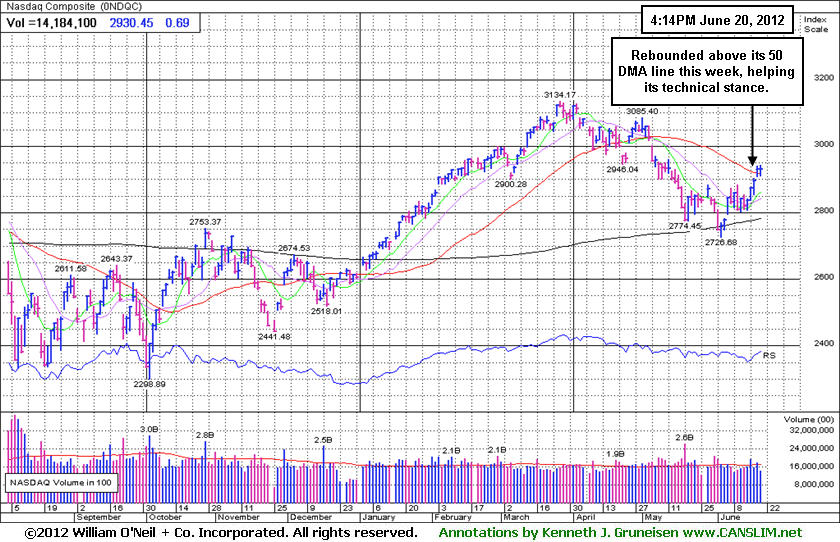
PICTURED: The Nasdaq Composite Index rallied above its downward sloping 50-day moving average (DMA) line this week, helping its technical stance. Progress above that important short-term average by all 3 major averages this week has been noted as a reassuring sign for the current rally.
|
 Kenneth J. Gruneisen started out as a licensed stockbroker in August 1987, a couple of months prior to the historic stock market crash that took the Dow Jones Industrial Average down -22.6% in a single day. He has published daily fact-based fundamental and technical analysis on high-ranked stocks online for two decades. Through FACTBASEDINVESTING.COM, Kenneth provides educational articles, news, market commentary, and other information regarding proven investment systems that work in good times and bad.
Comments contained in the body of this report are technical opinions only and are not necessarily those of Gruneisen Growth Corp. The material herein has been obtained from sources believed to be reliable and accurate, however, its accuracy and completeness cannot be guaranteed. Our firm, employees, and customers may effect transactions, including transactions contrary to any recommendation herein, or have positions in the securities mentioned herein or options with respect thereto. Any recommendation contained in this report may not be suitable for all investors and it is not to be deemed an offer or solicitation on our part with respect to the purchase or sale of any securities. |
|
 |
Financial, Semiconductor, and Networking Indexes Posted Gains
Kenneth J. Gruneisen - Passed the CAN SLIM® Master's Exam
The Retail Index ($RLX -0.43%) was a negative influence on the major averages, meanwhile the Bank Index ($BKX +0.29%) and the Broker/Dealer Index ($XBD +0.69%) posted small gains. The tech sector was mixed, with gains for the Networking Index ($NWX +0.76%) and the Semiconductor Index ($SOX +0.95%) while the Internet Index ($IIX -0.31%) and Biotechnology Index ($BTK -0.22%) edged lower. Energy-related shares drifted lower as the Oil Services Index ($OSX -0.47%) and Integrated Oil Index ($XOI -0.21%) ended with small losses. The Healthcare Index ($HMO -0.16%) also ended with a small loss.
Charts courtesy www.stockcharts.com
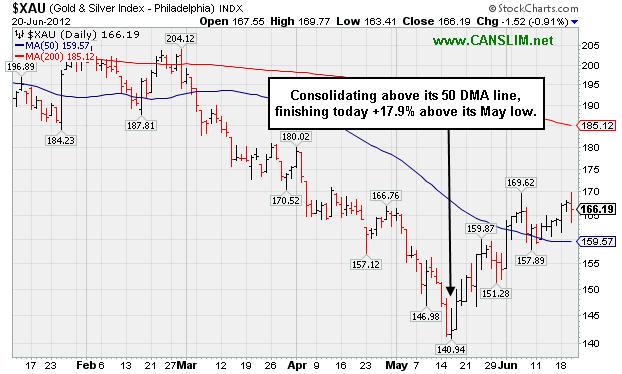
PICTURED: The Gold & Silver Index ($XAU -0.91%) is consolidating above its 50-day moving average (DMA) line. It finished the session +17.9% above its May low.
| Oil Services |
$OSX |
203.91 |
-0.97 |
-0.47% |
-5.72% |
| Healthcare |
$HMO |
2,274.10 |
-3.55 |
-0.16% |
-0.33% |
| Integrated Oil |
$XOI |
1,155.54 |
-2.43 |
-0.21% |
-5.99% |
| Semiconductor |
$SOX |
388.59 |
+3.65 |
+0.95% |
+6.63% |
| Networking |
$NWX |
215.55 |
+1.62 |
+0.76% |
+0.18% |
| Internet |
$IIX |
303.38 |
-0.94 |
-0.31% |
+7.68% |
| Broker/Dealer |
$XBD |
87.56 |
+0.60 |
+0.69% |
+5.15% |
| Retail |
$RLX |
624.38 |
-2.67 |
-0.43% |
+19.34% |
| Gold & Silver |
$XAU |
166.19 |
-1.52 |
-0.91% |
-8.00% |
| Bank |
$BKX |
45.54 |
+0.13 |
+0.29% |
+15.64% |
| Biotech |
$BTK |
1,466.56 |
-3.19 |
-0.22% |
+34.37% |
|
|
|
 |
Cleared Pivot Point With Gain Backed by +86% Above Average Volume
Kenneth J. Gruneisen - Passed the CAN SLIM® Master's Exam
Netsuite Inc (N +$1.49 or +2.93% to $52.31) finished strong after it was highlighted in yellow in today's mid-day report (read here) with a new pivot point cited based on its 3/27/12 high plus 10 cents. It was hitting a new 52-week high with a 5th consecutive gain while it was noted - "Gains above its pivot point backed by at least +40% above average volume or more may trigger a technical buy signal." It finished the session with a gain above its pivot point backed by +86% above average volume. No resistance remains to hinder its upward progress. Disciplined investors avoid chasing stocks after they have risen more than +5% above their pivot point, and they always limit losses if ever any stock falls more than -7% from their purchase price to protect their precious capital.
It reported earnings above the +25% guideline in the 3 latest quarterly comparisons through Mar '12. Its annual earnings (A criteria) history improved from losses prior to FY '09. The number of top-rated funds owning its shares rose from 201 in Jun '11 to 268 in Mar '12, a reassuring sign concerning the I criteria.

|
|
|
Color Codes Explained :
Y - Better candidates highlighted by our
staff of experts.
G - Previously featured
in past reports as yellow but may no longer be buyable under the
guidelines.
***Last / Change / Volume data in this table is the closing quote data***
Symbol/Exchange
Company Name
Industry Group |
PRICE |
CHANGE
(%Change) |
Day High |
Volume
(% DAV)
(% 50 day avg vol) |
52 Wk Hi
% From Hi |
Featured
Date |
Price
Featured |
Pivot Featured |
|
Max Buy |
ALXN
-
NASDAQ
Alexion Pharmaceuticals
DRUGS - Drug Manufacturers - Other
|
$97.82
|
-0.88
-0.89% |
$99.41
|
1,583,643
74.55% of 50 DAV
50 DAV is 2,124,300
|
$99.20
-1.39%
|
5/1/2012
|
$91.73
|
PP = $95.11
|
|
MB = $99.87
|
Most Recent Note - 6/19/2012 10:10:54 AM
Y - Gapped up today, clearing resistance in the $94-95 area and rising above its pivot point for a new 52-week high.
>>> The latest Featured Stock Update with an annotated graph appeared on 5/31/2012. Click here.
View all notes |
Alert me of new notes |
CANSLIM.net Company Profile |
SEC |
Zacks Reports |
StockTalk |
News |
Chart |
Request a new note
C
A N
S L
I M


|
ASPS
-
NASDAQ
Altisource Ptf Sltns Sa
REAL ESTATE - Property Management/Developmen
|
$70.97
|
-0.80
-1.11% |
$72.26
|
125,871
89.59% of 50 DAV
50 DAV is 140,500
|
$72.61
-2.26%
|
6/5/2012
|
$60.01
|
PP = $63.00
|
|
MB = $66.15
|
Most Recent Note - 6/19/2012 11:47:50 AM
G - Hitting another new 52-week high today. Prior highs in the $65 area define initial support to watch on pullbacks, meanwhile it is getting extended from its prior base.
>>> The latest Featured Stock Update with an annotated graph appeared on 6/5/2012. Click here.
View all notes |
Alert me of new notes |
CANSLIM.net Company Profile |
SEC |
Zacks Reports |
StockTalk |
News |
Chart |
Request a new note
C
A N
S L
I M
|
CERN
-
NASDAQ
Cerner Corp
COMPUTER SOFTWARE and SERVICES - Healthcare Information Service
|
$83.51
|
-3.40
-3.91% |
$87.22
|
2,753,702
201.37% of 50 DAV
50 DAV is 1,367,500
|
$88.32
-5.45%
|
6/7/2012
|
$78.36
|
PP = $84.20
|
|
MB = $88.41
|
 Most Recent Note - 6/20/2012 1:16:40 PM
Y - Pulling back today following a streak of 4 gains marked by above average volume that triggered a technical buy signal and challenged its "max buy" level. No resistance remains due to overhead supply.
>>> The latest Featured Stock Update with an annotated graph appeared on 6/7/2012. Click here.
View all notes |
Alert me of new notes |
CANSLIM.net Company Profile |
SEC |
Zacks Reports |
StockTalk |
News |
Chart |
Request a new note
C
A N
S L
I M
|
CMCSA
-
NASDAQ
Comcast Corp Cl A
MEDIA - CATV Systems
|
$31.19
|
-0.12
-0.38% |
$31.38
|
15,362,111
111.25% of 50 DAV
50 DAV is 13,808,700
|
$31.65
-1.45%
|
6/11/2012
|
$29.94
|
PP = $30.98
|
|
MB = $32.53
|
Most Recent Note - 6/20/2012 1:06:46 PM
Y - Perched at its 52-week high today, holding its ground after 4 consecutive gains. Its gain on 6/15/12 with +55% above average volume while rising above the new pivot point recently cited triggered a technical buy signal. The prior low ($28.09 on 5/21/12) defines important near-term support to watch.
>>> The latest Featured Stock Update with an annotated graph appeared on 6/11/2012. Click here.
View all notes |
Alert me of new notes |
CANSLIM.net Company Profile |
SEC |
Zacks Reports |
StockTalk |
News |
Chart |
Request a new note
C
A N
S L
I M
|
DG
-
NYSE
Dollar General Corp
RETAIL - Discount, Variety Stores
|
$52.60
|
+0.40
0.77% |
$52.62
|
3,231,952
95.64% of 50 DAV
50 DAV is 3,379,200
|
$52.31
0.55%
|
5/7/2012
|
$48.51
|
PP = $47.69
|
|
MB = $50.07
|
Most Recent Note - 6/20/2012 1:08:04 PM
G - Inching up today for yet another new all-time high. Completed another Secondary Offering on 6/05/12, its 4th Secondary Offering since September '11.
>>> The latest Featured Stock Update with an annotated graph appeared on 6/12/2012. Click here.
View all notes |
Alert me of new notes |
CANSLIM.net Company Profile |
SEC |
Zacks Reports |
StockTalk |
News |
Chart |
Request a new note
C
A N
S L
I M
|
Symbol/Exchange
Company Name
Industry Group |
PRICE |
CHANGE
(%Change) |
Day High |
Volume
(% DAV)
(% 50 day avg vol) |
52 Wk Hi
% From Hi |
Featured
Date |
Price
Featured |
Pivot Featured |
|
Max Buy |
EXPE
-
NASDAQ
Expedia Inc
INTERNET - Internet Information Providers
|
$47.95
|
-0.54
-1.11% |
$48.94
|
5,161,838
110.56% of 50 DAV
50 DAV is 4,668,700
|
$50.66
-5.35%
|
4/27/2012
|
$41.80
|
PP = $35.57
|
|
MB = $37.35
|
Most Recent Note - 6/20/2012 12:05:32 PM
G - Pulling back from its 52-week high today with a 3rd consecutive loss. It is extended from its prior highs in the $43 area which define initial support above its 50 DMA line.
>>> The latest Featured Stock Update with an annotated graph appeared on 6/8/2012. Click here.
View all notes |
Alert me of new notes |
CANSLIM.net Company Profile |
SEC |
Zacks Reports |
StockTalk |
News |
Chart |
Request a new note
C
A N
S L
I M
|
GNC
-
NYSE
G N C Holdings Inc
RETAIL - Drug Stores
|
$37.07
|
+0.58
1.59% |
$38.69
|
4,523,992
215.21% of 50 DAV
50 DAV is 2,102,100
|
$41.95
-11.63%
|
1/19/2012
|
$28.99
|
PP = $29.60
|
|
MB = $31.08
|
Most Recent Note - 6/19/2012 10:06:14 AM
G - Rebounding toward its 50 DMA line which may now act as a resistance level. Gains above that short-term average would help its technical stance and improve the outlook.
>>> The latest Featured Stock Update with an annotated graph appeared on 6/6/2012. Click here.
View all notes |
Alert me of new notes |
CANSLIM.net Company Profile |
SEC |
Zacks Reports |
StockTalk |
News |
Chart |
Request a new note
C
A N
S L
I M
|
MLNX
-
NASDAQ
Mellanox Technologies
ELECTRONICS - Semiconductor - Broad Line
|
$70.59
|
-1.56
-2.16% |
$73.39
|
1,055,018
166.62% of 50 DAV
50 DAV is 633,200
|
$74.27
-4.95%
|
6/18/2012
|
$70.90
|
PP = $67.30
|
|
MB = $70.67
|
Most Recent Note - 6/20/2012 1:19:48 PM
Y - Pulling back today from a new 52-week high hit on the prior session. On 6/18/12 it was highlighted in yellow in the mid-day report after it gapped up, rising from an 9-week cup-shaped base without a handle triggering a technical buy signal. Reported earnings +113% on +61% sales revenues for the quarter ended March 31, 2012 versus the year ago period. Its streak of 3 strong quarterly earnings comparisons now satisfies the C criteria. A downturn in FY '09 earnings is a small flaw in its annual earnings (A criteria) history. Gapped up on 4/17/12 for a new all-time high following an analyst upgrade. Top-rated funds owning its shares rose from 108 in Jun '11 to 177 in Mar '12 a reassuring sign concerning the I criteria.

There are no Featured Stock Updates™ available for this stock at this time. You may request one by clicking the Request a New Note link below
View all notes |
Alert me of new notes |
CANSLIM.net Company Profile |
SEC |
Zacks Reports |
StockTalk |
News |
Chart |
Request a new note
C
A N
S L
I M
|
N
-
NYSE
Netsuite Inc
DIVERSIFIED SERVICES - Business/Management Services
|
$52.31
|
+1.49
2.93% |
$52.79
|
824,571
185.92% of 50 DAV
50 DAV is 443,500
|
$51.78
1.02%
|
6/20/2012
|
$51.83
|
PP = $51.88
|
|
MB = $54.47
|
Most Recent Note - 6/20/2012 5:51:30 PM
Y - Highlighted in yellow in the mid-day report with new pivot point cited based on its 3/27/12 high plus 10 cents. Today's 5th consecutive gain and strong close above the pivot was backed by +86% above average volume, triggering a technical buy signal. Reported earnings above the +25% guideline in the 3 latest quarterly comparisons through Mar '12. Its annual earnings (A criteria) history improved from losses prior to FY '09. The number of top-rated funds owning its shares rose from 201 in Jun '11 to 268 in Mar '12, a reassuring sign concerning the I criteria. See the latest FSU analysis for more details and a new annotated graph.
>>> The latest Featured Stock Update with an annotated graph appeared on 6/20/2012. Click here.
View all notes |
Alert me of new notes |
CANSLIM.net Company Profile |
SEC |
Zacks Reports |
StockTalk |
News |
Chart |
Request a new note
C
A N
S L
I M
|
NTES
-
NASDAQ
Netease Inc Adr
INTERNET - Internet Information Providers
|
$62.91
|
-0.90
-1.41% |
$64.08
|
598,033
83.49% of 50 DAV
50 DAV is 716,300
|
$65.54
-4.01%
|
3/19/2012
|
$56.18
|
PP = $55.10
|
|
MB = $57.86
|
Most Recent Note - 6/19/2012 4:39:04 PM
G - Rallied today for its best 2012 close with a 4th consecutive gain. Its 50 DMA line defines near-term support and prior lows near the $55 area define the next important chart support to watch where violations may trigger a worrisome technical sell signals. See the latest FSU analysis for more details and a new annotated graph.
>>> The latest Featured Stock Update with an annotated graph appeared on 6/19/2012. Click here.
View all notes |
Alert me of new notes |
CANSLIM.net Company Profile |
SEC |
Zacks Reports |
StockTalk |
News |
Chart |
Request a new note
C
A N
S L
I M
|
Symbol/Exchange
Company Name
Industry Group |
PRICE |
CHANGE
(%Change) |
Day High |
Volume
(% DAV)
(% 50 day avg vol) |
52 Wk Hi
% From Hi |
Featured
Date |
Price
Featured |
Pivot Featured |
|
Max Buy |
SWI
-
NYSE
Solarwinds Inc
COMPUTER SOFTWARE and SERVICES - Application Software
|
$46.51
|
-0.21
-0.45% |
$47.00
|
513,718
50.99% of 50 DAV
50 DAV is 1,007,400
|
$48.64
-4.38%
|
4/26/2012
|
$45.15
|
PP = $42.32
|
|
MB = $44.44
|
Most Recent Note - 6/18/2012 5:10:37 PM
Y - Posted a 3rd consecutive gain today with ever increasing volume. Color code was changed to yellow while no new pivot point was cited, yet it was noted that a valid secondary buy point exists up to +5% above the recent high. Its 50 DMA line and the 6/04/11 low ($41.24) define important support top watch on pullbacks.
>>> The latest Featured Stock Update with an annotated graph appeared on 6/15/2012. Click here.
View all notes |
Alert me of new notes |
CANSLIM.net Company Profile |
SEC |
Zacks Reports |
StockTalk |
News |
Chart |
Request a new note
C
A N
S L
I M
|
SXCI
-
NASDAQ
S X C Health Solutions
COMPUTER SOFTWARE and SERVICES - Healthcare Information Service
|
$97.66
|
-0.89
-0.90% |
$98.96
|
1,053,558
81.45% of 50 DAV
50 DAV is 1,293,500
|
$103.97
-6.07%
|
6/14/2012
|
$94.71
|
PP = $100.60
|
|
MB = $105.63
|
Most Recent Note - 6/19/2012 12:06:06 PM
Y - Gapped up today for a 4th consecutive gain, hitting a new 52-week high and rallying above its pivot point with volume running at an above average pace. Its 50 DMA line defines important support for chart readers.
>>> The latest Featured Stock Update with an annotated graph appeared on 6/14/2012. Click here.
View all notes |
Alert me of new notes |
CANSLIM.net Company Profile |
SEC |
Zacks Reports |
StockTalk |
News |
Chart |
Request a new note
C
A N
S L
I M
|
TDG
-
NYSE
Transdigm Group Inc
AEROSPACE/DEFENSE - Aerospace/Defense Products and; Services
|
$129.81
|
+2.49
1.96% |
$130.31
|
489,812
89.14% of 50 DAV
50 DAV is 549,500
|
$132.69
-2.17%
|
6/18/2012
|
$127.00
|
PP = $132.79
|
|
MB = $139.43
|
Most Recent Note - 6/20/2012 1:22:21 PM
Y - Today's 3rd consecutive gain has it poised for a best ever close and perched within close striking distance of its all-time high. Color code was changed to yellow with new pivot point cited. Subsequent volume-driven gains above the pivot point may trigger a new (or add-on) technical buy signal. Its prior low ($118.43 on 5/18/12) defines the next important near-term chart support level to watch.
>>> The latest Featured Stock Update with an annotated graph appeared on 6/18/2012. Click here.
View all notes |
Alert me of new notes |
CANSLIM.net Company Profile |
SEC |
Zacks Reports |
StockTalk |
News |
Chart |
Request a new note
C
A N
S L
I M
|
UA
-
NYSE
Under Armour Inc Cl A
CONSUMER NON-DURABLES - Textile - Apparel Clothing
|
$105.18
|
-1.26
-1.18% |
$106.83
|
779,986
78.63% of 50 DAV
50 DAV is 992,000
|
$107.86
-2.48%
|
2/15/2012
|
$85.77
|
PP = $84.86
|
|
MB = $89.10
|
Most Recent Note - 6/20/2012 1:09:58 PM
G - Wedged to new 52-week highs without especially great volume conviction behind recent gains. It was previously noted - "No resistance remains due to overhead supply. Fundamental concerns remain after a slightly sub par earnings increase in the Dec '11 quarter."
>>> The latest Featured Stock Update with an annotated graph appeared on 5/29/2012. Click here.
View all notes |
Alert me of new notes |
CANSLIM.net Company Profile |
SEC |
Zacks Reports |
StockTalk |
News |
Chart |
Request a new note
C
A N
S L
I M
|
VSI
-
NYSE
Vitamin Shoppe Inc
SPECIALTY RETAIL - Specialty Retail, Other
|
$54.76
|
+0.92
1.71% |
$55.01
|
487,358
101.62% of 50 DAV
50 DAV is 479,600
|
$55.29
-0.96%
|
4/25/2012
|
$47.77
|
PP = $48.46
|
|
MB = $50.88
|
Most Recent Note - 6/20/2012 1:11:12 PM
Y - Up today for a 4th consecutive gain, poised for a best-ever close. Found support above prior highs in the $48 area and above its 50 DMA line. One may consider a secondary buy point from its successful test of the 10 week average up to +5% above the recent high. Disciplined investors always limit losses by selling if a stock falls more than -7% from their buy price.
>>> The latest Featured Stock Update with an annotated graph appeared on 6/4/2012. Click here.
View all notes |
Alert me of new notes |
CANSLIM.net Company Profile |
SEC |
Zacks Reports |
StockTalk |
News |
Chart |
Request a new note
C
A N
S L
I M
|
Symbol/Exchange
Company Name
Industry Group |
PRICE |
CHANGE
(%Change) |
Day High |
Volume
(% DAV)
(% 50 day avg vol) |
52 Wk Hi
% From Hi |
Featured
Date |
Price
Featured |
Pivot Featured |
|
Max Buy |
WFM
-
NASDAQ
Whole Foods Market Inc
RETAIL - Grocery Stores
|
$96.14
|
+0.46
0.48% |
$96.38
|
1,683,598
88.16% of 50 DAV
50 DAV is 1,909,600
|
$95.94
0.21%
|
6/13/2012
|
$89.90
|
PP = $91.60
|
|
MB = $96.18
|
Most Recent Note - 6/20/2012 1:12:47 PM
Y - Inching to another new 52-week high while on track for a 5th consecutive gain today. Its 6/15/12 gain with +72% above average volume confirmed a technical buy signal. No resistance remains due to overhead supply. Its 50 DMA line and prior lows define important near-term support.
>>> The latest Featured Stock Update with an annotated graph appeared on 6/13/2012. Click here.
View all notes |
Alert me of new notes |
CANSLIM.net Company Profile |
SEC |
Zacks Reports |
StockTalk |
News |
Chart |
Request a new note
C
A N
S L
I M
|
|
|
|
THESE ARE NOT BUY RECOMMENDATIONS!
Comments contained in the body of this report are technical
opinions only. The material herein has been obtained
from sources believed to be reliable and accurate, however,
its accuracy and completeness cannot be guaranteed.
This site is not an investment advisor, hence it does
not endorse or recommend any securities or other investments.
Any recommendation contained in this report may not
be suitable for all investors and it is not to be deemed
an offer or solicitation on our part with respect to
the purchase or sale of any securities. All trademarks,
service marks and trade names appearing in this report
are the property of their respective owners, and are
likewise used for identification purposes only.
This report is a service available
only to active Paid Premium Members.
You may opt-out of receiving report notifications
at any time. Questions or comments may be submitted
by writing to Premium Membership Services 665 S.E. 10 Street, Suite 201 Deerfield Beach, FL 33441-5634 or by calling 1-800-965-8307
or 954-785-1121.
|
|
|

