You are not logged in.
This means you
CAN ONLY VIEW reports that were published prior to Monday, April 14, 2025.
You
MUST UPGRADE YOUR MEMBERSHIP if you want to see any current reports.
AFTER MARKET UPDATE - TUESDAY, JUNE 19TH, 2012
Previous After Market Report Next After Market Report >>>
|
|
|
|
DOW |
+95.51 |
12,837.33 |
+0.75% |
|
Volume |
772,234,400 |
+9% |
|
Volume |
1,774,047,450 |
+14% |
|
NASDAQ |
+34.43 |
2,929.76 |
+1.19% |
|
Advancers |
2,600 |
82% |
|
Advancers |
1,904 |
73% |
|
S&P 500 |
+13.20 |
1,357.98 |
+0.98% |
|
Decliners |
491 |
15% |
|
Decliners |
601 |
23% |
|
Russell 2000 |
+13.90 |
786.43 |
+1.80% |
|
52 Wk Highs |
139 |
|
|
52 Wk Highs |
111 |
|
|
S&P 600 |
+7.79 |
438.53 |
+1.81% |
|
52 Wk Lows |
11 |
|
|
52 Wk Lows |
18 |
|
|
 |
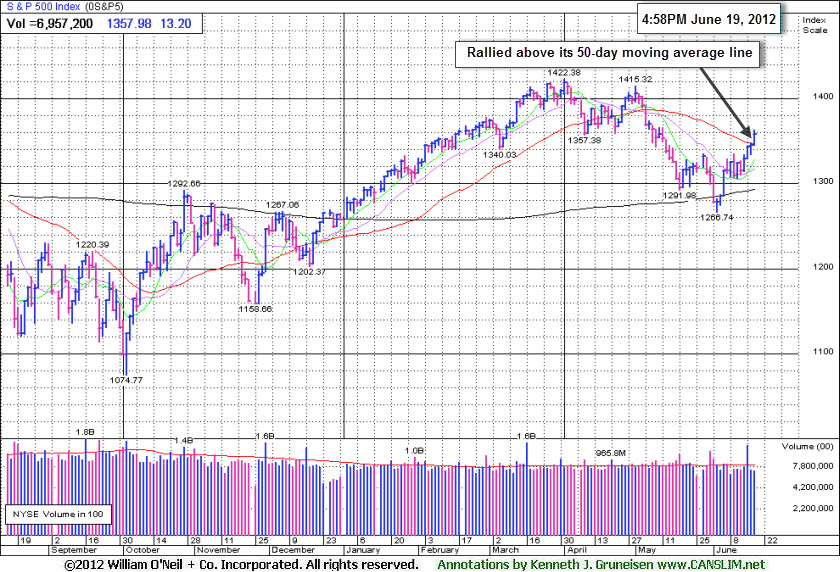
Major Averages Rallied Above Respective 50-Day Moving Average Lines
Kenneth J. Gruneisen - Passed the CAN SLIM® Master's Exam
On Tuesday all three major averages rallied above their respective 50-day moving average (DMA) lines helping their technical stance. The volume totals were reported higher than the prior session totals on the Nasdaq exchange and on the NYSE, a sign of greater buying conviction coming into stocks from the institutional crowd. Breadth was positive as advancers led decliners by more than 5-1 ratio on the NYSE and more than 3-1 on the Nasdaq exchange. The total number of new 52-week highs swelled and easily exceeded new 52-week lows on both the NYSE and on the Nasdaq exchange. There were 84 high-ranked companies from the CANSLIM.net Leaders List made new 52-week highs and appeared on the CANSLIM.net BreakOuts Page, versus the prior session total of 59 stocks. At the session's close there gains for 13 of the 15 high-ranked companies currently included on the Featured Stocks Page.
The rally was buoyed by hopes for additional stimulus measures, ahead of the conclusion of the Federal Reserve's two day meeting. U.S. economic data provided a mixed picture. Housing starts came in short of expectations in May, but the upward revision to April's reading eased the impact. Housing Permits topped projections. In addition, some euro zone concerns eased to add to the positive tone as Spanish bond yields declined after a solid bill auction and European creditors prepared to ease Greece's bailout terms.
All sectors saw green. Materials led the push higher as crude oil advanced and copper extended its longest rally in seven weeks. Shares of Alcoa Inc (AA +2.42%) and U.S. Steel Corp (X +9.45%) rallied. FedEx Corp (FDX +2.82%) initially lost ground after posting disappointing full-year guidance, but rebounded to gain ground after saying it plans to restructure its express business. Tech stocks were also showing strength. Microsoft Corp (MSFT +2.88%) advanced after the company introduced their new touch screen tablet computers. On the earnings front, Oracle (ORCL +3.10%) was in the green after the company posted a better-than-expected profit tally in a surprise earnings release after Monday's closing bell. Fellow techie Adobe Systems Inc (ADBE +0.80%) was scheduled to post its tally after the closing bell.
In bondland, Treasury prices experienced their first decline in three sessions with the 10-year note down 12/32 to yield 1.62% and the 30-year bond lost nearly a full point and half to yield 2.73%.
Technically, the major averages (M criteria) have confirmed a new rally attempt and fact-based investors may carefully begin with new buying efforts strictly in sound buy candidates near proper entry points. As always, disciplined investors limit losses if any stock ever falls more than -7% from its purchase price.
The Q2 2012 Webcast is scheduled for Wednesday, June 27th at 8PM EST and will be available "ON DEMAND" afterward. All who have the UPGRADED membership now get access to these informative *Quarterly Webcasts included at no additional cost. (*Previously sold separately at $99 per webcast.) Links to archived webcasts and all prior reports are on the Premium Member Homepage. Please use the inquiry form to submit any questions that you would like to see answered in the upcoming webcast or to make any suggestions or comments about our website and services. Thank you!
PICTURED: The benchmark S&P 500 Index rallied above its downward sloping 50-day moving average (DMA) line with its 4th consecutive gain. Progress above that important short-term average is a reassuring sign for the current rally.
|
 Kenneth J. Gruneisen started out as a licensed stockbroker in August 1987, a couple of months prior to the historic stock market crash that took the Dow Jones Industrial Average down -22.6% in a single day. He has published daily fact-based fundamental and technical analysis on high-ranked stocks online for two decades. Through FACTBASEDINVESTING.COM, Kenneth provides educational articles, news, market commentary, and other information regarding proven investment systems that work in good times and bad.
Comments contained in the body of this report are technical opinions only and are not necessarily those of Gruneisen Growth Corp. The material herein has been obtained from sources believed to be reliable and accurate, however, its accuracy and completeness cannot be guaranteed. Our firm, employees, and customers may effect transactions, including transactions contrary to any recommendation herein, or have positions in the securities mentioned herein or options with respect thereto. Any recommendation contained in this report may not be suitable for all investors and it is not to be deemed an offer or solicitation on our part with respect to the purchase or sale of any securities. |
|
 |
Widespread Gains Lift Every Industry Group Again
Kenneth J. Gruneisen - Passed the CAN SLIM® Master's Exam
Gains from energy-related shares boosted the Integrated Oil Index ($XOI +1.60%) and the Oil Services Index ($OSX +2.07%). Financial shares were also a positive influence on the major averages as the Bank Index ($BKX +2.00%) and Broker/Dealer Index ($XBD +1.53%) posted gains. The Networking Index ($NWX +1.44%) led the tech sector higher while the Semiconductor Index ($SOX +1.15%), Internet Index ($IIX +0.82%), and Biotechnology Index ($BTK +0.49%) followed with smaller gains. The Retail Index ($RLX +0.83%) also rose, and gains from the Healthcare Index ($HMO +1.09%) and Gold & Silver Index ($XAU +0.37%) rounded out the widely positive session.
Charts courtesy www.stockcharts.com
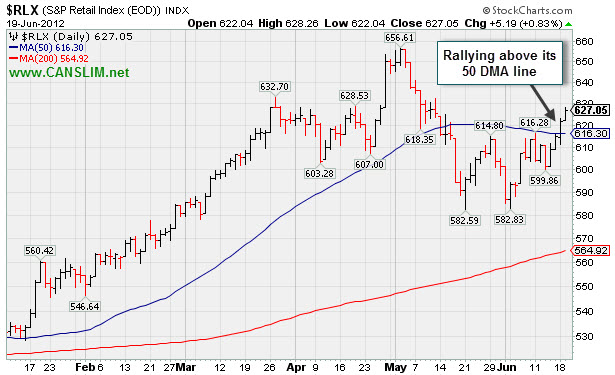
PICTURED: The Retail Index ($RLX +0.83%) is rallying above its 50-day moving average line, helping its technical stance, which bodes well for leading retailers.
| Oil Services |
$OSX |
204.88 |
+4.16 |
+2.07% |
-5.27% |
| Healthcare |
$HMO |
2,277.65 |
+24.46 |
+1.09% |
-0.17% |
| Integrated Oil |
$XOI |
1,157.96 |
+18.21 |
+1.60% |
-5.79% |
| Semiconductor |
$SOX |
384.94 |
+4.39 |
+1.15% |
+5.63% |
| Networking |
$NWX |
213.93 |
+3.03 |
+1.44% |
-0.57% |
| Internet |
$IIX |
304.31 |
+2.47 |
+0.82% |
+8.01% |
| Broker/Dealer |
$XBD |
86.96 |
+1.31 |
+1.53% |
+4.43% |
| Retail |
$RLX |
627.05 |
+5.19 |
+0.83% |
+19.85% |
| Gold & Silver |
$XAU |
167.71 |
+0.61 |
+0.37% |
-7.16% |
| Bank |
$BKX |
45.41 |
+0.89 |
+2.00% |
+15.31% |
| Biotech |
$BTK |
1,469.75 |
+7.19 |
+0.49% |
+34.66% |
|
|
|
 |
Best Close of 2012 After No New Base Was Formed
Kenneth J. Gruneisen - Passed the CAN SLIM® Master's Exam
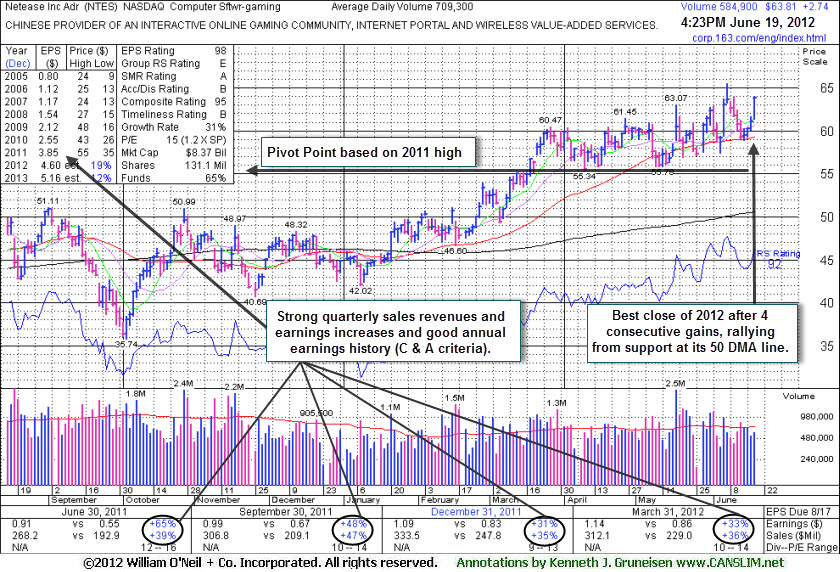
Netease.com Inc (NTES +$2.80 or +4.58% to $63.87) rallied today for its best 2012 close with a 4th consecutive gain. Its 50-day moving average (DMA) line defines near-term support and prior lows near the $55 area define the next important chart support to watch where violations may trigger a worrisome technical sell signals. It has not formed a sound base pattern. No overhead supply remains to act as resistance, however it has made only limited price progress above its 2011 highs in the $55 area in recent months, including a time when market action was more favorable. It was featured in yellow at $56.18 in the 3/19/12 mid-day report (read here) with a pivot point based on its 4/19/11 high plus 10 cents.
Its last appearance in this FSU section was on 5/24/12 with an annotated graph under the headline, "Distributional Pressure a Problem After Limited Progress". The number of top-rated funds owning its shares rose from 237 in Dec '11 to 250 in Mar '12, a somewhat reassuring improvement concerning the I criteria. Fundamentals remain healthy as it reported earnings +33% on +36% sales revenues for the quarter ended March 31, 2012 versus the year ago period. Its good earnings history satisfies the C and A criteria.
|
|
|
Color Codes Explained :
Y - Better candidates highlighted by our
staff of experts.
G - Previously featured
in past reports as yellow but may no longer be buyable under the
guidelines.
***Last / Change / Volume data in this table is the closing quote data***
Symbol/Exchange
Company Name
Industry Group |
PRICE |
CHANGE
(%Change) |
Day High |
Volume
(% DAV)
(% 50 day avg vol) |
52 Wk Hi
% From Hi |
Featured
Date |
Price
Featured |
Pivot Featured |
|
Max Buy |
ALXN
-
NASDAQ
Alexion Pharmaceuticals
DRUGS - Drug Manufacturers - Other
|
$98.70
|
+4.64
4.93% |
$99.20
|
2,788,851
133.84% of 50 DAV
50 DAV is 2,083,700
|
$95.01
3.88%
|
5/1/2012
|
$91.73
|
PP = $95.11
|
|
MB = $99.87
|
 Most Recent Note - 6/19/2012 10:10:54 AM
Y - Gapped up today, clearing resistance in the $94-95 area and rising above its pivot point for a new 52-week high.
>>> The latest Featured Stock Update with an annotated graph appeared on 5/31/2012. Click here.
View all notes |
Alert me of new notes |
CANSLIM.net Company Profile |
SEC |
Zacks Reports |
StockTalk |
News |
Chart |
Request a new note
C
A N
S L
I M


|
ASPS
-
NASDAQ
Altisource Ptf Sltns Sa
REAL ESTATE - Property Management/Developmen
|
$71.77
|
+1.40
1.99% |
$72.61
|
308,823
224.60% of 50 DAV
50 DAV is 137,500
|
$70.47
1.84%
|
6/5/2012
|
$60.01
|
PP = $63.00
|
|
MB = $66.15
|
Most Recent Note - 6/19/2012 11:47:50 AM
G - Hitting another new 52-week high today. Prior highs in the $65 area define initial support to watch on pullbacks, meanwhile it is getting extended from its prior base.
>>> The latest Featured Stock Update with an annotated graph appeared on 6/5/2012. Click here.
View all notes |
Alert me of new notes |
CANSLIM.net Company Profile |
SEC |
Zacks Reports |
StockTalk |
News |
Chart |
Request a new note
C
A N
S L
I M
|
CERN
-
NASDAQ
Cerner Corp
COMPUTER SOFTWARE and SERVICES - Healthcare Information Service
|
$86.91
|
+0.95
1.11% |
$88.32
|
1,939,934
144.37% of 50 DAV
50 DAV is 1,343,700
|
$86.75
0.18%
|
6/7/2012
|
$78.36
|
PP = $84.20
|
|
MB = $88.41
|
Most Recent Note - 6/18/2012 5:05:17 PM
Y - Hit a new high today with a solid volume-driven gain above its pivot point triggering a new (or add-on) technical buy signal. No resistance remains due to overhead supply.
>>> The latest Featured Stock Update with an annotated graph appeared on 6/7/2012. Click here.
View all notes |
Alert me of new notes |
CANSLIM.net Company Profile |
SEC |
Zacks Reports |
StockTalk |
News |
Chart |
Request a new note
C
A N
S L
I M
|
CMCSA
-
NASDAQ
Comcast Corp Cl A
MEDIA - CATV Systems
|
$31.31
|
+0.15
0.48% |
$31.65
|
13,303,354
96.75% of 50 DAV
50 DAV is 13,750,400
|
$31.41
-0.32%
|
6/11/2012
|
$29.94
|
PP = $30.98
|
|
MB = $32.53
|
Most Recent Note - 6/15/2012 8:34:40 PM
Y - Hit a new 52-week high today with +55% above average volume while rising above the new pivot point recently cited triggering a technical buy signal. The prior low ($28.09 on 5/21/12) defines important near-term support to watch.
>>> The latest Featured Stock Update with an annotated graph appeared on 6/11/2012. Click here.
View all notes |
Alert me of new notes |
CANSLIM.net Company Profile |
SEC |
Zacks Reports |
StockTalk |
News |
Chart |
Request a new note
C
A N
S L
I M
|
DG
-
NYSE
Dollar General Corp
RETAIL - Discount, Variety Stores
|
$52.20
|
+0.57
1.10% |
$52.31
|
3,115,782
92.89% of 50 DAV
50 DAV is 3,354,100
|
$52.25
-0.10%
|
5/7/2012
|
$48.51
|
PP = $47.69
|
|
MB = $50.07
|
Most Recent Note - 6/15/2012 8:35:33 PM
G - Rallied with above average volume to a new all-time high and closed at the session high. Completed another Secondary Offering on 6/05/12, its 4th Secondary Offering since September '11.
>>> The latest Featured Stock Update with an annotated graph appeared on 6/12/2012. Click here.
View all notes |
Alert me of new notes |
CANSLIM.net Company Profile |
SEC |
Zacks Reports |
StockTalk |
News |
Chart |
Request a new note
C
A N
S L
I M
|
Symbol/Exchange
Company Name
Industry Group |
PRICE |
CHANGE
(%Change) |
Day High |
Volume
(% DAV)
(% 50 day avg vol) |
52 Wk Hi
% From Hi |
Featured
Date |
Price
Featured |
Pivot Featured |
|
Max Buy |
EXPE
-
NASDAQ
Expedia Inc
INTERNET - Internet Information Providers
|
$48.49
|
-1.47
-2.94% |
$49.63
|
6,189,357
134.97% of 50 DAV
50 DAV is 4,585,800
|
$50.66
-4.28%
|
4/27/2012
|
$41.80
|
PP = $35.57
|
|
MB = $37.35
|
Most Recent Note - 6/15/2012 8:01:47 PM
G - Powered to a new 52-week high today with a solid gain backed by above average volume. It is extended from its prior highs in the $43 area which define initial support above its 50 DMA line.
>>> The latest Featured Stock Update with an annotated graph appeared on 6/8/2012. Click here.
View all notes |
Alert me of new notes |
CANSLIM.net Company Profile |
SEC |
Zacks Reports |
StockTalk |
News |
Chart |
Request a new note
C
A N
S L
I M
|
GNC
-
NYSE
G N C Holdings Inc
RETAIL - Drug Stores
|
$36.49
|
+1.29
3.66% |
$37.27
|
3,150,079
152.00% of 50 DAV
50 DAV is 2,072,400
|
$41.95
-13.02%
|
1/19/2012
|
$28.99
|
PP = $29.60
|
|
MB = $31.08
|
Most Recent Note - 6/19/2012 10:06:14 AM
G - Rebounding toward its 50 DMA line which may now act as a resistance level. Gains above that short-term average would help its technical stance and improve the outlook.
>>> The latest Featured Stock Update with an annotated graph appeared on 6/6/2012. Click here.
View all notes |
Alert me of new notes |
CANSLIM.net Company Profile |
SEC |
Zacks Reports |
StockTalk |
News |
Chart |
Request a new note
C
A N
S L
I M
|
MLNX
-
NASDAQ
Mellanox Technologies
ELECTRONICS - Semiconductor - Broad Line
|
$72.15
|
+0.62
0.87% |
$74.27
|
869,650
140.86% of 50 DAV
50 DAV is 617,400
|
$73.35
-1.64%
|
6/18/2012
|
$70.90
|
PP = $67.30
|
|
MB = $70.67
|
Most Recent Note - 6/18/2012
Y - Gapped up today, hitting a 52-week high, rising from an 9-week cup-shaped base without a handle. Color code is changed to yellow with pivot point cited based on its 4/19/12 high plus 10 cents. It stayed well above its 50 DMA line during the latest consolidation. Reported earnings +113% on +61% sales revenues for the quarter ended March 31, 2012 versus the year ago period. Its streak of 3 strong quarterly earnings comparisons now satisfies the C criteria. A downturn in FY '09 earnings is a small flaw in its annual earnings (A criteria) history. Gapped up on 4/17/12 for a new all-time high following an analyst upgrade. Top-rated funds owning its shares rose from 108 in Jun '11 to 177 in Mar '12 a reassuring sign concerning the I criteria.

There are no Featured Stock Updates™ available for this stock at this time. You may request one by clicking the Request a New Note link below
View all notes |
Alert me of new notes |
CANSLIM.net Company Profile |
SEC |
Zacks Reports |
StockTalk |
News |
Chart |
Request a new note
C
A N
S L
I M
|
NTES
-
NASDAQ
Netease Inc Adr
INTERNET - Internet Information Providers
|
$63.81
|
+2.74
4.49% |
$64.00
|
586,534
82.69% of 50 DAV
50 DAV is 709,300
|
$65.54
-2.64%
|
3/19/2012
|
$56.18
|
PP = $55.10
|
|
MB = $57.86
|
Most Recent Note - 6/19/2012 4:39:04 PM
G - Rallied today for its best 2012 close with a 4th consecutive gain. Its 50 DMA line defines near-term support and prior lows near the $55 area define the next important chart support to watch where violations may trigger a worrisome technical sell signals. See the latest FSU analysis for more details and a new annotated graph.
>>> The latest Featured Stock Update with an annotated graph appeared on 6/19/2012. Click here.
View all notes |
Alert me of new notes |
CANSLIM.net Company Profile |
SEC |
Zacks Reports |
StockTalk |
News |
Chart |
Request a new note
C
A N
S L
I M
|
SWI
-
NYSE
Solarwinds Inc
COMPUTER SOFTWARE and SERVICES - Application Software
|
$46.72
|
+0.16
0.34% |
$47.89
|
895,506
89.08% of 50 DAV
50 DAV is 1,005,300
|
$48.64
-3.95%
|
4/26/2012
|
$45.15
|
PP = $42.32
|
|
MB = $44.44
|
Most Recent Note - 6/18/2012 5:10:37 PM
Y - Posted a 3rd consecutive gain today with ever increasing volume. Color code was changed to yellow while no new pivot point was cited, yet it was noted that a valid secondary buy point exists up to +5% above the recent high. Its 50 DMA line and the 6/04/11 low ($41.24) define important support top watch on pullbacks.
>>> The latest Featured Stock Update with an annotated graph appeared on 6/15/2012. Click here.
View all notes |
Alert me of new notes |
CANSLIM.net Company Profile |
SEC |
Zacks Reports |
StockTalk |
News |
Chart |
Request a new note
C
A N
S L
I M
|
Symbol/Exchange
Company Name
Industry Group |
PRICE |
CHANGE
(%Change) |
Day High |
Volume
(% DAV)
(% 50 day avg vol) |
52 Wk Hi
% From Hi |
Featured
Date |
Price
Featured |
Pivot Featured |
|
Max Buy |
SXCI
-
NASDAQ
S X C Health Solutions
COMPUTER SOFTWARE and SERVICES - Healthcare Information Service
|
$98.55
|
-0.01
-0.01% |
$103.97
|
2,205,566
175.50% of 50 DAV
50 DAV is 1,256,700
|
$100.50
-1.94%
|
6/14/2012
|
$94.71
|
PP = $100.60
|
|
MB = $105.63
|
Most Recent Note - 6/19/2012 12:06:06 PM
Y - Gapped up today for a 4th consecutive gain, hitting a new 52-week high and rallying above its pivot point with volume running at an above average pace. Its 50 DMA line defines important support for chart readers.
>>> The latest Featured Stock Update with an annotated graph appeared on 6/14/2012. Click here.
View all notes |
Alert me of new notes |
CANSLIM.net Company Profile |
SEC |
Zacks Reports |
StockTalk |
News |
Chart |
Request a new note
C
A N
S L
I M
|
TDG
-
NYSE
Transdigm Group Inc
AEROSPACE/DEFENSE - Aerospace/Defense Products and; Services
|
$127.32
|
+0.32
0.25% |
$128.32
|
307,298
56.11% of 50 DAV
50 DAV is 547,700
|
$132.69
-4.05%
|
6/18/2012
|
$127.00
|
PP = $132.79
|
|
MB = $139.43
|
Most Recent Note - 6/18/2012 5:04:06 PM
Y - Consolidating above important support at its 50 DMA line while perched within close striking distance of its all-time high. Color code is changed to yellow with new pivot point cited. Subsequent volume-driven gains above the pivot point may trigger a new (or add-on) technical buy signal. Its prior low ($118.43 on 5/18/12) defines the next important near-term chart support level to watch. See the latest FSU analysis for more details and a new annotated graph.
>>> The latest Featured Stock Update with an annotated graph appeared on 6/18/2012. Click here.
View all notes |
Alert me of new notes |
CANSLIM.net Company Profile |
SEC |
Zacks Reports |
StockTalk |
News |
Chart |
Request a new note
C
A N
S L
I M
|
UA
-
NYSE
Under Armour Inc Cl A
CONSUMER NON-DURABLES - Textile - Apparel Clothing
|
$106.44
|
+0.36
0.34% |
$107.86
|
672,279
67.78% of 50 DAV
50 DAV is 991,800
|
$107.15
-0.66%
|
2/15/2012
|
$85.77
|
PP = $84.86
|
|
MB = $89.10
|
Most Recent Note - 6/15/2012 8:29:32 PM
G - Rallied with above average volume today for its second best close ever. It was previously noted - "No resistance remains due to overhead supply. Fundamental concerns remain after a slightly sub par earnings increase in the Dec '11 quarter."
>>> The latest Featured Stock Update with an annotated graph appeared on 5/29/2012. Click here.
View all notes |
Alert me of new notes |
CANSLIM.net Company Profile |
SEC |
Zacks Reports |
StockTalk |
News |
Chart |
Request a new note
C
A N
S L
I M
|
VSI
-
NYSE
Vitamin Shoppe Inc
SPECIALTY RETAIL - Specialty Retail, Other
|
$53.84
|
+2.65
5.18% |
$55.00
|
940,297
201.39% of 50 DAV
50 DAV is 466,900
|
$55.29
-2.62%
|
4/25/2012
|
$47.77
|
PP = $48.46
|
|
MB = $50.88
|
Most Recent Note - 6/19/2012 1:02:21 PM
Y - Rallying today within close striking distance of a best-ever close. Found support above prior highs in the $48 area and above its 50 DMA line. One may consider a secondary buy point from its successful test of the 10 week average up to +5% above the recent high. Disciplined investors always limit losses by selling if a stock falls more than -7% from their buy price.
>>> The latest Featured Stock Update with an annotated graph appeared on 6/4/2012. Click here.
View all notes |
Alert me of new notes |
CANSLIM.net Company Profile |
SEC |
Zacks Reports |
StockTalk |
News |
Chart |
Request a new note
C
A N
S L
I M
|
WFM
-
NASDAQ
Whole Foods Market Inc
RETAIL - Grocery Stores
|
$95.68
|
+0.54
0.57% |
$95.94
|
1,532,540
80.74% of 50 DAV
50 DAV is 1,898,200
|
$95.69
-0.01%
|
6/13/2012
|
$89.90
|
PP = $91.60
|
|
MB = $96.18
|
Most Recent Note - 6/15/2012 8:32:58 PM
Y - Rallied to a new 52-week high today with +72% above average volume, confirming a technical buy signal. No resistance remains due to overhead supply. Its 50 DMA line and prior lows define important near-term support.
>>> The latest Featured Stock Update with an annotated graph appeared on 6/13/2012. Click here.
View all notes |
Alert me of new notes |
CANSLIM.net Company Profile |
SEC |
Zacks Reports |
StockTalk |
News |
Chart |
Request a new note
C
A N
S L
I M
|
Symbol/Exchange
Company Name
Industry Group |
PRICE |
CHANGE
(%Change) |
Day High |
Volume
(% DAV)
(% 50 day avg vol) |
52 Wk Hi
% From Hi |
Featured
Date |
Price
Featured |
Pivot Featured |
|
Max Buy |
|
|
|
THESE ARE NOT BUY RECOMMENDATIONS!
Comments contained in the body of this report are technical
opinions only. The material herein has been obtained
from sources believed to be reliable and accurate, however,
its accuracy and completeness cannot be guaranteed.
This site is not an investment advisor, hence it does
not endorse or recommend any securities or other investments.
Any recommendation contained in this report may not
be suitable for all investors and it is not to be deemed
an offer or solicitation on our part with respect to
the purchase or sale of any securities. All trademarks,
service marks and trade names appearing in this report
are the property of their respective owners, and are
likewise used for identification purposes only.
This report is a service available
only to active Paid Premium Members.
You may opt-out of receiving report notifications
at any time. Questions or comments may be submitted
by writing to Premium Membership Services 665 S.E. 10 Street, Suite 201 Deerfield Beach, FL 33441-5634 or by calling 1-800-965-8307
or 954-785-1121.
|
|
|

