You are not logged in.
This means you
CAN ONLY VIEW reports that were published prior to Monday, April 14, 2025.
You
MUST UPGRADE YOUR MEMBERSHIP if you want to see any current reports.
AFTER MARKET UPDATE - MONDAY, JUNE 18TH, 2012
Previous After Market Report Next After Market Report >>>
|
|
|
|
DOW |
-25.35 |
12,741.82 |
-0.20% |
|
Volume |
707,405,960 |
-53% |
|
Volume |
1,556,458,010 |
-19% |
|
NASDAQ |
+22.53 |
2,895.33 |
+0.78% |
|
Advancers |
1,793 |
57% |
|
Advancers |
1,275 |
49% |
|
S&P 500 |
+1.94 |
1,344.78 |
+0.14% |
|
Decliners |
1,261 |
40% |
|
Decliners |
1,253 |
48% |
|
Russell 2000 |
+1.21 |
772.53 |
+0.16% |
|
52 Wk Highs |
91 |
|
|
52 Wk Highs |
76 |
|
|
S&P 600 |
+0.49 |
430.74 |
+0.11% |
|
52 Wk Lows |
41 |
|
|
52 Wk Lows |
41 |
|
|
 |
Major Averages Ended Mixed With Lighter Volume Totals
Kenneth J. Gruneisen - Passed the CAN SLIM® Master's Exam
The major indices finished mixed on Monday. The volume totals were reported much lighter than the prior session totals on the Nasdaq exchange and on the NYSE, whereas Friday's totals were inflated by options expirations. Breadth was positive as advancers led decliners by about a 3-2 ratio on the NYSE but advancers led decliners by a very narrow margin on the Nasdaq exchange. The total number of new 52-week highs again exceeded new 52-week lows on both the NYSE and on the Nasdaq exchange. There were 59 high-ranked companies from the CANSLIM.net Leaders List made new 52-week highs and appeared on the CANSLIM.net BreakOuts Page, up from the prior session total of 40 stocks. At Monday's close there gains for 12 of the 15 high-ranked companies currently included on the Featured Stocks Page.
Enthusiasm over the support for Greek austerity measures quickly faded after Spanish bond yields climbed to a euro-era record, which sparked fears that the nation will need external funding. Improved economic data was largely overlooked as the NAHB's housing market sentiment index showed homebuilder confidence climbed to a five-year high of 29 in June from a revised 28 in the prior month. Investors will also watch the G20 summit as world leaders discuss ways to help boost the global recovery with possible stimulus measures. Investors cheered reports that major central banks are preparing a coordinated action to provide liquidity in an effort to improve lending conditions. The Federal Reserve Board meets Tuesday and Wednesday.
Financials were hit the hardest by the lingering euro zone fears. Morgan Stanley (MS -3.36%), Bank of America Corp (BAC -1.77%) and Citigroup Inc (C -2.68%) fell.
Technically, the major averages (M criteria) have confirmed a new rally attempt and fact-based investors may carefully begin with new buying efforts strictly in sound buy candidates near proper entry points. Any distribution days immediately afterward could quickly destroy a new rally. As always, disciplined investors limit losses if any stock ever falls more than -7% from its purchase price.
The Q2 2012 Webcast is scheduled for Wednesday, June 27th at 8PM EST and will be available "ON DEMAND" afterward. All who have the UPGRADED membership now get access to these informative *Quarterly Webcasts included at no additional cost. (*Previously sold separately at $99 per webcast.) Links to archived webcasts and all prior reports are on the Premium Member Homepage. Please use the inquiry form to submit any questions that you would like to see answered in the upcoming webcast or to make any suggestions or comments about our website and services. Thank you!
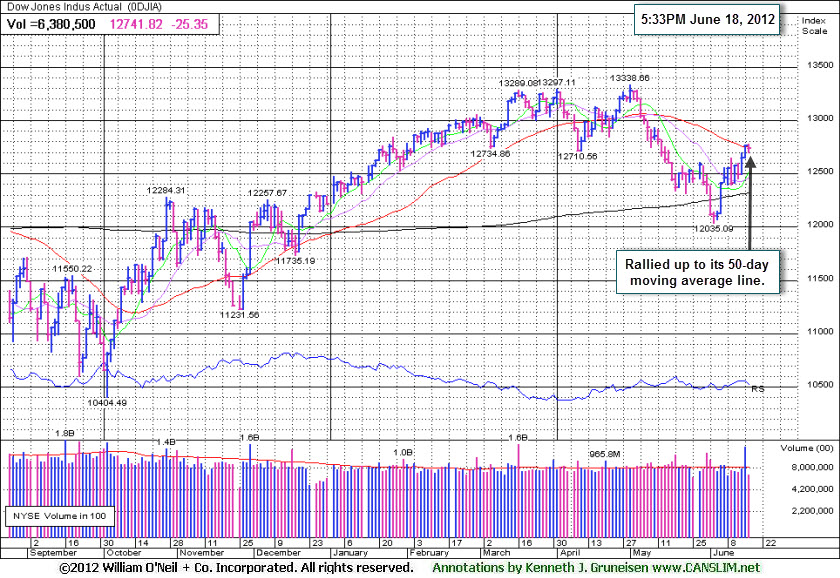
PICTURED: The Dow Jones Industrial Average has rallied to its downward sloping 50-day moving average (DMA) line. Its ability to make progress above that important short-term average would be a reassuring sign for the current rally.
|
 Kenneth J. Gruneisen started out as a licensed stockbroker in August 1987, a couple of months prior to the historic stock market crash that took the Dow Jones Industrial Average down -22.6% in a single day. He has published daily fact-based fundamental and technical analysis on high-ranked stocks online for two decades. Through FACTBASEDINVESTING.COM, Kenneth provides educational articles, news, market commentary, and other information regarding proven investment systems that work in good times and bad.
Comments contained in the body of this report are technical opinions only and are not necessarily those of Gruneisen Growth Corp. The material herein has been obtained from sources believed to be reliable and accurate, however, its accuracy and completeness cannot be guaranteed. Our firm, employees, and customers may effect transactions, including transactions contrary to any recommendation herein, or have positions in the securities mentioned herein or options with respect thereto. Any recommendation contained in this report may not be suitable for all investors and it is not to be deemed an offer or solicitation on our part with respect to the purchase or sale of any securities. |
|
 |
Retail, Gold & Silver, Medical and Tech Shares Rose
Kenneth J. Gruneisen - Passed the CAN SLIM® Master's Exam
The Retail Index ($RLX +1.10%) and Gold & Silver Index ($XAU +1.83%) posted solid gains. The Healthcare Index ($HMO +0.42%) and the Biotechnology Index ($BTK +0.68%) also rose, and other tech sector indices traded up including the Internet Index ($IIX +0.80%), Networking Index ($NWX +0.95%), and the Semiconductor Index ($SOX +1.44%). Meanwhile, financial shares lost ground as the Broker/Dealer Index ($XBD -1.18%) and Bank Index ($BKX -0.45%) fell. Energy-related shares were standout decliners on Monday as the Oil Services Index ($OSX -1.26%) and Integrated Oil Index ($XOI -0.92%) suffered losses.
Charts courtesy www.stockcharts.com
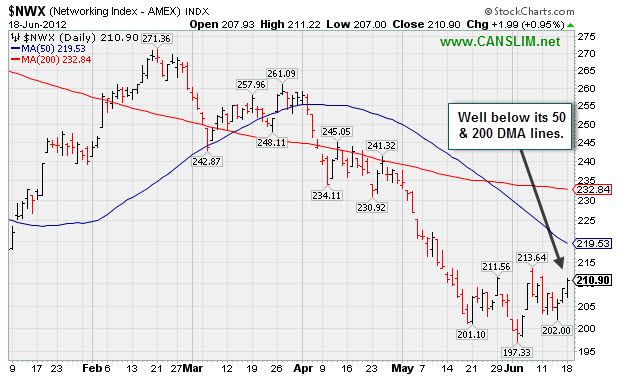
PICTURED: The Networking Index ($NWX +0.95%) is consolidating well below its 50-day and 200-day moving average lines. The poor action in the group is a negative indication for individual networking issues.
| Oil Services |
$OSX |
200.72 |
-2.56 |
-1.26% |
-7.19% |
| Healthcare |
$HMO |
2,253.19 |
+9.51 |
+0.42% |
-1.25% |
| Integrated Oil |
$XOI |
1,139.76 |
-10.57 |
-0.92% |
-7.27% |
| Semiconductor |
$SOX |
380.55 |
+5.40 |
+1.44% |
+4.42% |
| Networking |
$NWX |
210.90 |
+1.99 |
+0.95% |
-1.98% |
| Internet |
$IIX |
301.85 |
+2.39 |
+0.80% |
+7.14% |
| Broker/Dealer |
$XBD |
85.65 |
-1.02 |
-1.18% |
+2.86% |
| Retail |
$RLX |
621.86 |
+6.75 |
+1.10% |
+18.86% |
| Gold & Silver |
$XAU |
167.10 |
+3.01 |
+1.83% |
-7.50% |
| Bank |
$BKX |
44.52 |
-0.20 |
-0.45% |
+13.05% |
| Biotech |
$BTK |
1,462.56 |
+9.82 |
+0.68% |
+34.00% |
|
|
|
 |
New Pivot Point Cited After Orderly Consolidation
Kenneth J. Gruneisen - Passed the CAN SLIM® Master's Exam
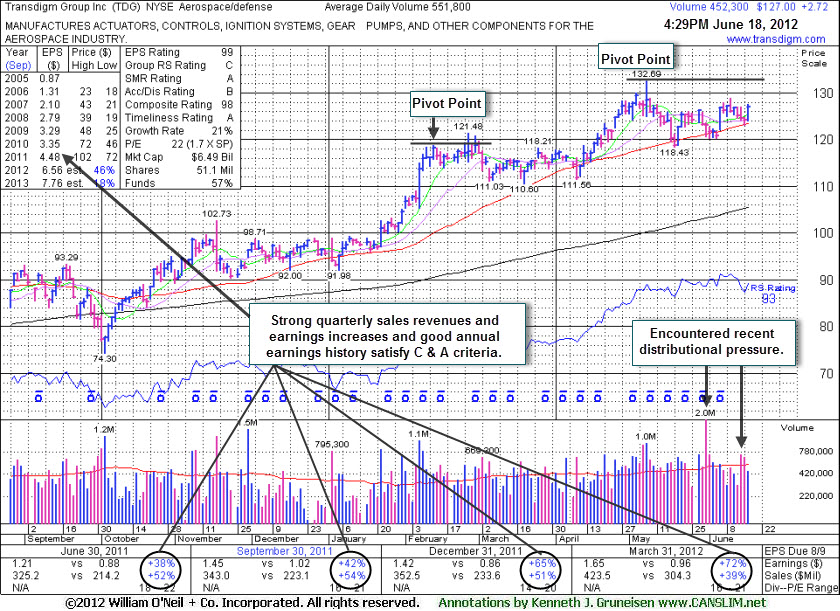
Transdigm Group Inc (TDG +$2.72 or +2.19% to $127.00) has been consolidating above important support at its 50-day moving average (DMA) line while perched within close striking distance of its all-time high. Its color code was changed to yellow with a new pivot point cited based on its 5/08/12 high plus 10 cents. The annotated chart below illustrates that it has endured some recent distributional pressure, and patient investors will watch to see signs of fresh institutional accumulation. Volume-driven gains above the pivot point may trigger a new (or add-on) technical buy signal.
Its prior low ($118.43 on 5/18/12) defines the next important near-term chart support level to watch below its 50 DMA line. The high-ranked Aerospace/Defense firm's last appearance in this FSU section was on 5/23/12 with an annotated graph under the headline, "Prior Highs and 50-Day Moving Average Acted as Support". It had failed to break out when an advanced "3-weeks tight" base pattern had recently been cited. After finding support near the 50 DMA line, volume-driven gains in April and May lifted it to new high territory before it began its current 7-week consolidation.
The number of top-rated funds owning its share rose from 364 in Mar '11 to 420 in Mar '12, a reassuring trend concerning the I criteria. It reported earnings +72% on +39% sales revenues for the quarter ended March 31, 2012 versus the year ago period. That marked another increase in a streak of accelerating earnings comparisons above the +25% minimum guideline for earnings growth (solidly satisfying the C criteria). Its strong annual earnings history also satisfies the A criteria. In recent years it had rebounded and rallied to new highs following a deep consolidation after it was dropped from the Featured Stocks list 1/17/08. Members may review prior analysis via the "view all notes" link on any stocks highlighted in CANSLIM.net reports.
|
|
|
Color Codes Explained :
Y - Better candidates highlighted by our
staff of experts.
G - Previously featured
in past reports as yellow but may no longer be buyable under the
guidelines.
***Last / Change / Volume data in this table is the closing quote data***
Symbol/Exchange
Company Name
Industry Group |
PRICE |
CHANGE
(%Change) |
Day High |
Volume
(% DAV)
(% 50 day avg vol) |
52 Wk Hi
% From Hi |
Featured
Date |
Price
Featured |
Pivot Featured |
|
Max Buy |
ALXN
-
NASDAQ
Alexion Pharmaceuticals
DRUGS - Drug Manufacturers - Other
|
$94.06
|
+0.75
0.80% |
$94.34
|
1,419,330
68.61% of 50 DAV
50 DAV is 2,068,600
|
$95.01
-1.00%
|
5/1/2012
|
$91.73
|
PP = $95.11
|
|
MB = $99.87
|
Most Recent Note - 6/15/2012 8:38:47 PM
Y - Posted a small gain today with above average volume. Encountering resistance in the $94-95 area, but little overhead supply remains to hinder its progress. It is perched within close striking distance of its pivot point and near its 52-week high.
>>> The latest Featured Stock Update with an annotated graph appeared on 5/31/2012. Click here.
View all notes |
Alert me of new notes |
CANSLIM.net Company Profile |
SEC |
Zacks Reports |
StockTalk |
News |
Chart |
Request a new note
C
A N
S L
I M


|
ASPS
-
NASDAQ
Altisource Ptf Sltns Sa
REAL ESTATE - Property Management/Developmen
|
$70.37
|
+2.97
4.41% |
$70.47
|
210,550
155.96% of 50 DAV
50 DAV is 135,000
|
$67.56
4.16%
|
6/5/2012
|
$60.01
|
PP = $63.00
|
|
MB = $66.15
|
 Most Recent Note - 6/18/2012 5:07:34 PM
G - Hit a new 52-week high and finished near the session high with today's gain backed by above average volume. Prior highs in the $65 area define initial support to watch on pullbacks, meanwhile it is getting extended from its prior base.
>>> The latest Featured Stock Update with an annotated graph appeared on 6/5/2012. Click here.
View all notes |
Alert me of new notes |
CANSLIM.net Company Profile |
SEC |
Zacks Reports |
StockTalk |
News |
Chart |
Request a new note
C
A N
S L
I M
|
CERN
-
NASDAQ
Cerner Corp
COMPUTER SOFTWARE and SERVICES - Healthcare Information Service
|
$85.96
|
+3.32
4.02% |
$86.75
|
3,529,409
274.51% of 50 DAV
50 DAV is 1,285,700
|
$84.10
2.21%
|
6/7/2012
|
$78.36
|
PP = $84.20
|
|
MB = $88.41
|
Most Recent Note - 6/18/2012 5:05:17 PM
Y - Hit a new high today with a solid volume-driven gain above its pivot point triggering a new (or add-on) technical buy signal. No resistance remains due to overhead supply.
>>> The latest Featured Stock Update with an annotated graph appeared on 6/7/2012. Click here.
View all notes |
Alert me of new notes |
CANSLIM.net Company Profile |
SEC |
Zacks Reports |
StockTalk |
News |
Chart |
Request a new note
C
A N
S L
I M
|
CMCSA
-
NASDAQ
Comcast Corp Cl A
MEDIA - CATV Systems
|
$31.16
|
+0.07
0.23% |
$31.41
|
12,163,617
88.57% of 50 DAV
50 DAV is 13,732,900
|
$31.17
-0.03%
|
6/11/2012
|
$29.94
|
PP = $30.98
|
|
MB = $32.53
|
Most Recent Note - 6/15/2012 8:34:40 PM
Y - Hit a new 52-week high today with +55% above average volume while rising above the new pivot point recently cited triggering a technical buy signal. The prior low ($28.09 on 5/21/12) defines important near-term support to watch.
>>> The latest Featured Stock Update with an annotated graph appeared on 6/11/2012. Click here.
View all notes |
Alert me of new notes |
CANSLIM.net Company Profile |
SEC |
Zacks Reports |
StockTalk |
News |
Chart |
Request a new note
C
A N
S L
I M
|
DG
-
NYSE
Dollar General Corp
RETAIL - Discount, Variety Stores
|
$51.63
|
-0.56
-1.07% |
$52.25
|
3,943,220
118.75% of 50 DAV
50 DAV is 3,320,700
|
$52.19
-1.07%
|
5/7/2012
|
$48.51
|
PP = $47.69
|
|
MB = $50.07
|
Most Recent Note - 6/15/2012 8:35:33 PM
G - Rallied with above average volume to a new all-time high and closed at the session high. Completed another Secondary Offering on 6/05/12, its 4th Secondary Offering since September '11.
>>> The latest Featured Stock Update with an annotated graph appeared on 6/12/2012. Click here.
View all notes |
Alert me of new notes |
CANSLIM.net Company Profile |
SEC |
Zacks Reports |
StockTalk |
News |
Chart |
Request a new note
C
A N
S L
I M
|
Symbol/Exchange
Company Name
Industry Group |
PRICE |
CHANGE
(%Change) |
Day High |
Volume
(% DAV)
(% 50 day avg vol) |
52 Wk Hi
% From Hi |
Featured
Date |
Price
Featured |
Pivot Featured |
|
Max Buy |
EXPE
-
NASDAQ
Expedia Inc
INTERNET - Internet Information Providers
|
$49.96
|
-0.09
-0.18% |
$50.66
|
4,508,166
99.26% of 50 DAV
50 DAV is 4,541,900
|
$50.23
-0.54%
|
4/27/2012
|
$41.80
|
PP = $35.57
|
|
MB = $37.35
|
Most Recent Note - 6/15/2012 8:01:47 PM
G - Powered to a new 52-week high today with a solid gain backed by above average volume. It is extended from its prior highs in the $43 area which define initial support above its 50 DMA line.
>>> The latest Featured Stock Update with an annotated graph appeared on 6/8/2012. Click here.
View all notes |
Alert me of new notes |
CANSLIM.net Company Profile |
SEC |
Zacks Reports |
StockTalk |
News |
Chart |
Request a new note
C
A N
S L
I M
|
GNC
-
NYSE
G N C Holdings Inc
RETAIL - Drug Stores
|
$35.20
|
-0.22
-0.62% |
$35.40
|
4,270,517
213.07% of 50 DAV
50 DAV is 2,004,300
|
$41.95
-16.09%
|
1/19/2012
|
$28.99
|
PP = $29.60
|
|
MB = $31.08
|
Most Recent Note - 6/15/2012 8:41:04 PM
G - Loss today on heavy volume led to a slump further below its 50 DMA line and undercut recent lows raising more serious concerns, yet it finished near the middle of its intra-day range.
>>> The latest Featured Stock Update with an annotated graph appeared on 6/6/2012. Click here.
View all notes |
Alert me of new notes |
CANSLIM.net Company Profile |
SEC |
Zacks Reports |
StockTalk |
News |
Chart |
Request a new note
C
A N
S L
I M
|
MLNX
-
NASDAQ
Mellanox Technologies
ELECTRONICS - Semiconductor - Broad Line
|
$71.53
|
+4.80
7.19% |
$73.35
|
1,659,312
281.86% of 50 DAV
50 DAV is 588,700
|
$68.48
4.45%
|
6/18/2012
|
$70.90
|
PP = $67.30
|
|
MB = $70.67
|
Most Recent Note - 6/18/2012
Y - Gapped up today, hitting a 52-week high, rising from an 9-week cup-shaped base without a handle. Color code is changed to yellow with pivot point cited based on its 4/19/12 high plus 10 cents. It stayed well above its 50 DMA line during the latest consolidation. Reported earnings +113% on +61% sales revenues for the quarter ended March 31, 2012 versus the year ago period. Its streak of 3 strong quarterly earnings comparisons now satisfies the C criteria. A downturn in FY '09 earnings is a small flaw in its annual earnings (A criteria) history. Gapped up on 4/17/12 for a new all-time high following an analyst upgrade. Top-rated funds owning its shares rose from 108 in Jun '11 to 177 in Mar '12 a reassuring sign concerning the I criteria.

There are no Featured Stock Updates™ available for this stock at this time. You may request one by clicking the Request a New Note link below
View all notes |
Alert me of new notes |
CANSLIM.net Company Profile |
SEC |
Zacks Reports |
StockTalk |
News |
Chart |
Request a new note
C
A N
S L
I M
|
NTES
-
NASDAQ
Netease Inc Adr
INTERNET - Internet Information Providers
|
$61.07
|
+0.82
1.36% |
$61.64
|
522,024
73.96% of 50 DAV
50 DAV is 705,800
|
$65.54
-6.82%
|
3/19/2012
|
$56.18
|
PP = $55.10
|
|
MB = $57.86
|
Most Recent Note - 6/12/2012 2:09:17 PM
G - Pulling back from its 52-week high with a 3rd consecutive loss today on lighter than average volume. Its 50 DMA line defines near-term support and prior lows near the $55 area define the next important chart support to watch where violations may trigger a worrisome technical sell signals.
>>> The latest Featured Stock Update with an annotated graph appeared on 5/24/2012. Click here.
View all notes |
Alert me of new notes |
CANSLIM.net Company Profile |
SEC |
Zacks Reports |
StockTalk |
News |
Chart |
Request a new note
C
A N
S L
I M
|
SWI
-
NYSE
Solarwinds Inc
COMPUTER SOFTWARE and SERVICES - Application Software
|
$46.56
|
+1.43
3.17% |
$47.00
|
1,252,852
123.09% of 50 DAV
50 DAV is 1,017,800
|
$48.64
-4.28%
|
4/26/2012
|
$45.15
|
PP = $42.32
|
|
MB = $44.44
|
Most Recent Note - 6/18/2012 5:10:37 PM
Y - Posted a 3rd consecutive gain today with ever increasing volume. Color code was changed to yellow while no new pivot point was cited, yet it was noted that a valid secondary buy point exists up to +5% above the recent high. Its 50 DMA line and the 6/04/11 low ($41.24) define important support top watch on pullbacks.
>>> The latest Featured Stock Update with an annotated graph appeared on 6/15/2012. Click here.
View all notes |
Alert me of new notes |
CANSLIM.net Company Profile |
SEC |
Zacks Reports |
StockTalk |
News |
Chart |
Request a new note
C
A N
S L
I M
|
Symbol/Exchange
Company Name
Industry Group |
PRICE |
CHANGE
(%Change) |
Day High |
Volume
(% DAV)
(% 50 day avg vol) |
52 Wk Hi
% From Hi |
Featured
Date |
Price
Featured |
Pivot Featured |
|
Max Buy |
SXCI
-
NASDAQ
S X C Health Solutions
COMPUTER SOFTWARE and SERVICES - Healthcare Information Service
|
$98.56
|
+3.83
4.04% |
$99.51
|
1,428,980
115.79% of 50 DAV
50 DAV is 1,234,100
|
$100.50
-1.93%
|
6/14/2012
|
$94.71
|
PP = $100.60
|
|
MB = $105.63
|
Most Recent Note - 6/18/2012 5:11:59 PM
Y - Tallied a 3rd consecutive gain today and approached its 52-week high. Color code was changed to yellow with new pivot point cited based on its 4/20/12 high plus 10 cents. Subsequent volume-driven gains may trigger a buy signal. Its 50 DMA line defines important support for chart readers.
>>> The latest Featured Stock Update with an annotated graph appeared on 6/14/2012. Click here.
View all notes |
Alert me of new notes |
CANSLIM.net Company Profile |
SEC |
Zacks Reports |
StockTalk |
News |
Chart |
Request a new note
C
A N
S L
I M
|
TDG
-
NYSE
Transdigm Group Inc
AEROSPACE/DEFENSE - Aerospace/Defense Products and; Services
|
$127.00
|
+2.72
2.19% |
$127.51
|
452,314
81.97% of 50 DAV
50 DAV is 551,800
|
$132.69
-4.29%
|
6/18/2012
|
$127.00
|
PP = $132.79
|
|
MB = $139.43
|
Most Recent Note - 6/18/2012 5:04:06 PM
Y - Consolidating above important support at its 50 DMA line while perched within close striking distance of its all-time high. Color code is changed to yellow with new pivot point cited. Subsequent volume-driven gains above the pivot point may trigger a new (or add-on) technical buy signal. Its prior low ($118.43 on 5/18/12) defines the next important near-term chart support level to watch. See the latest FSU analysis for more details and a new annotated graph.
>>> The latest Featured Stock Update with an annotated graph appeared on 6/18/2012. Click here.
View all notes |
Alert me of new notes |
CANSLIM.net Company Profile |
SEC |
Zacks Reports |
StockTalk |
News |
Chart |
Request a new note
C
A N
S L
I M
|
UA
-
NYSE
Under Armour Inc Cl A
CONSUMER NON-DURABLES - Textile - Apparel Clothing
|
$106.08
|
+0.33
0.31% |
$106.45
|
585,225
58.95% of 50 DAV
50 DAV is 992,700
|
$107.15
-1.00%
|
2/15/2012
|
$85.77
|
PP = $84.86
|
|
MB = $89.10
|
Most Recent Note - 6/15/2012 8:29:32 PM
G - Rallied with above average volume today for its second best close ever. It was previously noted - "No resistance remains due to overhead supply. Fundamental concerns remain after a slightly sub par earnings increase in the Dec '11 quarter."
>>> The latest Featured Stock Update with an annotated graph appeared on 5/29/2012. Click here.
View all notes |
Alert me of new notes |
CANSLIM.net Company Profile |
SEC |
Zacks Reports |
StockTalk |
News |
Chart |
Request a new note
C
A N
S L
I M
|
VSI
-
NYSE
Vitamin Shoppe Inc
SPECIALTY RETAIL - Specialty Retail, Other
|
$51.19
|
+0.81
1.61% |
$51.76
|
410,275
88.40% of 50 DAV
50 DAV is 464,100
|
$55.29
-7.42%
|
4/25/2012
|
$47.77
|
PP = $48.46
|
|
MB = $50.88
|
Most Recent Note - 6/15/2012 8:31:11 PM
Y - Finished near the session high today with a solid gain on above average volume, finding support above prior highs in the $48 area and above its 50 DMA line which coincide defining important chart support. One may consider a secondary buy point from its successful test of the 10 week average up to +5% above the recent high. Disciplined investors always limit losses by selling if a stock falls more than -7% from their buy price.
>>> The latest Featured Stock Update with an annotated graph appeared on 6/4/2012. Click here.
View all notes |
Alert me of new notes |
CANSLIM.net Company Profile |
SEC |
Zacks Reports |
StockTalk |
News |
Chart |
Request a new note
C
A N
S L
I M
|
WFM
-
NASDAQ
Whole Foods Market Inc
RETAIL - Grocery Stores
|
$95.14
|
+0.67
0.71% |
$95.69
|
2,013,336
106.83% of 50 DAV
50 DAV is 1,884,700
|
$95.00
0.15%
|
6/13/2012
|
$89.90
|
PP = $91.60
|
|
MB = $96.18
|
Most Recent Note - 6/15/2012 8:32:58 PM
Y - Rallied to a new 52-week high today with +72% above average volume, confirming a technical buy signal. No resistance remains due to overhead supply. Its 50 DMA line and prior lows define important near-term support.
>>> The latest Featured Stock Update with an annotated graph appeared on 6/13/2012. Click here.
View all notes |
Alert me of new notes |
CANSLIM.net Company Profile |
SEC |
Zacks Reports |
StockTalk |
News |
Chart |
Request a new note
C
A N
S L
I M
|
Symbol/Exchange
Company Name
Industry Group |
PRICE |
CHANGE
(%Change) |
Day High |
Volume
(% DAV)
(% 50 day avg vol) |
52 Wk Hi
% From Hi |
Featured
Date |
Price
Featured |
Pivot Featured |
|
Max Buy |
|
|
|
THESE ARE NOT BUY RECOMMENDATIONS!
Comments contained in the body of this report are technical
opinions only. The material herein has been obtained
from sources believed to be reliable and accurate, however,
its accuracy and completeness cannot be guaranteed.
This site is not an investment advisor, hence it does
not endorse or recommend any securities or other investments.
Any recommendation contained in this report may not
be suitable for all investors and it is not to be deemed
an offer or solicitation on our part with respect to
the purchase or sale of any securities. All trademarks,
service marks and trade names appearing in this report
are the property of their respective owners, and are
likewise used for identification purposes only.
This report is a service available
only to active Paid Premium Members.
You may opt-out of receiving report notifications
at any time. Questions or comments may be submitted
by writing to Premium Membership Services 665 S.E. 10 Street, Suite 201 Deerfield Beach, FL 33441-5634 or by calling 1-800-965-8307
or 954-785-1121.
|
|
|

