You are not logged in.
This means you
CAN ONLY VIEW reports that were published prior to Monday, February 26, 2024.
You
MUST UPGRADE YOUR MEMBERSHIP if you want to see any current reports.
AFTER MARKET UPDATE - THURSDAY, JUNE 16TH, 2022
Previous After Market Report Next After Market Report >>>
|
|
|
|
DOW |
-741.46 |
29,927.07 |
-2.42% |
|
Volume |
1,367,295,485 |
+1% |
|
Volume |
5,657,386,600 |
+6% |
|
NASDAQ |
-453.06 |
10,646.10 |
-4.08% |
|
Advancers |
306 |
10% |
|
Advancers |
905 |
21% |
|
S&P 500 |
-123.22 |
3,666.77 |
-3.25% |
|
Decliners |
2,803 |
90% |
|
Decliners |
3,309 |
79% |
|
Russell 2000 |
-81.30 |
1,649.84 |
-4.70% |
|
52 Wk Highs |
1 |
|
|
52 Wk Highs |
14 |
|
|
S&P 600 |
-55.92 |
1,087.48 |
-4.89% |
|
52 Wk Lows |
1,092 |
|
|
52 Wk Lows |
1,147 |
|
|
The market remains in a correction (M criteria). Discipline and patience remain paramount until a new rally with confirmation marked by a solid follow-through day.
|
 |
Institutional Selling Pressure Brings More Damage
Kenneth J. Gruneisen - Passed the CAN SLIM® Master's Exam
The Dow dropped 741 points, closing below a key psychological level of 30,000 for the first time since January 2021. The S&P 500 slumped 3.3% to its lowest level since December 2020, while the Nasdaq Composite tumbled 4.1%. Volume totals reported were higher than the prior session on the NYSE and on the Nasdaq exchange, indicative of greater institutional selling pressure termed "distribution". Breadth was clearly negative as decliners led advancers by a 9-1 margin on the NYSE and by more than 3-1 on the Nasdaq exchange. Leadership remained very thin as there were only 2 high-ranked companies from the Leaders List that hit new 52-week highs and were listed on the BreakOuts Page, versus the total of 3 on the prior session. New 52-week lows totals expanded and solidly outnumbered shrinking new 52-week highs on the NYSE and on the Nasdaq exchange. The major indices have been in a noted market correction (M criteria).
Chart courtesy of www.stockcharts.com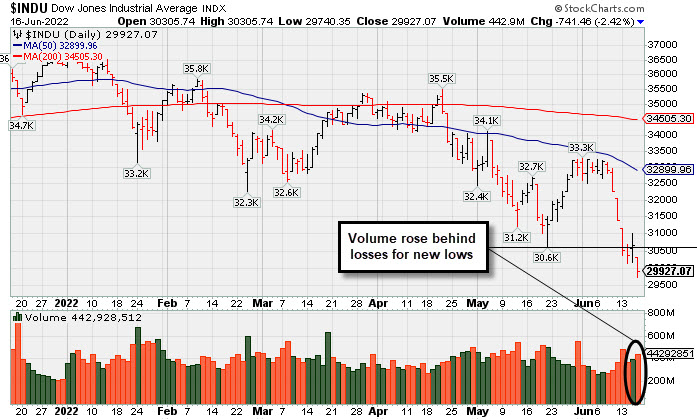 PICTURED: The Dow Jones Industrial Average slumped to a new 2022 low and finished -19% from its January 5, 2022 record high.
All 11 S&P 500 sectors ended in negative territory, with eight groups falling more than 2%. Stocks ended sharply lower on Thursday, reversing a relief rally that came on the heels of the Federal Reserve’s (Fed) policy decision. Treasuries extended their post-Fed advance, with the yield on the 10-year note falling six basis points (0.06%) to 3.24% and the two-year note yield dropping 10 basis points (0.10%) to 3.12%.
Yesterday, the U.S. central bank hiked rates by 75 basis points to a range of 1.50%-1.75%, marking the largest increase since 1994. Stocks snapped a five-day losing streak after Fed Chair Jerome Powell noted outsized moves should not be common during his post-meeting press conference. However, a risk-off mood returned on Thursday amid renewed worries that aggressive action by the Fed to combat inflation could push the U.S. into a recession. Additionally, a notable shift in global monetary policy further dented sentiment. The Swiss National Bank unexpectedly endorsed their first rate hike since 2007, while the Bank of England raised rates for a fifth consecutive time. A gauge of the U.S. dollar slumped 1.4%. Meanwhile, the average rate on a 30-year mortgage loan spiked to 5.78% from 5.23%, its largest one-week increase since 1987.
|
 Kenneth J. Gruneisen started out as a licensed stockbroker in August 1987, a couple of months prior to the historic stock market crash that took the Dow Jones Industrial Average down -22.6% in a single day. He has published daily fact-based fundamental and technical analysis on high-ranked stocks online for two decades. Through FACTBASEDINVESTING.COM, Kenneth provides educational articles, news, market commentary, and other information regarding proven investment systems that work in good times and bad.
Comments contained in the body of this report are technical opinions only and are not necessarily those of Gruneisen Growth Corp. The material herein has been obtained from sources believed to be reliable and accurate, however, its accuracy and completeness cannot be guaranteed. Our firm, employees, and customers may effect transactions, including transactions contrary to any recommendation herein, or have positions in the securities mentioned herein or options with respect thereto. Any recommendation contained in this report may not be suitable for all investors and it is not to be deemed an offer or solicitation on our part with respect to the purchase or sale of any securities. |
|
 |
Energy, Tech, Financial, and Retail Indexes Fell
Kenneth J. Gruneisen - Passed the CAN SLIM® Master's Exam
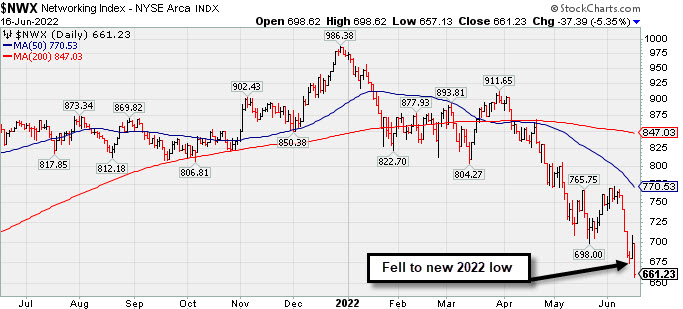
Energy-linked groups were standout decliners as the Oil Services Index ($OSX -5.84%) and Integrated Oil Index ($XOI -6.18%) abruptly retreated. The tech sector saw big losses from the Semiconductor Index ($SOX -6.23%) and Networking Index ($NWX -5.35%) while the Biotech Index ($BTK -2.44%) suffered smaller loss. The Bank Index ($BKX -2.79%), Broker/Dealer Index ($XBD -2.57%), and Retail Index ($RLX -3.27%) each lost ground and weighed on the major averages. Meanwhile, the Gold & Silver Index ($XAU +1.17%) was a standout decliner.
PICTURED: The Networking Index ($NWX -5.35%) fell to a new 2022 low.
| Oil Services |
$OSX |
69.14 |
-4.29 |
-5.84% |
+31.14% |
| Integrated Oil |
$XOI |
1,608.04 |
-105.96 |
-6.18% |
+36.48% |
| Semiconductor |
$SOX |
2,566.86 |
-170.69 |
-6.23% |
-34.95% |
| Networking |
$NWX |
661.23 |
-37.39 |
-5.35% |
-31.91% |
| Broker/Dealer |
$XBD |
368.68 |
-9.73 |
-2.57% |
-24.27% |
| Retail |
$RLX |
2,788.78 |
-94.38 |
-3.27% |
-34.02% |
| Gold & Silver |
$XAU |
123.32 |
+1.42 |
+1.17% |
-6.89% |
| Bank |
$BKX |
99.66 |
-2.86 |
-2.79% |
-24.63% |
| Biotech |
$BTK |
4,213.42 |
-105.37 |
-2.44% |
-23.65% |
|
|
|
 |
|
|
|
Color Codes Explained :
Y - Better candidates highlighted by our
staff of experts.
G - Previously featured
in past reports as yellow but may no longer be buyable under the
guidelines.
***Last / Change / Volume data in this table is the closing quote data***
Symbol/Exchange
Company Name
Industry Group |
PRICE |
CHANGE
(%Change) |
Day High |
Volume
(% DAV)
(% 50 day avg vol) |
52 Wk Hi
% From Hi |
Featured
Date |
Price
Featured |
Pivot Featured |
|
Max Buy |
 PAG
-
NYSE
PAG
-
NYSE
Penske Automotive Grp
Retail/Whlsle-Automobile
|
$102.48
|
-11.56
-10.14% |
$111.51
|
450,676
126.24% of 50 DAV
50 DAV is 357,000
|
$123.60
-17.09%
|
5/13/2022
|
$114.88
|
PP = $114.57
|
|
MB = $120.30
|
 Most Recent Note - 6/16/2022 5:08:02 PM
G - Abruptly retreated violating its 50 DMA line and 200 DMA lines triggering a technical sell signal with today's damaging volume-driven loss and its color code is changed to green. Only a prompt rebound above the 50 DMA line ($108) would help its outlook improve.
>>> FEATURED STOCK ARTICLE : Penske Perched at High With No Resistance Remaining - 6/2/2022 |
View all notes |
Set NEW NOTE alert |
Company Profile |
SEC
News |
Chart |
Request a new note
C
A
S
I |
LLY
-
NYSE
Eli Lilly & Co
Medical-Diversified
|
$288.07
|
-4.92
-1.68% |
$290.20
|
2,614,822
88.01% of 50 DAV
50 DAV is 2,971,000
|
$324.08
-11.11%
|
5/16/2022
|
$302.46
|
PP = $314.10
|
|
MB = $329.81
|
Most Recent Note - 6/16/2022 5:16:09 PM
G - Small loss today came with below average volume while slumping further below its 50 DMA line ($298). A rebound above the 50 DMA line is needed for its outlook to improve. The fact-based investment system discourages any new buying until a follow-through day confirms a new market uptrend (M criteria).
>>> FEATURED STOCK ARTICLE : Encountering Distributional Pressure After Reaching New Highs - 6/6/2022 |
View all notes |
Set NEW NOTE alert |
Company Profile |
SEC
News |
Chart |
Request a new note
C
A
S
I |
WCC
-
NYSE
Wesco International Inc
WHOLESALE - Electronics Wholesale
|
$109.84
|
-10.84
-8.98% |
$117.90
|
864,674
171.56% of 50 DAV
50 DAV is 504,000
|
$144.43
-23.95%
|
6/1/2022
|
$128.79
|
PP = $139.10
|
|
MB = $146.06
|
Most Recent Note - 6/16/2022 5:09:57 PM
Today's gap down and volume-driven loss undercut prior the prior low ($112) triggering a worrisome technical sell signal. It will be dropped from the Featured Stocks list tonight. A rebound above the 50 DMA line ($126) is needed for its outlook to improve.
>>> FEATURED STOCK ARTICLE : Big Volume-Driven Gain Helped Technical Stance Improve - 6/1/2022 |
View all notes |
Set NEW NOTE alert |
Company Profile |
SEC
News |
Chart |
Request a new note
C
A
S
I |
COKE
-
NASDAQ
Coca-Cola Consolidated
FOOD and BEVERAGE - Beverages - Soft Drinks
|
$533.60
|
-17.40
-3.16% |
$545.81
|
51,766
126.26% of 50 DAV
50 DAV is 41,000
|
$656.11
-18.67%
|
6/6/2022
|
$629.97
|
PP = $637.49
|
|
MB = $669.36
|
Most Recent Note - 6/16/2022 5:13:17 PM
Today marked the 7th volume-driven loss in the span of 8 sessions and it will be dropped from the Featured Stocks list tonight. Abruptly stalled and encountered distributional pressure after recently hitting a new high. Now it faces resistance due to overhead supply.
>>> FEATURED STOCK ARTICLE : Paused After Hitting New High With Volume-Driven Gains - 6/7/2022 |
View all notes |
Set NEW NOTE alert |
Company Profile |
SEC
News |
Chart |
Request a new note
C
A
S
I |
|
|
|
THESE ARE NOT BUY RECOMMENDATIONS!
Comments contained in the body of this report are technical
opinions only. The material herein has been obtained
from sources believed to be reliable and accurate, however,
its accuracy and completeness cannot be guaranteed.
This site is not an investment advisor, hence it does
not endorse or recommend any securities or other investments.
Any recommendation contained in this report may not
be suitable for all investors and it is not to be deemed
an offer or solicitation on our part with respect to
the purchase or sale of any securities. All trademarks,
service marks and trade names appearing in this report
are the property of their respective owners, and are
likewise used for identification purposes only.
This report is a service available
only to active Paid Premium Members.
You may opt-out of receiving report notifications
at any time. Questions or comments may be submitted
by writing to Premium Membership Services 665 S.E. 10 Street, Suite 201 Deerfield Beach, FL 33441-5634 or by calling 1-800-965-8307
or 954-785-1121.
|
|
|