You are not logged in.
This means you
CAN ONLY VIEW reports that were published prior to Monday, April 14, 2025.
You
MUST UPGRADE YOUR MEMBERSHIP if you want to see any current reports.
AFTER MARKET UPDATE - THURSDAY, JUNE 16TH, 2011
Previous After Market Report Next After Market Report >>>
|
|
|
|
DOW |
+64.25 |
11,961.52 |
+0.54% |
|
Volume |
1,051,078,680 |
-2% |
|
Volume |
1,926,722,520 |
-0% |
|
NASDAQ |
-7.76 |
2,623.70 |
-0.29% |
|
Advancers |
1,342 |
43% |
|
Advancers |
1,330 |
49% |
|
S&P 500 |
+2.22 |
1,267.64 |
+0.18% |
|
Decliners |
1,697 |
54% |
|
Decliners |
1,272 |
47% |
|
Russell 2000 |
+2.08 |
781.54 |
+0.27% |
|
52 Wk Highs |
16 |
|
|
52 Wk Highs |
13 |
|
|
S&P 600 |
+1.46 |
421.11 |
+0.35% |
|
52 Wk Lows |
82 |
|
|
52 Wk Lows |
111 |
|
|
 |
Nasdaq Lagging as Major Averages End Mixed Session
Kenneth J. Gruneisen - Passed the CAN SLIM® Master's Exam
The major averages finished mixed on Thursday. Declining issues beat advancers by 8-7 on the NYSE, while advancing issues held a 13-12 lead on declining issues on the Nasdaq exchange. Volume totals reported on the NYSE and on the Nasdaq exchange were slightly lower than the prior session totals, making it clear that institutional investors were not aggressively buying stocks. New 52-week lows solidly outnumbered new 52-week highs on both the NYSE and on the Nasdaq exchange. Only 2 high-ranked companies from the CANSLIM.net Leaders List made new 52-week highs and appeared on the CANSLIM.net BreakOuts Page, down from 5 on the prior session. There were 7 gainers out of the 15 of the high-ranked leaders currently included on the Featured Stocks Page.
Greece continues to weigh on the U.S. market. European markets declined and the euro dropped further against the dollar as the Greek prime minister asked for a confidence vote amid attempts to win approval for austerity measures.
Better-than-expected housing starts in the U.S. showed an increase that was more than forecast in May, led by a jump in the West. Meanwhile, fewer Americans than forecast filed applications for unemployment benefits last week. The Philadelphia Fed factory index for June dropped to minus -7.7 from a positive reading in May.
Southern Union Co (SUG +17.52%) was up considerably after Energy Transfer Equity LP (ETE +8.22%) agreed to buy the natural gas pipeline company for $4.2 billion. Fiber-optic companies fell after Finisar (FNSR -16.3%) reported earnings that missed estimates.
Home builders, like Lennar (LEN +2.1%), got a boost from the better-than-expected report on housing starts. Citigroup Inc (C -1%) and other high profile financial stocks were in the spotlight on reports international regulators may impose tighter capital surcharges on banks. The Kroger Co (KR +4.5%) rose after the supermarket chain lifted its earnings outlook.
The June 2011 issue of CANSLIM.net News (read here) is now available to all upgraded members. Only UPGRADED members will also have access to the upcoming Q2 2011 Webcast scheduled for Wednesday, June 29th at 8PM EST.
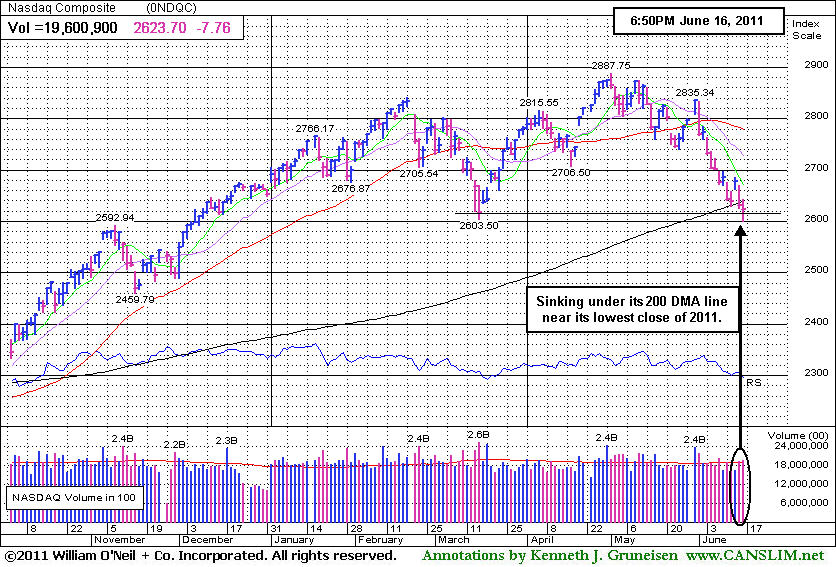
Recent weak action was noted as the market (M criteria) correction caused more worrisome technical damage, reminding investors to raise cash and reduce exposure until a new confirmed rally with follow-through day (FTD) occurs.
PICTURED: The Nasdaq Composite Index is sinking under its 200-day moving average (DMA) line near its lowest close of 2011.
|
 Kenneth J. Gruneisen started out as a licensed stockbroker in August 1987, a couple of months prior to the historic stock market crash that took the Dow Jones Industrial Average down -22.6% in a single day. He has published daily fact-based fundamental and technical analysis on high-ranked stocks online for two decades. Through FACTBASEDINVESTING.COM, Kenneth provides educational articles, news, market commentary, and other information regarding proven investment systems that work in good times and bad.
Comments contained in the body of this report are technical opinions only and are not necessarily those of Gruneisen Growth Corp. The material herein has been obtained from sources believed to be reliable and accurate, however, its accuracy and completeness cannot be guaranteed. Our firm, employees, and customers may effect transactions, including transactions contrary to any recommendation herein, or have positions in the securities mentioned herein or options with respect thereto. Any recommendation contained in this report may not be suitable for all investors and it is not to be deemed an offer or solicitation on our part with respect to the purchase or sale of any securities. |
|
 |
Tech Sector and Gold & Silver Index Weigh Market Down
Kenneth J. Gruneisen - Passed the CAN SLIM® Master's Exam
The tech sector's losses in the afternoon dragged the tech-heavy Nasdaq Composite index into the red as the Semiconductor Index ($SOX -1.15%), Internet Index ($IIX -0.76%), Networking Index ($NWX -0.72%), and Biotechnology Index ($BTK -0.26%) ended Thursday's session unanimously lower. There was a small loss for the Oil Services Index ($OSX -0.36%) while the Integrated Oil Index ($XOI +0.05%) finished flat. The Healthcare Index ($HMO -0.20%) edged lower. The Retail Index ($RLX -0.02%) and the Broker/Dealer Index ($XBD +0.07%) were little changed while the Bank Index ($BKX +0.56%) posted a modest gain.
Charts courtesy www.stockcharts.com
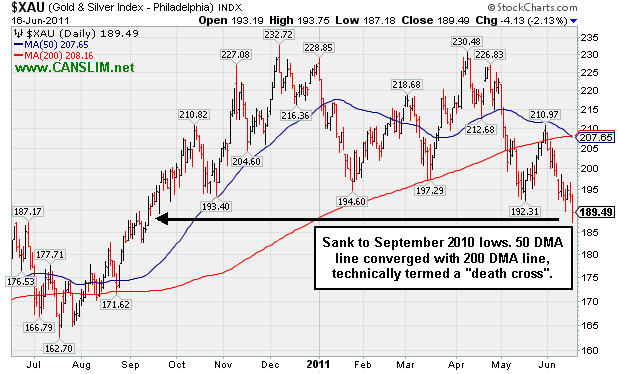
PICTURED: The Gold & Silver Index ($XAU -2.13%) sank to September 2010 lows. Its 50-day moving average (DMA) line converged with its 200 DMA line, technically termed a "death cross".
| Oil Services |
$OSX |
252.06 |
-0.90 |
-0.36% |
+2.83% |
| Healthcare |
$HMO |
2,315.93 |
-4.68 |
-0.20% |
+36.88% |
| Integrated Oil |
$XOI |
1,244.98 |
+0.59 |
+0.05% |
+2.62% |
| Semiconductor |
$SOX |
393.87 |
-4.57 |
-1.15% |
-4.36% |
| Networking |
$NWX |
280.35 |
-2.03 |
-0.72% |
-0.07% |
| Internet |
$IIX |
291.46 |
-2.25 |
-0.76% |
-5.29% |
| Broker/Dealer |
$XBD |
105.87 |
+0.07 |
+0.07% |
-12.87% |
| Retail |
$RLX |
498.86 |
-0.08 |
-0.02% |
-1.87% |
| Gold & Silver |
$XAU |
189.49 |
-4.13 |
-2.13% |
-16.37% |
| Bank |
$BKX |
46.94 |
+0.26 |
+0.56% |
-10.09% |
| Biotech |
$BTK |
1,410.32 |
-3.69 |
-0.26% |
+8.68% |
|
|
|
 |
New Pivot Point Cited After Orderly Consolidation
Kenneth J. Gruneisen - Passed the CAN SLIM® Master's Exam
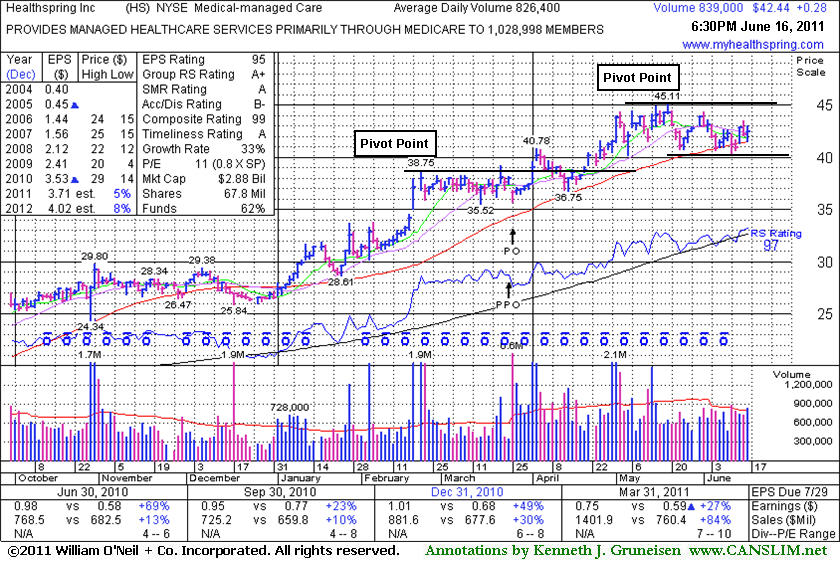
Healthspring Inc (HS +$0.28 or +0.66% to $42.44) posted a small gain today with near average volume while consolidating near its 50-day moving average (DMA) line. That important short-term average and recent lows near $40 define chart support to watch where violations would trigger technical sell signals. Meanwhile, its orderly consolidation is near the minimum length for a new flat base, and its color code is changed to yellow with a new pivot point based on its 52-week high plus 10 cents. A subsequent breakout with well above average volume could trigger a new (or add-on) technical buy signal, however the M criteria still argues against new buying efforts in stocks until a confirmed rally with follow-through day from at least one of the major averages.
After its last appearance in this FSU section on May 20, 2011 with an annotated graph under the headline, "Extended From Sound Base After +126% Rally in 9 Months", it has held its ground stubbornly while enduring mild distributional pressure. Since HS was first featured at $19.91 in the 8/27/10 mid-day report it has traded up as much as +126.56%. Along the way it had paused to form a new base and a new pivot point was noted before it broke out again in January.
The number of top-rated funds owning its shares rose from 437 in June '10 to 519 in March '11, a reassuring sign concerning the I criteria. For the quarter ended March 31, 2011 versus the year earlier period its +84% increase in sales revenues marked an acceleration from +30% and +10% increases in the Sep and Dec '10 quarters, respectively. It has maintained strong earnings increases above the +25% guideline (C criteria) in the latest quarters and other bullish characteristics including high ranks. Street earnings estimates calling for EPS growth only in the +5-8% range in FY '11 and FY '12 remain a concern.
 |
|
|
Color Codes Explained :
Y - Better candidates highlighted by our
staff of experts.
G - Previously featured
in past reports as yellow but may no longer be buyable under the
guidelines.
***Last / Change / Volume data in this table is the closing quote data***
Symbol/Exchange
Company Name
Industry Group |
PRICE |
CHANGE
(%Change) |
Day High |
Volume
(% DAV)
(% 50 day avg vol) |
52 Wk Hi
% From Hi |
Featured
Date |
Price
Featured |
Pivot Featured |
|
Max Buy |
CACC
-
NASDAQ
Credit Acceptance Corp
FINANCIAL SERVICES - Credit Services
|
$78.69
|
+0.67
0.86% |
$78.98
|
27,900
73.61% of 50 DAV
50 DAV is 37,900
|
$82.29
-4.37%
|
6/2/2011
|
$76.10
|
PP = $82.39
|
|
MB = $86.51
|
Most Recent Note - 6/14/2011 12:23:14 PM
G - This high-ranked leader in the Finance - Consumer Loans industry has been consolidating in a tight range near its 50 DMA line. It faces some resistance up through the $82 level due to overhead supply
>>> The latest Featured Stock Update with an annotated graph appeared on 6/6/2011. Click here.
View all notes |
Alert me of new notes |
CANSLIM.net Company Profile |
SEC |
Zacks Reports |
StockTalk |
News |
Chart |
Request a new note
C
A N
S L
I M


|
CEVA
-
NASDAQ
Ceva Inc
ELECTRONICS - Semiconductor - Specialized
|
$29.30
|
-0.76
-2.53% |
$30.37
|
112,010
50.61% of 50 DAV
50 DAV is 221,300
|
$35.60
-17.70%
|
5/25/2011
|
$32.98
|
PP = $32.05
|
|
MB = $33.65
|
 Most Recent Note - 6/16/2011 5:34:32 PM
G - Loss today with lighter volume led to another close further below its 50 DMA line. It has not formed a sound base pattern. Its prior low ($27.82 on 5/17/11) defines the next important chart support level to watch.
>>> The latest Featured Stock Update with an annotated graph appeared on 5/25/2011. Click here.
View all notes |
Alert me of new notes |
CANSLIM.net Company Profile |
SEC |
Zacks Reports |
StockTalk |
News |
Chart |
Request a new note
C
A N
S L
I M
|
CMG
-
NYSE
Chipotle Mexican Grill
LEISURE - Restaurants
|
$271.81
|
-5.49
-1.98% |
$277.30
|
789,064
76.23% of 50 DAV
50 DAV is 1,035,100
|
$295.99
-8.17%
|
4/1/2011
|
$274.00
|
PP = $275.10
|
|
MB = $288.86
|
Most Recent Note - 6/16/2011 5:36:12 PM
G - Small loss today, slumping below its 50 DMA line which has acted as resistance now. It has not formed a sound base pattern. It finished near an upward trendline connecting its July 2010 and May 2011 lows which defines an initial technical support level to watch.
>>> The latest Featured Stock Update with an annotated graph appeared on 6/15/2011. Click here.
View all notes |
Alert me of new notes |
CANSLIM.net Company Profile |
SEC |
Zacks Reports |
StockTalk |
News |
Chart |
Request a new note
C
A N
S L
I M
|
EZPW
-
NASDAQ
Ezcorp Inc Cl A
SPECIALTY RETAIL - Specialty Retail, Other
|
$30.83
|
-0.37
-1.19% |
$31.70
|
294,200
82.87% of 50 DAV
50 DAV is 355,000
|
$33.31
-7.45%
|
6/13/2011
|
$31.18
|
PP = $33.41
|
|
MB = $35.08
|
Most Recent Note - 6/16/2011 5:38:36 PM
Y - Consolidating -7.4% off its 52-week high. Color code was changed to yellow with new pivot point cited following a choppy cup-with-handle base. Recent lows and its 50 DMA line define important nearby chart support. The M criteria argues against new buying efforts without a FTD from at least one of the major averages as confirmation of a new rally.
>>> The latest Featured Stock Update with an annotated graph appeared on 6/13/2011. Click here.
View all notes |
Alert me of new notes |
CANSLIM.net Company Profile |
SEC |
Zacks Reports |
StockTalk |
News |
Chart |
Request a new note
C
A N
S L
I M
|
FCFS
-
NASDAQ
First Cash Financial Svs
SPECIALTY RETAIL - Specialty Retail, Other
|
$39.28
|
-0.34
-0.86% |
$40.37
|
292,993
154.70% of 50 DAV
50 DAV is 189,400
|
$42.36
-7.27%
|
5/31/2011
|
$42.00
|
PP = $40.23
|
|
MB = $42.24
|
Most Recent Note - 6/16/2011 5:39:45 PM
G - Down today on above average volume, slumping toward its 50 DMA line and prior lows. Its color code was changed to green after damaging losses on higher volume negated its latest breakout.
>>> The latest Featured Stock Update with an annotated graph appeared on 5/31/2011. Click here.
View all notes |
Alert me of new notes |
CANSLIM.net Company Profile |
SEC |
Zacks Reports |
StockTalk |
News |
Chart |
Request a new note
C
A N
S L
I M
|
Symbol/Exchange
Company Name
Industry Group |
PRICE |
CHANGE
(%Change) |
Day High |
Volume
(% DAV)
(% 50 day avg vol) |
52 Wk Hi
% From Hi |
Featured
Date |
Price
Featured |
Pivot Featured |
|
Max Buy |
FOSL
-
NASDAQ
Fossil Inc
CONSUMER DURABLES - Recreational Goods, Other
|
$107.53
|
+1.13
1.06% |
$108.38
|
867,607
117.59% of 50 DAV
50 DAV is 737,800
|
$110.61
-2.78%
|
2/1/2011
|
$73.30
|
PP = $74.44
|
|
MB = $78.16
|
Most Recent Note - 6/16/2011 5:41:51 PM
G - Gain today with slightly above average volume for its second best close ever. Inching higher after 5 weeks of trading in a very tight range forming a "late-stage" base. Prior highs near $96 define initial support to watch coinciding with its 50 DMA line.
>>> The latest Featured Stock Update with an annotated graph appeared on 6/7/2011. Click here.
View all notes |
Alert me of new notes |
CANSLIM.net Company Profile |
SEC |
Zacks Reports |
StockTalk |
News |
Chart |
Request a new note
C
A N
S L
I M
|
HS
-
NYSE
Healthspring Inc
HEALTH SERVICES - Health Care Plans
|
$42.44
|
+0.28
0.66% |
$43.03
|
838,997
101.52% of 50 DAV
50 DAV is 826,400
|
$45.11
-5.92%
|
6/16/2011
|
$42.44
|
PP = $45.21
|
|
MB = $47.47
|
Most Recent Note - 6/16/2011 6:37:27 PM
Y - Small gain today with near average volume, consolidating above its 50 DMA line. Color code is changed to yellow with new pivot point cited based on its 52-week high plus 10 cents. The M criteria argues against new buying effort without a follow-through day confirming a new rally. See the latest FSU analysis for more details and a new annotated graph.
>>> The latest Featured Stock Update with an annotated graph appeared on 6/16/2011. Click here.
View all notes |
Alert me of new notes |
CANSLIM.net Company Profile |
SEC |
Zacks Reports |
StockTalk |
News |
Chart |
Request a new note
C
A N
S L
I M
|
INFA
-
NASDAQ
Informatica Corp
COMPUTER SOFTWARE and SERVICES - Business Software and Services
|
$53.54
|
-0.05
-0.09% |
$53.85
|
1,152,901
93.14% of 50 DAV
50 DAV is 1,237,800
|
$59.98
-10.74%
|
3/24/2011
|
$50.04
|
PP = $49.86
|
|
MB = $52.35
|
Most Recent Note - 6/15/2011 7:12:06 PM
G - Small loss today twice average volume, slumping to a close below its 50 DMA line, raising concerns. Gains have lacked volume conviction since it hit a new 52-week high on 6/01/11 and there was a negative reversal noted. This high-ranked Computer Software - Database firm did not form a sound new base pattern.
>>> The latest Featured Stock Update with an annotated graph appeared on 5/24/2011. Click here.
View all notes |
Alert me of new notes |
CANSLIM.net Company Profile |
SEC |
Zacks Reports |
StockTalk |
News |
Chart |
Request a new note
C
A N
S L
I M
|
MWIV
-
NASDAQ
M W I Veterinary Supply
HEALTH SERVICES - Medical Instruments and; Supplies
|
$79.19
|
+0.06
0.08% |
$79.27
|
54,855
63.56% of 50 DAV
50 DAV is 86,300
|
$86.99
-8.97%
|
11/4/2010
|
$61.79
|
PP = $59.60
|
|
MB = $62.58
|
Most Recent Note - 6/14/2011 1:12:42 PM
G - Gains have lacked volume conviction following its 50 DMA line violation, and that important short-term average has now been acting as resistance.
>>> The latest Featured Stock Update with an annotated graph appeared on 6/9/2011. Click here.
View all notes |
Alert me of new notes |
CANSLIM.net Company Profile |
SEC |
Zacks Reports |
StockTalk |
News |
Chart |
Request a new note
C
A N
S L
I M
|
OPNT
-
NASDAQ
Opnet Technologies
INTERNET - Internet Software and Services
|
$36.60
|
+0.23
0.63% |
$37.13
|
70,265
54.51% of 50 DAV
50 DAV is 128,900
|
$42.51
-13.90%
|
5/11/2011
|
$41.21
|
PP = $40.50
|
|
MB = $42.53
|
Most Recent Note - 6/15/2011 5:02:54 PM
G - Gapped down today and its loss on light volume led to its lowest close since 4/12/11. It slumped further below its 50 DMA line, and subsequent deterioration under its prior low would raise more serious concerns.
>>> The latest Featured Stock Update with an annotated graph appeared on 6/10/2011. Click here.
View all notes |
Alert me of new notes |
CANSLIM.net Company Profile |
SEC |
Zacks Reports |
StockTalk |
News |
Chart |
Request a new note
C
A N
S L
I M
|
Symbol/Exchange
Company Name
Industry Group |
PRICE |
CHANGE
(%Change) |
Day High |
Volume
(% DAV)
(% 50 day avg vol) |
52 Wk Hi
% From Hi |
Featured
Date |
Price
Featured |
Pivot Featured |
|
Max Buy |
OTEX
-
NASDAQ
Open Text Corp
INTERNET - Internet Software and Services
|
$58.62
|
-0.67
-1.13% |
$59.04
|
233,231
71.37% of 50 DAV
50 DAV is 326,800
|
$67.08
-12.61%
|
6/1/2011
|
$65.86
|
PP = $67.18
|
|
MB = $70.54
|
Most Recent Note - 6/15/2011 5:05:03 PM
G - This week it halted its losing streak near highs prior to its 3/29/11 breakout. It now faces resistance due to the overhead supply created while trading at higher levels in recent months. Technically, gains above its 50 DMA line are needed for its outlook to improve.
>>> The latest Featured Stock Update with an annotated graph appeared on 6/2/2011. Click here.
View all notes |
Alert me of new notes |
CANSLIM.net Company Profile |
SEC |
Zacks Reports |
StockTalk |
News |
Chart |
Request a new note
C
A N
S L
I M
|
RAX
-
NYSE
Rackspace Hosting Inc
INTERNET - Internet Software and; Services
|
$38.64
|
-1.48
-3.69% |
$40.56
|
2,913,590
164.46% of 50 DAV
50 DAV is 1,771,600
|
$46.50
-16.89%
|
6/3/2011
|
$43.36
|
PP = $46.59
|
|
MB = $48.92
|
Most Recent Note - 6/16/2011 5:32:41 PM
Damaging loss today on above average volume violated the previously noted chart low ($38.84 on 5/12/11) triggering a more worrisome technical sell signal. Only a rebound above its 50 DMA line would help its outlook improve, technically. Based on its deterioration it will be dropped from the Featured Stocks list tonight.
>>> The latest Featured Stock Update with an annotated graph appeared on 6/14/2011. Click here.
View all notes |
Alert me of new notes |
CANSLIM.net Company Profile |
SEC |
Zacks Reports |
StockTalk |
News |
Chart |
Request a new note
C
A N
S L
I M
|
SWI
-
NYSE
Solarwinds Inc
COMPUTER SOFTWARE and SERVICES - Application Software
|
$25.42
|
+0.22
0.87% |
$25.79
|
1,085,855
162.67% of 50 DAV
50 DAV is 667,500
|
$26.68
-4.72%
|
6/7/2011
|
$24.22
|
PP = $25.05
|
|
MB = $26.30
|
Most Recent Note - 6/16/2011 12:29:33 PM
Y - Posting a small gain today following a worrisome negative reversal on 6/15/11 with volume 4 times average after hitting a new 52-week high. Prior resistance in the $24-25 area may now act as an initial support level. Previously noted - "Concerns remain until a follow-through day confirms the broader market (M criteria) is truly favorable."
>>> The latest Featured Stock Update with an annotated graph appeared on 6/8/2011. Click here.
View all notes |
Alert me of new notes |
CANSLIM.net Company Profile |
SEC |
Zacks Reports |
StockTalk |
News |
Chart |
Request a new note
C
A N
S L
I M
|
ULTA
-
NASDAQ
Ulta Salon Cosm & Frag
SPECIALTY RETAIL - Specialty Retail, Other
|
$56.88
|
-0.15
-0.26% |
$58.20
|
893,162
128.05% of 50 DAV
50 DAV is 697,500
|
$59.40
-4.24%
|
1/6/2011
|
$36.12
|
PP = $37.34
|
|
MB = $39.21
|
Most Recent Note - 6/16/2011 12:38:24 PM
G - Perched near its all-time high, extended from any sound base pattern. The M criteria argues against new buying efforts in stocks until a new confirmed rally with follow-through day from at least one of the major averages.
>>> The latest Featured Stock Update with an annotated graph appeared on 5/26/2011. Click here.
View all notes |
Alert me of new notes |
CANSLIM.net Company Profile |
SEC |
Zacks Reports |
StockTalk |
News |
Chart |
Request a new note
C
A N
S L
I M
|
ZAGG
-
NASDAQ
Zagg Inc
SPECIALTY RETAIL - Specialty Retail, Other
|
$12.34
|
+0.19
1.56% |
$12.80
|
1,564,288
125.09% of 50 DAV
50 DAV is 1,250,500
|
$13.05
-5.44%
|
6/1/2011
|
$10.92
|
PP = $10.59
|
|
MB = $11.12
|
Most Recent Note - 6/16/2011 11:45:35 AM
G - Up today, getting more extended from the previously noted cup-with-handle type base pattern. Its recent low ($10.15 on 6/07/11) now defines an important near-term chart support level to watch on pullbacks.
>>> The latest Featured Stock Update with an annotated graph appeared on 6/1/2011. Click here.
View all notes |
Alert me of new notes |
CANSLIM.net Company Profile |
SEC |
Zacks Reports |
StockTalk |
News |
Chart |
Request a new note
C
A N
S L
I M
|
Symbol/Exchange
Company Name
Industry Group |
PRICE |
CHANGE
(%Change) |
Day High |
Volume
(% DAV)
(% 50 day avg vol) |
52 Wk Hi
% From Hi |
Featured
Date |
Price
Featured |
Pivot Featured |
|
Max Buy |
|
|
|
THESE ARE NOT BUY RECOMMENDATIONS!
Comments contained in the body of this report are technical
opinions only. The material herein has been obtained
from sources believed to be reliable and accurate, however,
its accuracy and completeness cannot be guaranteed.
This site is not an investment advisor, hence it does
not endorse or recommend any securities or other investments.
Any recommendation contained in this report may not
be suitable for all investors and it is not to be deemed
an offer or solicitation on our part with respect to
the purchase or sale of any securities. All trademarks,
service marks and trade names appearing in this report
are the property of their respective owners, and are
likewise used for identification purposes only.
This report is a service available
only to active Paid Premium Members.
You may opt-out of receiving report notifications
at any time. Questions or comments may be submitted
by writing to Premium Membership Services 665 S.E. 10 Street, Suite 201 Deerfield Beach, FL 33441-5634 or by calling 1-800-965-8307
or 954-785-1121.
|
|
|

