You are not logged in.
This means you
CAN ONLY VIEW reports that were published prior to Monday, April 14, 2025.
You
MUST UPGRADE YOUR MEMBERSHIP if you want to see any current reports.
AFTER MARKET UPDATE - WEDNESDAY, JUNE 16TH, 2010
Previous After Market Report Next After Market Report >>>
|
|
|
|
DOW |
+4.69 |
10,409.46 |
+0.05% |
|
Volume |
1,171,293,710 |
+1% |
|
Volume |
1,856,916,430 |
-15% |
|
NASDAQ |
+0.05 |
2,305.93 |
+0.00% |
|
Advancers |
1,233 |
39% |
|
Advancers |
1,082 |
39% |
|
S&P 500 |
-0.62 |
1,114.61 |
-0.06% |
|
Decliners |
1,832 |
58% |
|
Decliners |
1,579 |
57% |
|
Russell 2000 |
-2.64 |
666.13 |
-0.39% |
|
52 Wk Highs |
54 |
|
|
52 Wk Highs |
58 |
|
|
S&P 600 |
-1.75 |
354.89 |
-0.49% |
|
52 Wk Lows |
27 |
|
|
52 Wk Lows |
28 |
|
|
 |
Major Averages Shrug Off Lukewarm Economic Data
Adam Sarhan, Contributing Writer,
The major averages traded between positive and negative territory and finished mixed after BP Plc (BP +1.43%) said it plans to create a $20 billion fund to pay for damages from the oil spill and investors digested the latest round of lukewarm economic data. The volume total was reported lower on the NYSE, and near the prior session total on the Nasdaq exchange, which signaled that large institutions were not aggressively selling stocks. Breadth was negative as decliners led advancers by about a 3-to-2 ratio on the NYSE and on the Nasdaq exchange. There were 35 high-ranked companies from the CANSLIM.net Leaders List that made a new 52-week high and appeared on the CANSLIM.net BreakOuts Page, lower than the 37 issues that appeared on the prior session. New 52-week highs outnumbered new 52-week lows on the NYSE and on the Nasdaq exchange.
Before Wednesday's opening bell, the Commerce Department said housing starts slid -10%, the largest decline since March 2009, to a 593,000 annual rate. This was was lower from a revised 659,000 pace in April and was less than analyst estimates. Meanwhile, building permits, a sign of future construction, unexpectedly fell to a one-year low and single-family starts suffered the largest decline since 1991. The weaker than expected housing data coupled with the sharp two month sell-off in many housing names raises the likelihood of a double dip decline in the ailing housing market. Separately, Fannie Mae (FNM -39.15%)and Freddie Mac (FRE -38.28%) plunged after their regulator told the two mortgage-finance companies to delist their stock from the New York Stock Exchange. Finally, the produce price index (PPI) was released on Wednesday, and it did not spook investors. It is usually an encouraging sign when the market is resilient enough to shrug off disappointing news headlines.
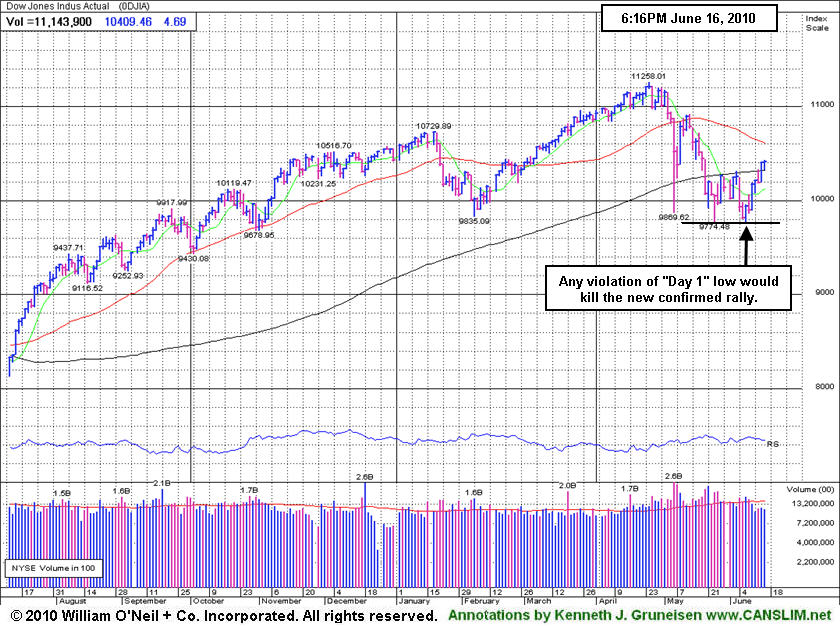
The major averages confirmed their latest rally attempt on Tuesday, June 15, 2010 when they produced a sound follow-through day. Looking forward, the window is now open for disciplined investors to begin carefully buying high-ranked stocks again. Technically, it was encouraging to also see the Dow Jones Industrial Average and the benchmark S&P 500 Index rally above their respective 200-day moving average (DMA) lines. Looking forward, the 200 DMA line should now act as support as this market continues advancing, while any reversal would be a worrisome sign.
Remember to remain very selective because all of the major averages are still trading below their downward sloping 50 DMA lines. It was somewhat disconcerting to see volume remain light (below average) behind the confirming gains. It is important to note that approximately 75% of FTDs lead to new sustained rallies, while 25% fail. In addition, every major rally in market history has begun with a FTD, but not every FTD leads to a new rally. Trade accordingly.
Are You Ready For This NEW Confirmed Rally?
Inquire Today About Our Professional Money Management Services:
If your portfolio is greater than $100,000 and you would like a free portfolio review, click here to get connected with one of our portfolio managers. ** Serious inquires only, please.
PICTURED: The Dow Jones Industrial Average has recently rallied back above its long-term 200 DMA line. Any subsequent violation of its "Day 1" low would kill the new confirmed rally.
|
|
|
 |
Mixed Group Action With No Standout Gainers
Kenneth J. Gruneisen - Passed the CAN SLIM® Master's Exam
The Retail Index ($RLX -0.79%) slumped on Wednesday, and weakness in the Networking Index ($NWX -1.02%) and Biotechnology Index ($BTK -0.92%) created a drag on the tech sector while the Semiconductor Index ($SOX +0.44%) and Internet Index ($IIX +0.15%) posted small gains. The Bank Index ($BKX +0.02%) held its ground and the Broker/Dealer Index ($XBD +0.24%) edged higher. Energy-related shares showed little direction as the Integrated Oil Index ($XOI +0.17%) inched higher and the Oil Services Index ($OSX -0.12%) edged lower. The Healthcare Index ($HMO +0.20%) also tacked on a tiny gain.
Charts courtesy www.stockcharts.com
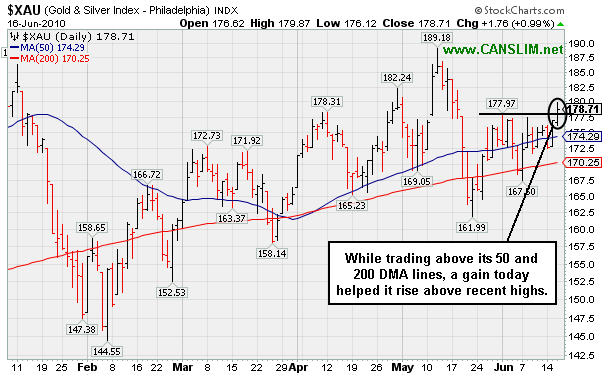
PICTURED: The Gold & Silver Index ($XAU +0.99%) is trading above its 50 and 200-day moving average (DMA) lines and rose above recent highs with its latest gain.
| Oil Services |
$OSX |
179.48 |
-0.21 |
-0.12% |
-7.92% |
| Healthcare |
$HMO |
1,535.86 |
+3.12 |
+0.20% |
+4.27% |
| Integrated Oil |
$XOI |
970.16 |
+1.69 |
+0.17% |
-9.18% |
| Semiconductor |
$SOX |
373.09 |
+1.62 |
+0.44% |
+3.66% |
| Networking |
$NWX |
237.43 |
-2.46 |
-1.02% |
+2.75% |
| Internet |
$IIX |
244.29 |
+0.35 |
+0.15% |
+4.46% |
| Broker/Dealer |
$XBD |
107.69 |
+0.26 |
+0.24% |
-6.40% |
| Retail |
$RLX |
438.20 |
-3.49 |
-0.79% |
+6.59% |
| Gold & Silver |
$XAU |
178.71 |
+1.76 |
+0.99% |
+6.22% |
| Bank |
$BKX |
49.88 |
+0.01 |
+0.02% |
+16.79% |
| Biotech |
$BTK |
1,084.67 |
-10.11 |
-0.92% |
+15.13% |
|
|
|
 |
Volume Barely Met Guideline Behind Breakout Gain
Kenneth J. Gruneisen - Passed the CAN SLIM® Master's Exam
Often, when a leading stock is setting up to breakout of a solid base it is highlighted in CANSLIM.net's Mid-Day Breakouts Report. The most relevant factors are noted in the report which allows prudent CANSLIM oriented investors to place the issue in their watch list. After doing any necessary backup research, the investor is prepared to act if and when the stock triggers a technical buy signal (breaks above its pivot point on more than +50% average turnover). In the event the stock fails to trigger a technical buy signal and its price declines then it will simply be removed from the watch list.
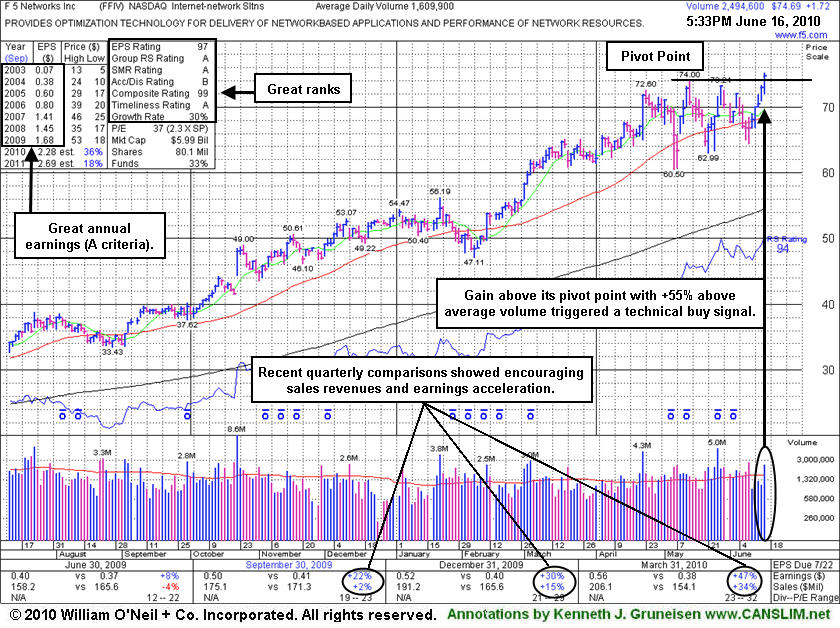
F5 Networks Inc. (FFIV +$1.72 or +2.36% to $74.69) posted a gain today with +55% above average volume that helped it reach a new all-time high and trigger a technical buy signal with its breakout from a flat base of about 5-weeks. It was featured in today's mid-day report (read here) as its color code was changed to yellow with a pivot point based upon its 5/13/10 high plus ten cents. When stocks clear all prior chart highs they are free of resistance due to overhead supply, and then the path of least resistance is more likely to lead them even higher. As always, stocks should be sold if the price ever falls 7-8% below your purchase price, as that is the "max loss" guideline for properly protecting your capital.
The company currently sports a very healthy Earnings Per Share (EPS) rating of 97 and a Relative Strength (RS) rating of 94. It resides in the Internet-networking Solutions group which is an Industry Group showing lots of leadership, satisfying the "L" criteria. In recent months FFIV made a number of appearances in the mid-day report as its quarterly sales and earnings results showed impressive acceleration in the Mar '10 and Dec '09 periods, but it was also noted that it had not formed an ideal base pattern and patience was needed. The high-ranked Internet- Network Solutions industry group leader maintained a good annual earnings (A criteria) history. This stock was first featured in the January 2004 edition of CANSLIM.net News (read here) with a $26.85 pivot point. During the past 6 years, FFIV has built several bases, and it has also been through some tough consolidation periods.
|
|
|
Color Codes Explained :
Y - Better candidates highlighted by our
staff of experts.
G - Previously featured
in past reports as yellow but may no longer be buyable under the
guidelines.
***Last / Change / Volume data in this table is the closing quote data***
Symbol/Exchange
Company Name
Industry Group |
PRICE |
CHANGE
(%Change) |
Day High |
Volume
(% DAV)
(% 50 day avg vol) |
52 Wk Hi
% From Hi |
Featured
Date |
Price
Featured |
Pivot Featured |
|
Max Buy |
APEI
-
NASDAQ
American Public Educ Inc
DIVERSIFIED SERVICES - Education and Training Services
|
$47.31
|
+1.03
2.23% |
$47.91
|
196,012
121.90% of 50 DAV
50 DAV is 160,800
|
$48.26
-1.97%
|
6/7/2010
|
$46.60
|
PP = $46.29
|
|
MB = $48.60
|
 Most Recent Note - 6/16/2010 4:16:58 PM
Y - Gapped down and slumped near its 50 DMA line again today, then positively reversed and closed with a solid gain.
>>> The latest Featured Stock Update with an annotated graph appeared on 6/14/2010. Click here.
View all notes |
Alert me of new notes |
CANSLIM.net Company Profile |
SEC |
Zacks Reports |
StockTalk |
News |
Chart |
Request a new note
C
A N
S L
I M


|
BIDU
-
NASDAQ
Baidu Inc Ads
INTERNET - Internet Information Providers
|
$74.81
|
-0.56
-0.74% |
$76.73
|
9,774,077
64.62% of 50 DAV
50 DAV is 15,126,200
|
$82.29
-9.09%
|
1/13/2010
|
$43.13
|
PP = $42.68
|
|
MB = $44.81
|
Most Recent Note - 6/16/2010 5:05:04 PM
G - Quietly consolidating above its 50 DMA line within -10% of its 52-week high. A worrisome negative reversal from its all-time high on 5/13/10 followed a 10:1 stock split.
>>> The latest Featured Stock Update with an annotated graph appeared on 6/1/2010. Click here.
View all notes |
Alert me of new notes |
CANSLIM.net Company Profile |
SEC |
Zacks Reports |
StockTalk |
News |
Chart |
Request a new note
C
A N
S L
I M
|
BRLI
-
NASDAQ
Bio Reference Labs Inc
HEALTH SERVICES - Medical Laboratories and Researc
|
$23.18
|
-0.39
-1.65% |
$23.55
|
103,514
54.86% of 50 DAV
50 DAV is 188,700
|
$24.67
-6.05%
|
6/15/2010
|
$23.57
|
PP = $24.77
|
|
MB = $26.01
|
Most Recent Note - 6/16/2010 5:07:25 PM
Y - Consolidating quietly near its 50 DMA line. Color code was changed to yellow with new pivot point cited. Basing for about 8 weeks since a 2:1 stock split effective on 4/22/10.
>>> The latest Featured Stock Update with an annotated graph appeared on 6/15/2010. Click here.
View all notes |
Alert me of new notes |
CANSLIM.net Company Profile |
SEC |
Zacks Reports |
StockTalk |
News |
Chart |
Request a new note
C
A N
S L
I M
|
CISG
-
NASDAQ
Cninsure Inc Ads
INSURANCE - Insurance Brokers
|
$27.25
|
-0.04
-0.15% |
$27.44
|
374,066
128.06% of 50 DAV
50 DAV is 292,100
|
$28.62
-4.79%
|
6/16/2010
|
$27.20
|
PP = $27.75
|
|
MB = $29.14
|
Most Recent Note - 6/16/2010 5:09:42 PM
Y - Recent gains helped it rally back above its 50 DMA line, technically helping its outlook improve. Featured again in yellow in today's mid-day report (read here) with new pivot point cited based upon its 5/13/10 high. Based on weak action it was previously dropped from the Featured Stocks list on 5/19/10.
>>> The latest Featured Stock Update with an annotated graph appeared on 5/12/2010. Click here.
View all notes |
Alert me of new notes |
CANSLIM.net Company Profile |
SEC |
Zacks Reports |
StockTalk |
News |
Chart |
Request a new note
C
A N
S L
I M
|
CRM
-
NYSE
Salesforce.Com Inc
INTERNET - Internet Software and Services
|
$94.34
|
-0.67
-0.71% |
$95.06
|
2,549,272
99.21% of 50 DAV
50 DAV is 2,569,600
|
$97.09
-2.83%
|
6/2/2010
|
$88.44
|
PP = $89.60
|
|
MB = $94.08
|
Most Recent Note - 6/16/2010 5:10:37 PM
G - Holding its ground stubbornly, slightly extended from its latest base. Prior highs in the $89 area are an important support level to watch above its 50 DMA line.
>>> The latest Featured Stock Update with an annotated graph appeared on 6/2/2010. Click here.
View all notes |
Alert me of new notes |
CANSLIM.net Company Profile |
SEC |
Zacks Reports |
StockTalk |
News |
Chart |
Request a new note
C
A N
S L
I M
|
Symbol/Exchange
Company Name
Industry Group |
PRICE |
CHANGE
(%Change) |
Day High |
Volume
(% DAV)
(% 50 day avg vol) |
52 Wk Hi
% From Hi |
Featured
Date |
Price
Featured |
Pivot Featured |
|
Max Buy |
DECK
-
NASDAQ
Deckers Outdoor Corp
CONSUMER NON-DURABLES - Textile - Apparel Footwear
|
$162.90
|
-1.12
-0.68% |
$167.49
|
659,291
130.60% of 50 DAV
50 DAV is 504,800
|
$164.61
-1.04%
|
6/11/2010
|
$157.34
|
PP = $158.57
|
|
MB = $166.50
|
Most Recent Note - 6/16/2010 5:12:52 PM
Y - Hit another new 52-week high today and then negatively reversed, closing near the session low. Prior chart highs may now serve as initial support on pullbacks.
>>> The latest Featured Stock Update with an annotated graph appeared on 6/11/2010. Click here.
View all notes |
Alert me of new notes |
CANSLIM.net Company Profile |
SEC |
Zacks Reports |
StockTalk |
News |
Chart |
Request a new note
C
A N
S L
I M
|
FFIV
-
NASDAQ
F 5 Networks Inc
INTERNET - Internet Software and Services
|
$74.69
|
+1.72
2.36% |
$75.24
|
2,505,883
155.30% of 50 DAV
50 DAV is 1,613,600
|
$74.00
0.93%
|
6/16/2010
|
$74.50
|
PP = $74.10
|
|
MB = $77.81
|
Most Recent Note - 6/16/2010 5:16:36 PM
Y - Gain today with +55% above average volume helped it reach a new all-time high and trigger a technical buy signal with its breakout from a flat base of about 5-weeks. Featured in today's mid-day report (read here) as its color code was changed to yellow with a pivot point based upon its 5/13/10 high plus ten cents. Quarterly sales and earnings results show impressive acceleration in the Mar '10 and Dec '09 periods. The high-ranked Internet- Network Solutions industry group leader maintained a good annual earnings (A criteria) history.
>>> The latest Featured Stock Update with an annotated graph appeared on 6/16/2010. Click here.
View all notes |
Alert me of new notes |
CANSLIM.net Company Profile |
SEC |
Zacks Reports |
StockTalk |
News |
Chart |
Request a new note
C
A N
S L
I M
|
MELI
-
NASDAQ
Mercadolibre Inc
INTERNET - Internet Software and; Services
|
$60.60
|
+0.37
0.61% |
$62.11
|
789,786
107.10% of 50 DAV
50 DAV is 737,400
|
$60.97
-0.61%
|
5/13/2010
|
$54.21
|
PP = $55.85
|
|
MB = $58.64
|
Most Recent Note - 6/16/2010 5:17:16 PM
G - Hit another new 52-week high today with its 7th consecutive gain, getting extended and rising further above its "max buy" level. Prior chart highs in the $55 area may now act as an initial support level on pullbacks.
>>> The latest Featured Stock Update with an annotated graph appeared on 6/10/2010. Click here.
View all notes |
Alert me of new notes |
CANSLIM.net Company Profile |
SEC |
Zacks Reports |
StockTalk |
News |
Chart |
Request a new note
C
A N
S L
I M
|
ROVI
-
NASDAQ
Rovi Corp
COMPUTER SOFTWARE andamp; SERVICES - Security Software andamp; Services
|
$38.45
|
-0.05
-0.13% |
$38.74
|
799,469
60.21% of 50 DAV
50 DAV is 1,327,900
|
$40.06
-4.02%
|
6/3/2010
|
$38.70
|
PP = $40.16
|
|
MB = $42.17
|
Most Recent Note - 6/16/2010 5:18:52 PM
G - Held its ground today, quietly consolidating above its 50 DMA line. Recently found support near prior lows in the $35 area, and stayed above its October 2009 chart high.
>>> The latest Featured Stock Update with an annotated graph appeared on 6/9/2010. Click here.
View all notes |
Alert me of new notes |
CANSLIM.net Company Profile |
SEC |
Zacks Reports |
StockTalk |
News |
Chart |
Request a new note
C
A N
S L
I M
|
SUMR
-
NASDAQ
Summer Infant Inc
CONSUMER NON-DURABLES - Personal Products
|
$7.13
|
+0.31
4.55% |
$7.20
|
52,952
67.03% of 50 DAV
50 DAV is 79,000
|
$8.42
-15.32%
|
5/4/2010
|
$6.85
|
PP = $7.09
|
|
MB = $7.44
|
Most Recent Note - 6/16/2010 5:21:19 PM
G - A 4th consecutive gain today on light volume helped it rally back above its 50 DMA line, technically improving its outlook. Recent chart lows in the $6.25 area are important support to watch now.
>>> The latest Featured Stock Update with an annotated graph appeared on 6/8/2010. Click here.
View all notes |
Alert me of new notes |
CANSLIM.net Company Profile |
SEC |
Zacks Reports |
StockTalk |
News |
Chart |
Request a new note
C
A N
S L
I M
|
Symbol/Exchange
Company Name
Industry Group |
PRICE |
CHANGE
(%Change) |
Day High |
Volume
(% DAV)
(% 50 day avg vol) |
52 Wk Hi
% From Hi |
Featured
Date |
Price
Featured |
Pivot Featured |
|
Max Buy |
THOR
-
NASDAQ
Thoratec Corp
HEALTH SERVICES - Medical Instruments and Supplies
|
$47.08
|
+2.29
5.11% |
$47.93
|
1,647,598
178.89% of 50 DAV
50 DAV is 921,000
|
$46.50
1.25%
|
6/3/2010
|
$44.38
|
PP = $45.35
|
|
MB = $47.62
|
Most Recent Note - 6/16/2010 5:25:44 PM
G- Considerable gain today with above average volume for a new 52 week high. Color code was changed to green as it got to its "max buy" level, slightly extended from its latest base. No resistance remains due to overhead supply, and it could produce more climactic gains.
>>> The latest Featured Stock Update with an annotated graph appeared on 6/3/2010. Click here.
View all notes |
Alert me of new notes |
CANSLIM.net Company Profile |
SEC |
Zacks Reports |
StockTalk |
News |
Chart |
Request a new note
C
A N
S L
I M
|
ULTA
-
NASDAQ
Ulta Salon Cosm & Frag
SPECIALTY RETAIL - Specialty Retail, Other
|
$25.85
|
+0.73
2.91% |
$26.49
|
1,434,571
252.79% of 50 DAV
50 DAV is 567,500
|
$26.00
-0.58%
|
5/28/2010
|
$25.58
|
PP = $25.86
|
|
MB = $27.15
|
Most Recent Note - 6/16/2010 5:28:02 PM
Y - Gain today for a new 52-week high with heavy volume, closing near its pivot point. No overhead supply remains to act as resistance, but it recently completed a Secondary Offering which may hinder upward price progress for the near-term.
>>> The latest Featured Stock Update with an annotated graph appeared on 6/7/2010. Click here.
View all notes |
Alert me of new notes |
CANSLIM.net Company Profile |
SEC |
Zacks Reports |
StockTalk |
News |
Chart |
Request a new note
C
A N
S L
I M
|
|
|
|
THESE ARE NOT BUY RECOMMENDATIONS!
Comments contained in the body of this report are technical
opinions only. The material herein has been obtained
from sources believed to be reliable and accurate, however,
its accuracy and completeness cannot be guaranteed.
This site is not an investment advisor, hence it does
not endorse or recommend any securities or other investments.
Any recommendation contained in this report may not
be suitable for all investors and it is not to be deemed
an offer or solicitation on our part with respect to
the purchase or sale of any securities. All trademarks,
service marks and trade names appearing in this report
are the property of their respective owners, and are
likewise used for identification purposes only.
This report is a service available
only to active Paid Premium Members.
You may opt-out of receiving report notifications
at any time. Questions or comments may be submitted
by writing to Premium Membership Services 665 S.E. 10 Street, Suite 201 Deerfield Beach, FL 33441-5634 or by calling 1-800-965-8307
or 954-785-1121.
|
|
|


