You are not logged in.
This means you
CAN ONLY VIEW reports that were published prior to Monday, April 14, 2025.
You
MUST UPGRADE YOUR MEMBERSHIP if you want to see any current reports.
AFTER MARKET UPDATE - TUESDAY, JUNE 16TH, 2009
Previous After Market Report Next After Market Report >>>
|
|
|
|
DOW |
-107.46 |
8,504.67 |
-1.25% |
|
Volume |
1,175,800,800 |
+2% |
|
Volume |
2,310,767,800 |
+3% |
|
NASDAQ |
-20.20 |
1,796.18 |
-1.11% |
|
Advancers |
850 |
27% |
|
Advancers |
787 |
28% |
|
S&P 500 |
-11.75 |
911.97 |
-1.27% |
|
Decliners |
2,160 |
69% |
|
Decliners |
1,902 |
67% |
|
Russell 2000 |
-8.09 |
503.74 |
-1.58% |
|
52 Wk Highs |
5 |
|
|
52 Wk Highs |
12 |
|
|
S&P 600 |
-4.49 |
264.51 |
-1.67% |
|
52 Wk Lows |
3 |
|
|
52 Wk Lows |
12 |
|
|
 |
Major Averages Face More Distributional Pressure
Adam Sarhan, Contributing Writer,
The major averages fell again on Tuesday, sending the benchmark S&P 500 Index to its largest two-decline since April. Sentiment turned sour after Best Buy Co. (BBY -7.29%) reported lackluster sales data, increasing concerns that the economic rebound will slow. Volume totals were reported higher on both major US exchanges which added another distribution day to the count. Decliners trumped advancers by over a 2-to-1 ratio on both major exchanges. There were only 3 high-ranked companies from the CANSLIM.net Leaders List that made a new 52-week high and appeared on the CANSLIM.net BreakOuts Page, higher than the 2 issues that appeared on the prior session. A further expansion in the new highs list would offer encouraging news for growth oriented investors.
Best Buy, the world’s largest electronics retailer, gapped down and sliced below its 50 day moving average (DMA) line. The company said profits slid -2% last quarter. This cast a dark cloud over Wall Street and led many to speculate how strong the economic recovery actually is. In other news, President Obama spoke about advanced financial regulations and how to protect the economy from falling out of bed like what happened in late 2008.
There was mixed news on the economic front. Housing starts in May showed surprising strength while producer prices eased. Housing starts jumped +17.2% in May which followed a -12.9% drop in April. The annualized rate in May was 0.532 million units. This was a -45.2% drop from the same period in 2008. However, it was above the Street's estimate for 0.500 million units. Elsewhere, producer prices fell in May and were below expectations. The inflation component of the report (core prices) also fell. Overall producer prices eased to a +0.2% gain after rising +0.3% in April. May's reading was far short of the +0.7% increase the Street had expected. Core prices fell -0.1% in May which helped ease inflationary concerns.
The market rally appears to have ended as all the major averages sliced below near term support levels. The Dow Jones Industrial slid below its 200 DMA line which is an important area of support. The next area of support for the other major averages is their respective 200 DMA lines. To support this thesis, Morgan Stanley (MS -1.06%) released a report on Tuesday that said the current rally in US stocks may be over. Goldman Sachs Group Inc. (GS +0.80%) chief economist Jim O’Neill said financial markets may weaken in the next few weeks as concern spread regarding the governments’ intentions to scale back on rolling backing stimulus packages. Remember the best way to interpret market action is to objectively study price and volume. Since the market sliced below support earlier this week there is significant pressure on this mature (15-week) rally.
Money Management Services - Don't Miss Out- ACT NOW!- Open An Account today!
After remaining in cash from May 2008-May 2009, our portfolio managers began buying stocks. You may inquire about having your account professionally managed using this fact-based investment system by clicking HERE. *Accounts over $250,000 please. ** Serious inquiries only.
PICTURED: The Dow Jones Industrial Average sliced and closed below support at prior chart highs and its 200 DMA line on Tuesday.
|
|
|
 |
Retail Index Sinks Below 50 Day Average
Kenneth J. Gruneisen - Passed the CAN SLIM® Master's Exam
Energy shares slid and the Oil Services ($OSX -3.08%) and Integrated Oil ($XOI -1.37%) indexes were pressured on Tuesday. Financial shares also created a drag on the major averages as the Broker/Dealer ($XBD -2.69%) and Bank ($BKX -2.42%) indexes each fell more than -2% on the session. Tech shares also backpedaled, led lower by the Semiconductor ($SOX -2.51%) and Networking ($NWX -2.00%) indexes, followed by smaller losses in the Internet ($IIX -1.29%) and Biotechnology Index ($BTK -0.90%). Meanwhile, defensive posturing gave a small boost to the Gold & Silver Index ($XAU +0.47%) and the Healthcare ($HMO +1.98%) group.
Charts courtesy www.stockcharts.com
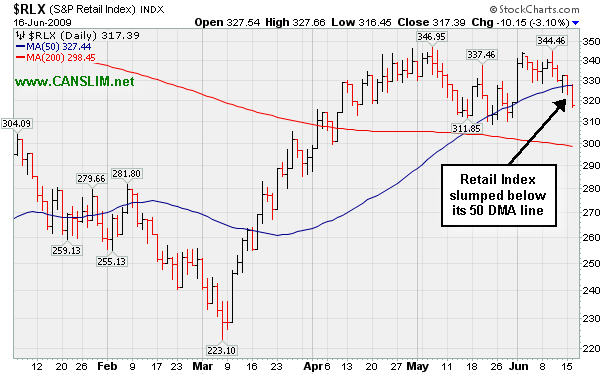
PICTURED: The Retail Index ($RLX -3.10%) sliced below its 50-day moving average (DMA) line. Not long ago it promptly repaired a 50 DMA violation. Further deterioration leading to a break below recent chart lows would not bode well for retailers' outlook.
| Oil Services |
$OSX |
172.53 |
-5.48 |
-3.08% |
+42.13% |
| Healthcare |
$HMO |
1,017.33 |
+19.72 |
+1.98% |
+5.95% |
| Integrated Oil |
$XOI |
948.29 |
-13.14 |
-1.37% |
-3.20% |
| Semiconductor |
$SOX |
263.71 |
-6.79 |
-2.51% |
+24.29% |
| Networking |
$NWX |
185.44 |
-3.79 |
-2.00% |
+28.88% |
| Internet |
$IIX |
187.24 |
-2.45 |
-1.29% |
+39.97% |
| Broker/Dealer |
$XBD |
98.79 |
-2.73 |
-2.69% |
+27.52% |
| Retail |
$RLX |
317.39 |
-10.15 |
-3.10% |
+13.65% |
| Gold & Silver |
$XAU |
140.56 |
+0.66 |
+0.47% |
+13.49% |
| Bank |
$BKX |
36.73 |
-0.91 |
-2.42% |
-17.13% |
| Biotech |
$btk |
652.79 |
-5.94 |
-0.90% |
+0.87% |
|
|
|
 |
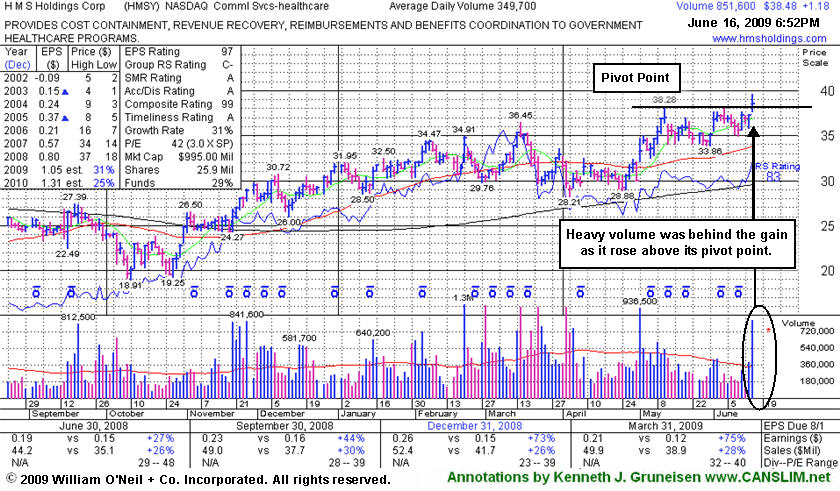
Gap Up Gain On High Volume Indicates Institutional Demand
Kenneth J. Gruneisen - Passed the CAN SLIM® Master's Exam
HMS Holdings Corp (HMSY +$1.18 or +3.16% to $38.48) gapped up today and hit a new high with a solid gain on heavy volume, triggering a technical buy signal. The Commercial Services - Healthcare firm was helped by the healthcare group's standout gains on a mostly negative session. In its last appearance in this Featured Stock Update section, under the headline "Building An Orderly Flat Base" on June 11th (read here), an annotated graph showed it trading toward the high end of a near 5-week flat base above its 50-day moving average line. During its latest base its daily volume totals dried up, yet the volume behind its breakout to new highs (the N criteria) day was nearly two and a half times its average volume total. The heavy volume and gap up also provided a nice reassurance of institutional (the I criteria) buying demand.
A downturn in 2006 earnings is a fundamental flaw in HMS Holdings Corp's annual earnings history that raises some concerns with respect to the A criteria of the investment system. Investors' odds are usually better with a company that has a steady 3-5 year earnings growth history. This stock was first featured on Friday, February 20, 2009 in the CANSLIM.net Mid Day Breakouts Report (read here), then dropped from the Featured Stocks list on 4/02/09 due to weak action, returning yet again in yellow in the mid-day report on 5/01/09.
|
|
|
Color Codes Explained :
Y - Better candidates highlighted by our
staff of experts.
G - Previously featured
in past reports as yellow but may no longer be buyable under the
guidelines.
***Last / Change / Volume quote data in this table corresponds with the timestamp on the note***
Symbol/Exchange
Company Name
Industry Group |
Last |
Chg. |
Vol
% DAV |
Date Featured |
Price Featured |
Latest Pivot Point
Featured |
Status |
| Latest Max Buy Price |
GMCR
- NASDAQ
Green Mtn Coffee Roastrs
FOOD & BEVERAGE - Processed & Packaged Goods
|
$56.51
|
N/A
|
N/A
N/A
|
1/1/2008
(Date
Featured) |
$27.13
(Price
Featured) |
PP = $28.66 |
G |
| MB = $30.09 |
Most Recent Note - 6/16/2009
G - Loss on higher volume today indicates distributional pressure while consolidating well above its 50 DMA line -important support to watch. 3:2 stock split effective 6/09/09. GMCR has traded up more than +144% since appearing with an annotated graph under the headline "It May Soon Be Time To Go Green" when featured in the January 2009 CANSLIM.net News (read here). It is now easier than ever to review prior coverage on current high-ranked leaders via CANSLIM.net's revamped Featured Stock Profile pages. Simply click the company name or links to Company Profile. Thanks to the support of CANSLIM.net's active members, more improvements are coming soon!
>>> The latest Featured Stock Update with an annotated graph appeared on 6/8/2009. click here.
|
|
C
A
S
I |
News |
Chart |
SEC
View all notes Alert
me of new notes
Company
Profile
|
HMSY
- NASDAQ
H M S Holdings Corp
COMPUTER SOFTWARE & SERVICES - Healthcare Information Service
|
$38.48
|
N/A
|
N/A
N/A
|
2/20/2009
(Date
Featured) |
$34.08
(Price
Featured) |
PP = $38.38 |
Y |
| MB = $40.30 |
Most Recent Note - 6/16/2009 6:46:23 PM
Y - Gapped up today and hit a new high with a solid gain on heavy volume as it closed the session above its pivot point, triggering a technical buy signal. No overhead supply is left to hinder the progress for this Commercial Services - Healthcare firm.
>>> The latest Featured Stock Update with an annotated graph appeared on 6/16/2009. click here.
|
|
C
A
S
I |
News |
Chart |
SEC
View all notes Alert
me of new notes
Company
Profile
|
ILMN
- NASDAQ
Illumina Inc
DRUGS - Biotechnology
|
$36.37
|
N/A
|
N/A
N/A
|
5/3/2009
(Date
Featured) |
$38.14
(Price
Featured) |
PP = $39.05 |
G |
| MB = $41.00 |
Most Recent Note - 6/16/2009 7:03:06 PM
G - Loss on average volume today led to a close just under its 50 DMA line. Recent distributional pressure raised concerns after the stock rallied to new 2009 highs on light volume. Color code is changed to green due to the sluggish action. After consolidating above its 50 DMA line in a very tight trading range for more than 3 months, its Relative Strength rank has slumped to 63, raising concerns. Recently featured in the May 2009 issue of CANSLIM.net News (read here).
>>> The latest Featured Stock Update with an annotated graph appeared on 6/12/2009. click here.
|
|
C
A
S
I |
News |
Chart |
SEC
View all notes Alert
me of new notes
Company
Profile
|
LFT
-
|
$25.02
|
N/A
|
N/A
N/A
|
4/2/2009
(Date
Featured) |
$22.19
(Price
Featured) |
PP = $21.81 |
G |
| MB = $22.90 |
Most Recent Note - 6/16/2009 7:05:27 PM
G - Loss on above average volume today was yet another dose of distributional pressure. The stock is currently trading just above its 50 DMA line, an important area of support. Hit a new 52-week high on 6/05/09 as it rose from a choppy (improper) base pattern. Its progress could be hindered by future share offerings. Its 5/28/09 gap up and considerable gain followed another strong quarterly financial report. Prompt repair of its recent 50 DMA line violation, and its gap up, were noted as signs of solid institutional (the I criteria) support and buying demand. This Chinese Computer Software firm recently filed a registration of approximately 16 million shares for resale, and it also revealed a planned acquisition of another Chinese service provider.
>>> The latest Featured Stock Update with an annotated graph appeared on 6/4/2009. click here.
|
|
C
A
S
I |
News |
Chart |
SEC
View all notes Alert
me of new notes
Company
Profile
|
NTES
- NASDAQ
Netease Inc Adr
INTERNET - Internet Information Providers
|
$35.19
|
N/A
|
N/A
N/A
|
5/21/2009
(Date
Featured) |
$31.19
(Price
Featured) |
PP = $32.75 |
G |
| MB = $34.39 |
Most Recent Note - 6/16/2009 7:06:38 PM
G - Gain on light volume today halted a 4 day slide. This strong leader encountered some distributional pressure late last week. It is currently extended from its second-stage base, and prior chart highs and its 50 DMA line (both near $32) are an important support level to watch on pullbacks. Its 5/28/09 gap up and considerable gain with +79% above average volume confirmed a technical buy signal as it rose above its pivot point. Indications of institutional (the I criteria) buying demand have been noted after earnings news on 5/20/09 a shakeout tested support near its 50 DMA line. First featured at $26.75 in the 3/31/09 CANSLIM.net Mid-Day Breakouts Report (read here). This high-ranked Chinese Internet - Content firm was also summarized in greater detail including an annotated graph in the April 2009 issue of CANSLIM.net News (read here).
>>> The latest Featured Stock Update with an annotated graph appeared on 6/5/2009. click here.
|
|
C
A
S
I |
News |
Chart |
SEC
View all notes Alert
me of new notes
Company
Profile
|
NVEC
- NASDAQ
N V E Corp
ELECTRONICS - Semiconductor - Specialized
|
$42.82
|
N/A
|
N/A
N/A
|
3/13/2009
(Date
Featured) |
$33.85
(Price
Featured) |
PP = $39.01 |
G |
| MB = $40.96 |
Most Recent Note - 6/16/2009 7:07:57 PM
G - Gapped up today for a gain on below average volume. Found support above its 50 DMA line in May which was an encouraging sign. Earnings per share rose +38% over the year ago period, yet sales were up just +14% and still rather minuscule.
>>> The latest Featured Stock Update with an annotated graph appeared on 6/9/2009. click here.
|
|
C
A
S
I |
News |
Chart |
SEC
View all notes Alert
me of new notes
Company
Profile
|
SNDA
-
|
$53.58
|
N/A
|
N/A
N/A
|
5/31/2009
(Date
Featured) |
$57.62
(Price
Featured) |
PP = $53.95 |
G |
| MB = $56.65 |
Most Recent Note - 6/16/2009 7:10:30 PM
G - Loss today was its 3rd straight loss with above average volume of a 5-day losing streak, raising concerns. It is near prior chart highs and its 50 DMA line, important support levels to watch. Detailed analysis was included when recently featured in the June 2009 issue of CANSLIM.net News. Be sure to review the "What to Look Out For" section and entire detailed summary - read here).
>>> The latest Featured Stock Update with an annotated graph appeared on 6/3/2009. click here.
|
|
C
A
S
I |
News |
Chart |
SEC
View all notes Alert
me of new notes
Company
Profile
|
SYNA
- NASDAQ
Synaptics Inc
COMPUTER SOFTWARE & SERVICES - Information Technology Service
|
$36.64
|
N/A
|
N/A
N/A
|
5/18/2009
(Date
Featured) |
$32.58
(Price
Featured) |
PP = $34.52 |
G |
| MB = $36.25 |
Most Recent Note - 6/16/2009 7:13:06 PM
G - Loss on quiet volume today has it testing support near its August 2008 chart highs ($36). First featured in yellow in the May 18, 2009 mid-day report (read here). The number of top-rated funds owning its shares rose from 123 in June '08 to 194 in March '09, which is good news concerning the I criteria. Its annual earnings (the A criteria) history showed a dowturn in 2006, leaving concerns, but it followed that up with strong growth the next 2 years. Its small supply of shares (the S criteria) outstanding could contribute to especially great volatility in the event of institutional accumulation or distribution.
>>> The latest Featured Stock Update with an annotated graph appeared on 6/15/2009. click here.
|
|
C
A
S
I |
News |
Chart |
SEC
View all notes Alert
me of new notes
Company
Profile
|
TNDM
- NASDAQ
Tandem Diabetes Care Inc
TELECOMMUNICATIONS - Wireless Communications
|
$24.28
|
N/A
|
N/A
N/A
|
3/2/2009
(Date
Featured) |
$18.89
(Price
Featured) |
PP = $29.85 |
G |
| MB = $31.34 |
Most Recent Note - 6/16/2009 7:14:25 PM
G - Held its ground today, but currently trading well below its 50 DMA line. TNDM triggered a technical sell signal when it violated its 50 DMA line last week on heavy distributional pressure. It completely negated its latest technical breakout, and its color code was changed to green based on its deterioration. A sound base needs to form before new buying efforts might be justified under the investment system's guidelines. Impressive "positive reversal" on 5/14/09 was noted as a sign of prompt institutional support arriving. Gapped up on 4/30/09 for a new all-time high after reporting solid quarterly sales and earnings increases. Traded up as much as +72.42% since first featured at $18.89 in the 3/02/09 Mid-Day BreakOuts Report (read here).
>>> The latest Featured Stock Update with an annotated graph appeared on 6/10/2009. click here.
|
|
C
A
S
I |
News |
Chart |
SEC
View all notes Alert
me of new notes
Company
Profile
|
|
|
|
THESE ARE NOT BUY RECOMMENDATIONS!
Comments contained in the body of this report are technical
opinions only. The material herein has been obtained
from sources believed to be reliable and accurate, however,
its accuracy and completeness cannot be guaranteed.
This site is not an investment advisor, hence it does
not endorse or recommend any securities or other investments.
Any recommendation contained in this report may not
be suitable for all investors and it is not to be deemed
an offer or solicitation on our part with respect to
the purchase or sale of any securities. All trademarks,
service marks and trade names appearing in this report
are the property of their respective owners, and are
likewise used for identification purposes only.
This report is a service available
only to active Paid Premium Members.
You may opt-out of receiving report notifications
at any time. Questions or comments may be submitted
by writing to Premium Membership Services 665 S.E. 10 Street, Suite 201 Deerfield Beach, FL 33441-5634 or by calling 1-800-965-8307
or 954-785-1121.
|
|
|


