You are not logged in.
This means you
CAN ONLY VIEW reports that were published prior to Tuesday, March 25, 2025.
You
MUST UPGRADE YOUR MEMBERSHIP if you want to see any current reports.
AFTER MARKET UPDATE - FRIDAY, JUNE 15TH, 2012
Previous After Market Report Next After Market Report >>>
|
|
|
|
DOW |
+115.26 |
12,767.17 |
+0.91% |
|
Volume |
1,513,357,770 |
+94% |
|
Volume |
1,921,500,610 |
+21% |
|
NASDAQ |
+36.47 |
2,872.80 |
+1.29% |
|
Advancers |
2,106 |
67% |
|
Advancers |
1,762 |
67% |
|
S&P 500 |
+13.74 |
1,342.84 |
+1.03% |
|
Decliners |
919 |
29% |
|
Decliners |
757 |
29% |
|
Russell 2000 |
+8.98 |
771.32 |
+1.18% |
|
52 Wk Highs |
79 |
|
|
52 Wk Highs |
64 |
|
|
S&P 600 |
+5.03 |
430.25 |
+1.18% |
|
52 Wk Lows |
40 |
|
|
52 Wk Lows |
44 |
|
|
 |
New Highs List Swells With Gains on Volume Confirming Rally
Kenneth J. Gruneisen - Passed the CAN SLIM® Master's Exam
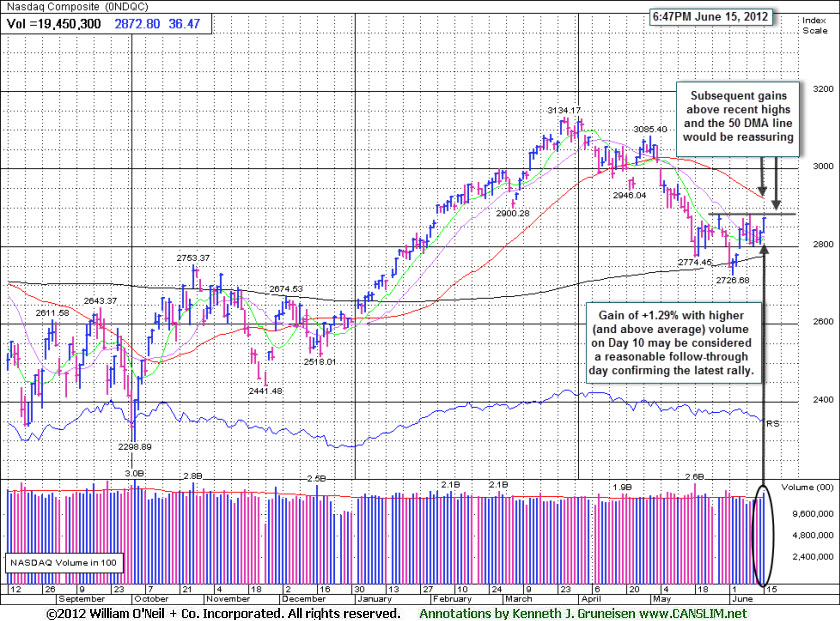
The S&P 500 posted its first back-to-back weekly gains since April, and for the week the Dow Jones Industrial Average gained +1.7%, the S&P 500 Index rose +1.3%, and the Nasdaq Composite Index advanced +0.5%. On Friday's session the indices posted respectable gains and the volume totals were reported much higher than the prior session totals on the Nasdaq exchange and on the NYSE, inflated by options expirations which routinely occur on the third Friday of each month. The gains backed by higher volume could be viewed as an indication that the institutional crowd was accumulating shares. The Nasdaq Composite Index's gain of +1.29% may be considered a sufficient follow-through day, yet it is noted as just under the recently cited +1.4% threshold. Breadth was positive as advancers led decliners by more than a 2-1 ratio on the NYSE and on the Nasdaq exchange. The total number of new 52-week highs again exceeded new 52-week lows on both the NYSE and on the Nasdaq exchange. There were 40 high-ranked companies from the CANSLIM.net Leaders List made new 52-week highs and appeared on the CANSLIM.net BreakOuts Page, up nicely from the prior session total of 24 stocks. At Friday's close there gains for 12 of the 14 high-ranked companies currently included on the Featured Stocks Page.
Investors were optimistic heading into Friday's opening bell after positive developments out of Europe. Ahead of Sunday's all-important elections in Greece, EU leaders are working to link budget and banking policies within the common currency region and develop new initiates to spur economic growth.
U.S. economic data was also in focus, as early reports had the Empire manufacturing index coming in at 2.29 in June, falling short of the expected 12.5 reading, and declining to its lowest level since November. May industrial production and capacity utilization cooled modestly, unexpectedly dropping for the second time in three months. The preliminary University of Michigan Confidence reading was expected to decline to 77.5 in June but it actually declined to 74.1 from the prior month's reading of 79.3, reaching a six-month low.
Financial stocks including Bank of America Corp (BAC +3.13%) and Citigroup Inc (C +1.43%) rose. Investors cheered reports that major central banks are preparing a coordinated action to provide liquidity in an effort to improve lending conditions. The Federal Reserve Board meets next Tuesday and Wednesday.
On the M&A front, Microsoft Corp (MSFT +2.32%) rose after the company announced it would acquire software maker Yammer in a $1.2 billion deal. Chevron Corp (CVX +2.36%) gained ground while crude oil prices oscillated on Friday before ending with an incremental gain only pennies above $84 per barrel.
With investors focused on hopes of stimulus measures, the latest batch of weak economic data was overlooked and stocks rallied on Friday. To repeat a remark from Thursday evening's commentary, "Regardless of the reasons pundits may point to for why stocks rose, it was an encouraging sign to see the market shake off negative news." Stocks rallying in the face of negative news can be viewed as a sign of a bullish market environment.
In bondland, Treasuries extended their weekly advance with the 10-year note up 18/32 to yield 1.58% and the 30-year added on over a full point to yield 2.69%.
Technically, the major averages (M criteria) have confirmed a new rally attempt and fact-based investors may carefully begin with new buying efforts strictly in sound buy candidates near proper entry points. Any distribution days immediately afterward could quickly destroy a new rally. As always, disciplined investors limit losses if any stock ever falls more than -7% from its purchase price.
The Q2 2012 Webcast is scheduled for Wednesday, June 27th at 8PM EST and will be available "ON DEMAND" afterward. All who have the UPGRADED membership now get access to these informative *Quarterly Webcasts included at no additional cost. (*Previously sold separately at $99 per webcast.) Links to archived webcasts and all prior reports are on the Premium Member Homepage. Please use the inquiry form to submit any questions that you would like to see answered in the upcoming webcast or to make any suggestions or comments about our website and services. Thank you!
PICTURED: The Nasdaq Composite Index's gain of +1.29% on higher (and above average) volume on Day 10 of the rally effort, coupled with an expansion in the new highs lists, may be considered a reasonable follow-through day confirming a new rally. The tech-heavy index's ability to clear near-term technical hurdles would be very reassuring signs for the rally and it would provide more encouragement for investors to increase their stock market exposure. In the days ahead we will watch very closely as it challenges recent highs and its downward sloping 50-day moving average (DMA) line.
|
 Kenneth J. Gruneisen started out as a licensed stockbroker in August 1987, a couple of months prior to the historic stock market crash that took the Dow Jones Industrial Average down -22.6% in a single day. He has published daily fact-based fundamental and technical analysis on high-ranked stocks online for two decades. Through FACTBASEDINVESTING.COM, Kenneth provides educational articles, news, market commentary, and other information regarding proven investment systems that work in good times and bad.
Comments contained in the body of this report are technical opinions only and are not necessarily those of Gruneisen Growth Corp. The material herein has been obtained from sources believed to be reliable and accurate, however, its accuracy and completeness cannot be guaranteed. Our firm, employees, and customers may effect transactions, including transactions contrary to any recommendation herein, or have positions in the securities mentioned herein or options with respect thereto. Any recommendation contained in this report may not be suitable for all investors and it is not to be deemed an offer or solicitation on our part with respect to the purchase or sale of any securities. |
|
 |
Widespread Gains Lifted All Industry Groups
Kenneth J. Gruneisen - Passed the CAN SLIM® Master's Exam
The Retail Index ($RLX +1.03%) rose and financial shares also helped underpin the major averages' gains on Friday as the Broker/Dealer Index ($XBD +1.79%) and Bank Index ($BKX +1.52%) notched gains. The tech sector saw unanimous gains from the Biotechnology Index ($BTK +1.45%), Semiconductor Index ($SOX +1.63%), Networking Index ($NWX +1.65%), and the Internet Index ($IIX +1.83%). Energy-related shares rallied lifting the Integrated Oil Index ($XOI +1.77%) and the Oil Services Index ($OSX +1.82%). Defensive groups were relative laggards on Friday as the Gold & Silver Index ($XAU +0.24%) and Healthcare Index ($HMO +0.64%) posted small gains.
Charts courtesy www.stockcharts.com
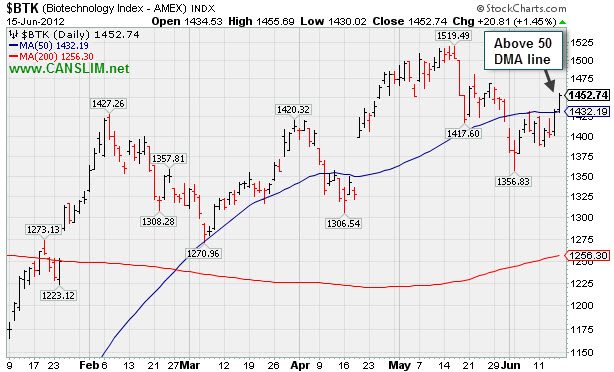
PICTURED: The Biotechnology Index ($BTK +1.45%) posted a 2nd consecutive gain and rallied above its 50-day moving average (DMA) line, helping its technical stance, which bodes better for individual stocks in the group.
| Oil Services |
$OSX |
203.28 |
+3.63 |
+1.82% |
-6.01% |
| Healthcare |
$HMO |
2,243.68 |
+14.24 |
+0.64% |
-1.66% |
| Integrated Oil |
$XOI |
1,150.32 |
+20.01 |
+1.77% |
-6.41% |
| Semiconductor |
$SOX |
375.15 |
+6.00 |
+1.63% |
+2.94% |
| Networking |
$NWX |
208.91 |
+3.38 |
+1.65% |
-2.90% |
| Internet |
$IIX |
299.46 |
+5.38 |
+1.83% |
+6.29% |
| Broker/Dealer |
$XBD |
86.67 |
+1.53 |
+1.79% |
+4.08% |
| Retail |
$RLX |
615.11 |
+6.28 |
+1.03% |
+17.57% |
| Gold & Silver |
$XAU |
164.09 |
+0.40 |
+0.24% |
-9.16% |
| Bank |
$BKX |
44.72 |
+0.67 |
+1.52% |
+13.56% |
| Biotech |
$BTK |
1,452.74 |
+20.81 |
+1.45% |
+33.10% |
|
|
|
 |
Secondary Buy Point After Finding Support
Kenneth J. Gruneisen - Passed the CAN SLIM® Master's Exam
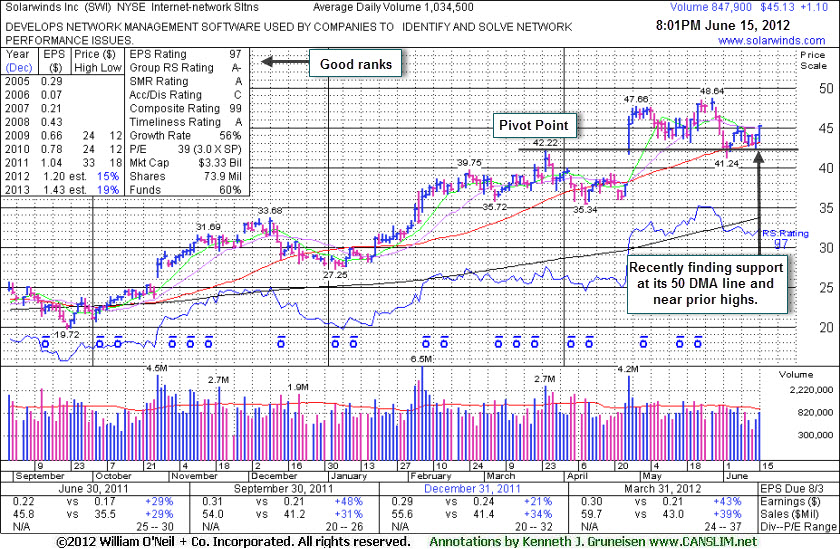
Solarwinds Inc (SWI +$1.10 or +2.50% to $45.13) is consolidating just above its 50-day moving average (DMA) line and prior highs defining important near-term chart support. It posted another gain on below average volume today. Any damaging violation of that short-term average and the 6/04/11 low ($41.24) would trigger more worrisome technical sell signals.
Its color code has been changed to yellow while no new pivot point is being cited. As the teach in the Certification, a secondary buy point exists between a stock's first successful test of its 10-week moving average up to +5% above its recent high ($48.64 plus another 5% in this case) following an earlier technical breakout.
Its last appearance in this FSU section was on 5/21/12 with an annotated graph under the headline, "Consolidation Following Gap Up on Stronger Earnings and Sales". It reported earnings +43% on +39% sales revenues for the quarter ended March 31, 2012 versus the years ago period. In 3 of the 4 most current quarterly comparisons its earnings increases were above the +25% guideline meeting the C criteria of the fact-based system.
It has a good annual earnings (A criteria) history. The number of top-rated funds owning its shares rose from 346 in Jun '11 to 435 in Mar '12, a reassuring sign concerning the I criteria of the fact-based investment system.
|
|
|
Color Codes Explained :
Y - Better candidates highlighted by our
staff of experts.
G - Previously featured
in past reports as yellow but may no longer be buyable under the
guidelines.
***Last / Change / Volume data in this table is the closing quote data***
Symbol/Exchange
Company Name
Industry Group |
PRICE |
CHANGE
(%Change) |
Day High |
Volume
(% DAV)
(% 50 day avg vol) |
52 Wk Hi
% From Hi |
Featured
Date |
Price
Featured |
Pivot Featured |
|
Max Buy |
ALXN
-
NASDAQ
Alexion Pharmaceuticals
DRUGS - Drug Manufacturers - Other
|
$93.31
|
+0.35
0.38% |
$94.38
|
3,724,992
185.29% of 50 DAV
50 DAV is 2,010,400
|
$95.01
-1.79%
|
5/1/2012
|
$91.73
|
PP = $95.11
|
|
MB = $99.87
|
 Most Recent Note - 6/15/2012 8:38:47 PM
Y - Posted a small gain today with above average volume. Encountering resistance in the $94-95 area, but little overhead supply remains to hinder its progress. It is perched within close striking distance of its pivot point and near its 52-week high.
>>> The latest Featured Stock Update with an annotated graph appeared on 5/31/2012. Click here.
View all notes |
Alert me of new notes |
CANSLIM.net Company Profile |
SEC |
Zacks Reports |
StockTalk |
News |
Chart |
Request a new note
C
A N
S L
I M


|
ASPS
-
NASDAQ
Altisource Ptf Sltns Sa
REAL ESTATE - Property Management/Developmen
|
$67.40
|
+2.05
3.14% |
$67.56
|
88,863
65.73% of 50 DAV
50 DAV is 135,200
|
$67.03
0.55%
|
6/5/2012
|
$60.01
|
PP = $63.00
|
|
MB = $66.15
|
Most Recent Note - 6/15/2012 8:27:47 PM
G - Hit a new 52-week high with today's gain backed by below average volume. Color code is changed to green after rising above the "max buy" level.
>>> The latest Featured Stock Update with an annotated graph appeared on 6/5/2012. Click here.
View all notes |
Alert me of new notes |
CANSLIM.net Company Profile |
SEC |
Zacks Reports |
StockTalk |
News |
Chart |
Request a new note
C
A N
S L
I M
|
CERN
-
NASDAQ
Cerner Corp
COMPUTER SOFTWARE and SERVICES - Healthcare Information Service
|
$82.64
|
+1.11
1.36% |
$82.80
|
1,439,917
112.91% of 50 DAV
50 DAV is 1,275,300
|
$84.10
-1.74%
|
6/7/2012
|
$78.36
|
PP = $84.20
|
|
MB = $88.41
|
Most Recent Note - 6/15/2012 8:37:00 PM
Y - Rallied near its pivot point with slightly above average volume today. Volume-driven gains above its pivot point are still needed to trigger a new (or add-on) technical buy signal.
>>> The latest Featured Stock Update with an annotated graph appeared on 6/7/2012. Click here.
View all notes |
Alert me of new notes |
CANSLIM.net Company Profile |
SEC |
Zacks Reports |
StockTalk |
News |
Chart |
Request a new note
C
A N
S L
I M
|
CMCSA
-
NASDAQ
Comcast Corp Cl A
MEDIA - CATV Systems
|
$31.09
|
+0.38
1.24% |
$31.17
|
21,013,809
155.25% of 50 DAV
50 DAV is 13,535,800
|
$30.88
0.70%
|
6/11/2012
|
$29.94
|
PP = $30.98
|
|
MB = $32.53
|
Most Recent Note - 6/15/2012 8:34:40 PM
Y - Hit a new 52-week high today with +55% above average volume while rising above the new pivot point recently cited triggering a technical buy signal. The prior low ($28.09 on 5/21/12) defines important near-term support to watch.
>>> The latest Featured Stock Update with an annotated graph appeared on 6/11/2012. Click here.
View all notes |
Alert me of new notes |
CANSLIM.net Company Profile |
SEC |
Zacks Reports |
StockTalk |
News |
Chart |
Request a new note
C
A N
S L
I M
|
DG
-
NYSE
Dollar General Corp
RETAIL - Discount, Variety Stores
|
$52.19
|
+1.64
3.24% |
$52.19
|
7,470,161
232.14% of 50 DAV
50 DAV is 3,218,000
|
$50.85
2.64%
|
5/7/2012
|
$48.51
|
PP = $47.69
|
|
MB = $50.07
|
Most Recent Note - 6/15/2012 8:35:33 PM
G - Rallied with above average volume to a new all-time high and closed at the session high. Completed another Secondary Offering on 6/05/12, its 4th Secondary Offering since September '11.
>>> The latest Featured Stock Update with an annotated graph appeared on 6/12/2012. Click here.
View all notes |
Alert me of new notes |
CANSLIM.net Company Profile |
SEC |
Zacks Reports |
StockTalk |
News |
Chart |
Request a new note
C
A N
S L
I M
|
Symbol/Exchange
Company Name
Industry Group |
PRICE |
CHANGE
(%Change) |
Day High |
Volume
(% DAV)
(% 50 day avg vol) |
52 Wk Hi
% From Hi |
Featured
Date |
Price
Featured |
Pivot Featured |
|
Max Buy |
EXPE
-
NASDAQ
Expedia Inc
INTERNET - Internet Information Providers
|
$50.05
|
+2.52
5.30% |
$50.23
|
6,173,396
137.28% of 50 DAV
50 DAV is 4,497,000
|
$49.12
1.89%
|
4/27/2012
|
$41.80
|
PP = $35.57
|
|
MB = $37.35
|
Most Recent Note - 6/15/2012 8:01:47 PM
G - Powered to a new 52-week high today with a solid gain backed by above average volume. It is extended from its prior highs in the $43 area which define initial support above its 50 DMA line.
>>> The latest Featured Stock Update with an annotated graph appeared on 6/8/2012. Click here.
View all notes |
Alert me of new notes |
CANSLIM.net Company Profile |
SEC |
Zacks Reports |
StockTalk |
News |
Chart |
Request a new note
C
A N
S L
I M
|
GNC
-
NYSE
G N C Holdings Inc
RETAIL - Drug Stores
|
$35.42
|
-1.08
-2.96% |
$36.61
|
7,491,537
399.38% of 50 DAV
50 DAV is 1,875,800
|
$41.95
-15.57%
|
1/19/2012
|
$28.99
|
PP = $29.60
|
|
MB = $31.08
|
Most Recent Note - 6/15/2012 8:41:04 PM
G - Loss today on heavy volume led to a slump further below its 50 DMA line and undercut recent lows raising more serious concerns, yet it finished near the middle of its intra-day range.
>>> The latest Featured Stock Update with an annotated graph appeared on 6/6/2012. Click here.
View all notes |
Alert me of new notes |
CANSLIM.net Company Profile |
SEC |
Zacks Reports |
StockTalk |
News |
Chart |
Request a new note
C
A N
S L
I M
|
NTES
-
NASDAQ
Netease Inc Adr
INTERNET - Internet Information Providers
|
$60.25
|
+0.74
1.24% |
$60.33
|
704,202
99.60% of 50 DAV
50 DAV is 707,000
|
$65.54
-8.07%
|
3/19/2012
|
$56.18
|
PP = $55.10
|
|
MB = $57.86
|
Most Recent Note - 6/12/2012 2:09:17 PM
G - Pulling back from its 52-week high with a 3rd consecutive loss today on lighter than average volume. Its 50 DMA line defines near-term support and prior lows near the $55 area define the next important chart support to watch where violations may trigger a worrisome technical sell signals.
>>> The latest Featured Stock Update with an annotated graph appeared on 5/24/2012. Click here.
View all notes |
Alert me of new notes |
CANSLIM.net Company Profile |
SEC |
Zacks Reports |
StockTalk |
News |
Chart |
Request a new note
C
A N
S L
I M
|
SWI
-
NYSE
Solarwinds Inc
COMPUTER SOFTWARE and SERVICES - Application Software
|
$45.13
|
+1.10
2.50% |
$45.22
|
850,323
82.20% of 50 DAV
50 DAV is 1,034,500
|
$48.64
-7.22%
|
4/26/2012
|
$45.15
|
PP = $42.32
|
|
MB = $44.44
|
Most Recent Note - 6/15/2012 8:25:22 PM
Y - Color code is changed to yellow while no new pivot point is cited, yet a valid secondary buy point exists up to +5% above the recent high. Consolidating above its 50 DMA line and prior highs defining important chart support. A damaging violation of that short-term average and the 6/04/11 low ($41.24) would trigger a more worrisome technical sell signals. See the latest FSU analysis for more details and a new annotated graph.
>>> The latest Featured Stock Update with an annotated graph appeared on 6/15/2012. Click here.
View all notes |
Alert me of new notes |
CANSLIM.net Company Profile |
SEC |
Zacks Reports |
StockTalk |
News |
Chart |
Request a new note
C
A N
S L
I M
|
SXCI
-
NASDAQ
S X C Health Solutions
COMPUTER SOFTWARE and SERVICES - Healthcare Information Service
|
$94.73
|
+0.02
0.02% |
$95.47
|
869,381
70.74% of 50 DAV
50 DAV is 1,228,900
|
$100.50
-5.74%
|
6/14/2012
|
$94.71
|
PP = $100.60
|
|
MB = $105.63
|
Most Recent Note - 6/14/2012 6:50:38 PM
Y - Color code is changed to yellow with new pivot point cited based on its 4/20/12 high plus 10 cents. Subsequent volume-driven gains may trigger a buy signal, however the M criteria must also improve before any new buying efforts are justified under the fact-based system. Its 50 DMA line defines important support for chart readers. See the latest FSU analysis for more details and a new annotated graph.
>>> The latest Featured Stock Update with an annotated graph appeared on 6/14/2012. Click here.
View all notes |
Alert me of new notes |
CANSLIM.net Company Profile |
SEC |
Zacks Reports |
StockTalk |
News |
Chart |
Request a new note
C
A N
S L
I M
|
Symbol/Exchange
Company Name
Industry Group |
PRICE |
CHANGE
(%Change) |
Day High |
Volume
(% DAV)
(% 50 day avg vol) |
52 Wk Hi
% From Hi |
Featured
Date |
Price
Featured |
Pivot Featured |
|
Max Buy |
TDG
-
NYSE
Transdigm Group Inc
AEROSPACE/DEFENSE - Aerospace/Defense Products and; Services
|
$124.28
|
-0.21
-0.17% |
$124.69
|
669,524
123.23% of 50 DAV
50 DAV is 543,300
|
$132.69
-6.34%
|
2/29/2012
|
$120.10
|
PP = $118.93
|
|
MB = $124.88
|
Most Recent Note - 6/13/2012 6:20:07 PM
G - Quietly consolidating above important support at its 50 DMA line while perched within close striking distance of its all-time high. Its prior low ($118.43 on 5/18/12) defines the next important near-term chart support level to watch.
>>> The latest Featured Stock Update with an annotated graph appeared on 5/23/2012. Click here.
View all notes |
Alert me of new notes |
CANSLIM.net Company Profile |
SEC |
Zacks Reports |
StockTalk |
News |
Chart |
Request a new note
C
A N
S L
I M
|
UA
-
NYSE
Under Armour Inc Cl A
CONSUMER NON-DURABLES - Textile - Apparel Clothing
|
$105.75
|
+4.07
4.00% |
$106.12
|
1,231,471
124.34% of 50 DAV
50 DAV is 990,400
|
$107.15
-1.31%
|
2/15/2012
|
$85.77
|
PP = $84.86
|
|
MB = $89.10
|
Most Recent Note - 6/15/2012 8:29:32 PM
G - Rallied with above average volume today for its second best close ever. It was previously noted - "No resistance remains due to overhead supply. Fundamental concerns remain after a slightly sub par earnings increase in the Dec '11 quarter."
>>> The latest Featured Stock Update with an annotated graph appeared on 5/29/2012. Click here.
View all notes |
Alert me of new notes |
CANSLIM.net Company Profile |
SEC |
Zacks Reports |
StockTalk |
News |
Chart |
Request a new note
C
A N
S L
I M
|
VSI
-
NYSE
Vitamin Shoppe Inc
SPECIALTY RETAIL - Specialty Retail, Other
|
$50.38
|
+1.34
2.73% |
$50.55
|
675,364
148.27% of 50 DAV
50 DAV is 455,500
|
$55.29
-8.88%
|
4/25/2012
|
$47.77
|
PP = $48.46
|
|
MB = $50.88
|
Most Recent Note - 6/15/2012 8:31:11 PM
Y - Finished near the session high today with a solid gain on above average volume, finding support above prior highs in the $48 area and above its 50 DMA line which coincide defining important chart support. One may consider a secondary buy point from its successful test of the 10 week average up to +5% above the recent high. Disciplined investors always limit losses by selling if a stock falls more than -7% from their buy price.
>>> The latest Featured Stock Update with an annotated graph appeared on 6/4/2012. Click here.
View all notes |
Alert me of new notes |
CANSLIM.net Company Profile |
SEC |
Zacks Reports |
StockTalk |
News |
Chart |
Request a new note
C
A N
S L
I M
|
WFM
-
NASDAQ
Whole Foods Market Inc
RETAIL - Grocery Stores
|
$94.47
|
+2.93
3.20% |
$95.00
|
3,167,715
171.89% of 50 DAV
50 DAV is 1,842,900
|
$92.00
2.68%
|
6/13/2012
|
$89.90
|
PP = $91.60
|
|
MB = $96.18
|
Most Recent Note - 6/15/2012 8:32:58 PM
Y - Rallied to a new 52-week high today with +72% above average volume, confirming a technical buy signal. No resistance remains due to overhead supply. Its 50 DMA line and prior lows define important near-term support.
>>> The latest Featured Stock Update with an annotated graph appeared on 6/13/2012. Click here.
View all notes |
Alert me of new notes |
CANSLIM.net Company Profile |
SEC |
Zacks Reports |
StockTalk |
News |
Chart |
Request a new note
C
A N
S L
I M
|
|
|
|
THESE ARE NOT BUY RECOMMENDATIONS!
Comments contained in the body of this report are technical
opinions only. The material herein has been obtained
from sources believed to be reliable and accurate, however,
its accuracy and completeness cannot be guaranteed.
This site is not an investment advisor, hence it does
not endorse or recommend any securities or other investments.
Any recommendation contained in this report may not
be suitable for all investors and it is not to be deemed
an offer or solicitation on our part with respect to
the purchase or sale of any securities. All trademarks,
service marks and trade names appearing in this report
are the property of their respective owners, and are
likewise used for identification purposes only.
This report is a service available
only to active Paid Premium Members.
You may opt-out of receiving report notifications
at any time. Questions or comments may be submitted
by writing to Premium Membership Services 665 S.E. 10 Street, Suite 201 Deerfield Beach, FL 33441-5634 or by calling 1-800-965-8307
or 954-785-1121.
|
|
|

