You are not logged in.
This means you
CAN ONLY VIEW reports that were published prior to Monday, April 14, 2025.
You
MUST UPGRADE YOUR MEMBERSHIP if you want to see any current reports.
AFTER MARKET UPDATE - WEDNESDAY, JUNE 15TH, 2011
Previous After Market Report Next After Market Report >>>
|
|
|
|
DOW |
-178.84 |
11,897.27 |
-1.48% |
|
Volume |
1,068,800,610 |
+17% |
|
Volume |
1,933,612,320 |
+16% |
|
NASDAQ |
-47.26 |
2,631.46 |
-1.76% |
|
Advancers |
461 |
15% |
|
Advancers |
551 |
20% |
|
S&P 500 |
-22.45 |
1,265.42 |
-1.74% |
|
Decliners |
2,598 |
83% |
|
Decliners |
2,077 |
76% |
|
Russell 2000 |
-14.53 |
779.46 |
-1.83% |
|
52 Wk Highs |
23 |
|
|
52 Wk Highs |
11 |
|
|
S&P 600 |
-6.61 |
419.65 |
-1.55% |
|
52 Wk Lows |
79 |
|
|
52 Wk Lows |
114 |
|
|
The latest June 2011 issue of CANSLIM.net News is now available (click here). Please note the Featured Stocks in Review section includes the last notes of the past month or the last note published for any stocks that were recently dropped from the Featured Stocks list. The most recent notes for current leaders included on the Featured Stocks page are always displayed on the page, and the latest notes are also copied and included in the After Market Update daily, located in the full table just below the Featured Stock Update section.
Recent questions from members were answered in the "Ken's Mailbag" segment. They are all available for your review if you missed them - (click here).
The Q2 2011 Webcast is scheduled for Wednesday, June 29th at 8PM EST and it will be available "ON DEMAND" afterward via links on the Premium Member Homepage. If you have a question that you would like to have answered please submit it via the inquiry form (click here). Your questions may be answered in the upcoming webcast for the benefit of all upgraded members!
|
 |
Indices End Unanimously Lower as Correction Worsens
Kenneth J. Gruneisen - Passed the CAN SLIM® Master's Exam
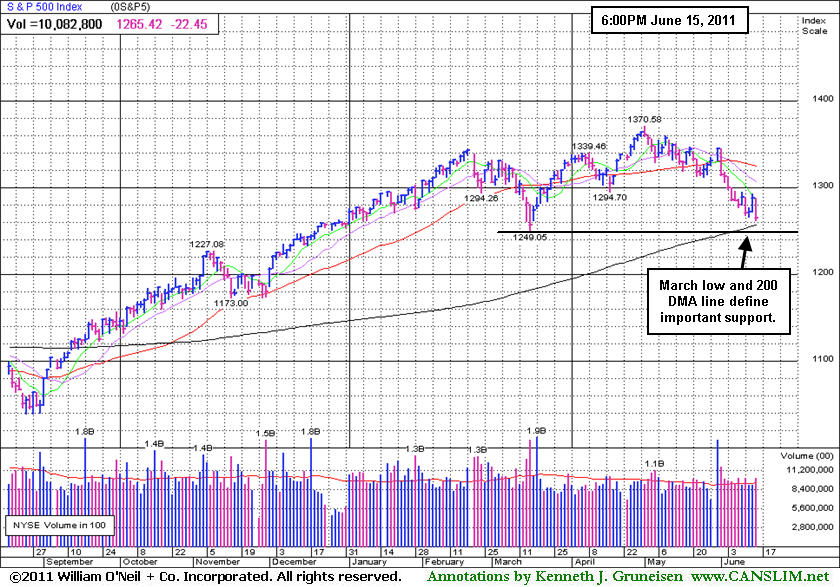
The major averages' losses on Wednesday completely erased the prior session's gains. Additionally, the recent rally's Day 1 lows were violated, quickly ending the rally attempt as the market correction worsened. Decliners led advancers by nearly 5-1 on the NYSE and by nearly 4-1 on the Nasdaq exchange. Higher volume totals reported on the NYSE and on the Nasdaq exchange made it clear that institutional investors were more aggressively selling stocks again, adding to the recent patch of damaging distributional losses for the major averages. New 52-week lows solidly outnumbered new 52-week highs on both the NYSE and on the Nasdaq exchange. Only 5 high-ranked companies from the CANSLIM.net Leaders List made new 52-week highs and appeared on the CANSLIM.net BreakOuts Page, down from 11 on the prior session. There was also only 1 small gainer out of the 16 of the high-ranked leaders currently included on the Featured Stocks Page.
The market slumped after European leaders failed to agree on a second aid package for Greece, and protests in Greece turned violent. Credit ratings agency Moody's said it may downgrade its ratings of France's three largest banks because of their exposure to Greek debt. The euro tumbled against the dollar. Crude oil settled below $95 in New York for the first time since February.
U.S. economic reports were also a disappointment to investors. The government's consumer price index excluding food and energy rose 0.2% in May, the most since July 2008, and more than forecast. Meanwhile, a reading of New York state factory activity unexpectedly shrank in June. May industrial production increased 0.1%, less than expected, restrained by a drop in utility output.
Chip equipment stocks came under pressure after a research group, Gartner, said it sees capital spending falling due to a "looming semiconductor inventory correction." Owens Illinois Inc (OI -13.54%) slumped after the Containers/Packaging firm lowered its earnings forecast. Pandora Media Inc (P +9.06%) created some excitement on its first day after pricing its Initial Public Offering at $16 per share, above its target range, but closing the session at $17.42, well below the $26.00 high for the day.
The June 2011 issue of CANSLIM.net News (read here) is now available to all upgraded members. Only UPGRADED members will also have access to the upcoming Q2 2011 Webcast scheduled for Wednesday, June 29th at 8PM EST.
Recent weak action was noted as the market (M criteria) correction caused more worrisome technical damage, reminding investors to raise cash and reduce exposure until a new confirmed rally with follow-through day (FTD) occurs.
PICTURED: The S&P 500 Index slumped toward its 200-day moving average (DMA) line and March lows defining important near-term chart support to watch.
|
 Kenneth J. Gruneisen started out as a licensed stockbroker in August 1987, a couple of months prior to the historic stock market crash that took the Dow Jones Industrial Average down -22.6% in a single day. He has published daily fact-based fundamental and technical analysis on high-ranked stocks online for two decades. Through FACTBASEDINVESTING.COM, Kenneth provides educational articles, news, market commentary, and other information regarding proven investment systems that work in good times and bad.
Comments contained in the body of this report are technical opinions only and are not necessarily those of Gruneisen Growth Corp. The material herein has been obtained from sources believed to be reliable and accurate, however, its accuracy and completeness cannot be guaranteed. Our firm, employees, and customers may effect transactions, including transactions contrary to any recommendation herein, or have positions in the securities mentioned herein or options with respect thereto. Any recommendation contained in this report may not be suitable for all investors and it is not to be deemed an offer or solicitation on our part with respect to the purchase or sale of any securities. |
|
 |
Financial, Tech, Retail, and Energy Indexes Sink
Kenneth J. Gruneisen - Passed the CAN SLIM® Master's Exam
Losses in the Networking Index ($NWX -2.78%), Internet Index ($IIX -2.12%), and Semiconductor Index ($SOX -2.04%) led the tech sector's retreat while the Biotechnology Index ($BTK -0.18%) held up reasonably well. Energy-related shares faced pressure as the Oil Services Index ($OSX -2.00%) and Integrated Oil Index ($XOI -2.53%) sank. The weakness in the Retail Index ($RLX -1.73%) and financial shares had a negative influence on the major averages as the Broker/Dealer Index ($XBD -2.27%) and Bank Index ($BKX -1.62%) slumped. The Healthcare Index ($HMO -2.23%) and Gold & Silver Index ($XAU -0.52%) rounded out a widely negative session with losses even weighing on defensive groups.
Charts courtesy www.stockcharts.com
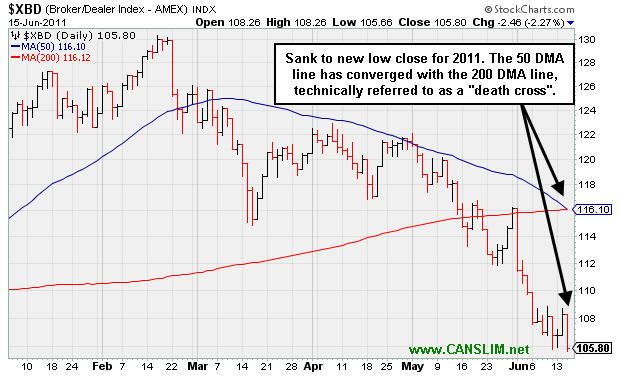
PICTURED: The Broker/Dealer Index ($XBD -2.27%) sank to a new low close for 2011. Its 50-day moving average (DMA) line has converged with its 200 DMA line, technically referred to as a "death cross".
| Oil Services |
$OSX |
252.96 |
-5.16 |
-2.00% |
+3.20% |
| Healthcare |
$HMO |
2,320.62 |
-52.82 |
-2.23% |
+37.15% |
| Integrated Oil |
$XOI |
1,244.39 |
-32.30 |
-2.53% |
+2.57% |
| Semiconductor |
$SOX |
398.44 |
-8.31 |
-2.04% |
-3.25% |
| Networking |
$NWX |
282.37 |
-8.08 |
-2.78% |
+0.65% |
| Internet |
$IIX |
293.68 |
-6.38 |
-2.13% |
-4.57% |
| Broker/Dealer |
$XBD |
105.81 |
-2.45 |
-2.26% |
-12.92% |
| Retail |
$RLX |
498.94 |
-8.79 |
-1.73% |
-1.86% |
| Gold & Silver |
$XAU |
193.62 |
-1.02 |
-0.52% |
-14.55% |
| Bank |
$BKX |
46.68 |
-0.77 |
-1.62% |
-10.59% |
| Biotech |
$BTK |
1,413.73 |
-2.83 |
-0.20% |
+8.95% |
|
|
|
 |
Quiet Consolidation; Latest Earnings Increase Under +25%
Kenneth J. Gruneisen - Passed the CAN SLIM® Master's Exam
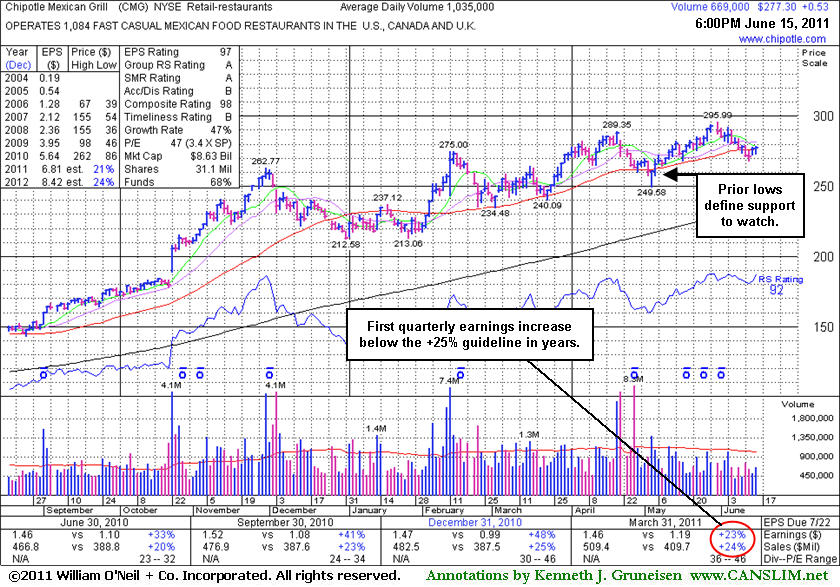
Chipotle Mexican Grill, Inc. (CMG +$0.53 or +0.19% to $277.30) has been consolidating near its 50-day moving average (DMA) line, but it has not formed a sound base pattern. An upward trendline connecting its July 2010 and May 2011 lows (not shown) defines a near-term technical support level to watch that comes into play just above prior lows which are illustrated on the graph below. It is still perched just -6.3% off its 52-week high with very little resistance due to overhead supply. It was last shown in the FSU section on 5/17/11 with an annotated graph under the headline, "Latest Earnings Increase Under Guidelines", yet it went on to inch up even higher for a new all-time high without great volume conviction behind its gains. None of its recent losses has been on heavy volume either, which is a somewhat encouraging sign. Subsequent deterioration to new low closes would raise greater concerns and a violation of its recent low ($249.58) would trigger a more worrisome technical sell signal.
CMG currently has a B rating for Accumulation/Distribution. Ownership by top-rated funds rose from 530 in Mar '10 to 689 in Mar '11, a nice reassurance concerning the I criteria of the investment system. Sales revenues increases have been strong, however the quarter ended March 31, 2011 showed earnings +23% (see red circle). That was the first increase under the +25% guideline for the C criteria in years, raising some concerns. It has a good annual (A criteria) earnings history.
|
|
|
Color Codes Explained :
Y - Better candidates highlighted by our
staff of experts.
G - Previously featured
in past reports as yellow but may no longer be buyable under the
guidelines.
***Last / Change / Volume data in this table is the closing quote data***
Symbol/Exchange
Company Name
Industry Group |
PRICE |
CHANGE
(%Change) |
Day High |
Volume
(% DAV)
(% 50 day avg vol) |
52 Wk Hi
% From Hi |
Featured
Date |
Price
Featured |
Pivot Featured |
|
Max Buy |
CACC
-
NASDAQ
Credit Acceptance Corp
FINANCIAL SERVICES - Credit Services
|
$78.02
|
+0.00
0.00% |
$78.98
|
33,257
88.21% of 50 DAV
50 DAV is 37,700
|
$82.29
-5.19%
|
6/2/2011
|
$76.10
|
PP = $82.39
|
|
MB = $86.51
|
Most Recent Note - 6/14/2011 12:23:14 PM
G - This high-ranked leader in the Finance - Consumer Loans industry has been consolidating in a tight range near its 50 DMA line. It faces some resistance up through the $82 level due to overhead supply
>>> The latest Featured Stock Update with an annotated graph appeared on 6/6/2011. Click here.
View all notes |
Alert me of new notes |
CANSLIM.net Company Profile |
SEC |
Zacks Reports |
StockTalk |
News |
Chart |
Request a new note
C
A N
S L
I M


|
CEVA
-
NASDAQ
Ceva Inc
ELECTRONICS - Semiconductor - Specialized
|
$30.06
|
-1.18
-3.78% |
$31.08
|
157,355
70.66% of 50 DAV
50 DAV is 222,700
|
$35.60
-15.56%
|
5/25/2011
|
$32.98
|
PP = $32.05
|
|
MB = $33.65
|
 Most Recent Note - 6/15/2011 4:58:43 PM
G - Loss today with lighter volume led to another close just below its 50 DMA line. It has not formed a sound base pattern. Its prior low ($27.82 on 5/17/11) defines the next important chart support level to watch.
>>> The latest Featured Stock Update with an annotated graph appeared on 5/25/2011. Click here.
View all notes |
Alert me of new notes |
CANSLIM.net Company Profile |
SEC |
Zacks Reports |
StockTalk |
News |
Chart |
Request a new note
C
A N
S L
I M
|
CMG
-
NYSE
Chipotle Mexican Grill
LEISURE - Restaurants
|
$277.30
|
+0.53
0.19% |
$278.78
|
669,097
64.65% of 50 DAV
50 DAV is 1,035,000
|
$295.99
-6.31%
|
4/1/2011
|
$274.00
|
PP = $275.10
|
|
MB = $288.86
|
Most Recent Note - 6/15/2011 7:07:38 PM
G - Small gain today, consolidating near its 50 DMA line. It has not formed a sound base pattern. An upward trendline connecting its July 2010 and May 2011 lows defines an initial technical support level to watch. See the latest FSU analysis for more details and a new annotated graph.
>>> The latest Featured Stock Update with an annotated graph appeared on 6/15/2011. Click here.
View all notes |
Alert me of new notes |
CANSLIM.net Company Profile |
SEC |
Zacks Reports |
StockTalk |
News |
Chart |
Request a new note
C
A N
S L
I M
|
EZPW
-
NASDAQ
Ezcorp Inc Cl A
SPECIALTY RETAIL - Specialty Retail, Other
|
$31.20
|
-0.33
-1.05% |
$31.78
|
329,233
92.79% of 50 DAV
50 DAV is 354,800
|
$33.31
-6.33%
|
6/13/2011
|
$31.18
|
PP = $33.41
|
|
MB = $35.08
|
Most Recent Note - 6/13/2011 6:50:20 PM
Y - Consolidating -6.4% off its 52-week high. Color code is changed to yellow with new pivot point cited following a choppy cup-with-handle base. Recent lows and its 50 DMA line define important nearby chart support. The M criteria argues against new buying efforts without a FTD from at least one of the major averages as confirmation of a new rally. See the latest FSU analysis for more details and a new annotated graph.
>>> The latest Featured Stock Update with an annotated graph appeared on 6/13/2011. Click here.
View all notes |
Alert me of new notes |
CANSLIM.net Company Profile |
SEC |
Zacks Reports |
StockTalk |
News |
Chart |
Request a new note
C
A N
S L
I M
|
FCFS
-
NASDAQ
First Cash Financial Svs
SPECIALTY RETAIL - Specialty Retail, Other
|
$39.62
|
-0.24
-0.60% |
$40.00
|
134,753
70.59% of 50 DAV
50 DAV is 190,900
|
$42.36
-6.47%
|
5/31/2011
|
$42.00
|
PP = $40.23
|
|
MB = $42.24
|
Most Recent Note - 6/10/2011 5:00:15 PM
G - Recently found support near its 50 DMA line and prior lows. Its color code was changed to green after damaging losses on higher volume negated its latest breakout.
>>> The latest Featured Stock Update with an annotated graph appeared on 5/31/2011. Click here.
View all notes |
Alert me of new notes |
CANSLIM.net Company Profile |
SEC |
Zacks Reports |
StockTalk |
News |
Chart |
Request a new note
C
A N
S L
I M
|
Symbol/Exchange
Company Name
Industry Group |
PRICE |
CHANGE
(%Change) |
Day High |
Volume
(% DAV)
(% 50 day avg vol) |
52 Wk Hi
% From Hi |
Featured
Date |
Price
Featured |
Pivot Featured |
|
Max Buy |
FOSL
-
NASDAQ
Fossil Inc
CONSUMER DURABLES - Recreational Goods, Other
|
$106.40
|
-1.32
-1.23% |
$107.60
|
607,115
81.99% of 50 DAV
50 DAV is 740,500
|
$110.61
-3.81%
|
2/1/2011
|
$73.30
|
PP = $74.44
|
|
MB = $78.16
|
Most Recent Note - 6/10/2011 5:02:09 PM
G - Touched a new 52-week high today but encountered distributional pressure while completing the 5th week of trading in a tight range forming a "late-stage" base. Prior highs near $96 define initial support to watch coinciding with its 50 DMA line.
>>> The latest Featured Stock Update with an annotated graph appeared on 6/7/2011. Click here.
View all notes |
Alert me of new notes |
CANSLIM.net Company Profile |
SEC |
Zacks Reports |
StockTalk |
News |
Chart |
Request a new note
C
A N
S L
I M
|
HS
-
NYSE
Healthspring Inc
HEALTH SERVICES - Health Care Plans
|
$42.16
|
-0.66
-1.54% |
$43.43
|
730,132
86.49% of 50 DAV
50 DAV is 844,200
|
$45.11
-6.54%
|
3/22/2011
|
$38.29
|
PP = $38.85
|
|
MB = $40.79
|
Most Recent Note - 6/14/2011 1:04:14 PM
G - Small gap up today after losses on higher (near average) while consolidating near its 50 DMA line. That important short-term average and recent lows define chart support to watch where violations would trigger technical sell signals.
>>> The latest Featured Stock Update with an annotated graph appeared on 5/20/2011. Click here.
View all notes |
Alert me of new notes |
CANSLIM.net Company Profile |
SEC |
Zacks Reports |
StockTalk |
News |
Chart |
Request a new note
C
A N
S L
I M
|
INFA
-
NASDAQ
Informatica Corp
COMPUTER SOFTWARE and SERVICES - Business Software and Services
|
$53.59
|
-1.01
-1.84% |
$54.36
|
2,480,699
206.36% of 50 DAV
50 DAV is 1,202,100
|
$59.98
-10.65%
|
3/24/2011
|
$50.04
|
PP = $49.86
|
|
MB = $52.35
|
Most Recent Note - 6/15/2011 7:12:06 PM
G - Small loss today twice average volume, slumping to a close below its 50 DMA line, raising concerns. Gains have lacked volume conviction since it hit a new 52-week high on 6/01/11 and there was a negative reversal noted. This high-ranked Computer Software - Database firm did not form a sound new base pattern.
>>> The latest Featured Stock Update with an annotated graph appeared on 5/24/2011. Click here.
View all notes |
Alert me of new notes |
CANSLIM.net Company Profile |
SEC |
Zacks Reports |
StockTalk |
News |
Chart |
Request a new note
C
A N
S L
I M
|
MWIV
-
NASDAQ
M W I Veterinary Supply
HEALTH SERVICES - Medical Instruments and; Supplies
|
$79.13
|
-1.79
-2.21% |
$80.35
|
31,543
35.68% of 50 DAV
50 DAV is 88,400
|
$86.99
-9.04%
|
11/4/2010
|
$61.79
|
PP = $59.60
|
|
MB = $62.58
|
Most Recent Note - 6/14/2011 1:12:42 PM
G - Gains have lacked volume conviction following its 50 DMA line violation, and that important short-term average has now been acting as resistance.
>>> The latest Featured Stock Update with an annotated graph appeared on 6/9/2011. Click here.
View all notes |
Alert me of new notes |
CANSLIM.net Company Profile |
SEC |
Zacks Reports |
StockTalk |
News |
Chart |
Request a new note
C
A N
S L
I M
|
OPNT
-
NASDAQ
Opnet Technologies
INTERNET - Internet Software and Services
|
$36.37
|
-1.21
-3.22% |
$37.32
|
84,455
64.37% of 50 DAV
50 DAV is 131,200
|
$42.51
-14.44%
|
5/11/2011
|
$41.21
|
PP = $40.50
|
|
MB = $42.53
|
Most Recent Note - 6/15/2011 5:02:54 PM
G - Gapped down today and its loss on light volume led to its lowest close since 4/12/11. It slumped further below its 50 DMA line, and subsequent deterioration under its prior low would raise more serious concerns.
>>> The latest Featured Stock Update with an annotated graph appeared on 6/10/2011. Click here.
View all notes |
Alert me of new notes |
CANSLIM.net Company Profile |
SEC |
Zacks Reports |
StockTalk |
News |
Chart |
Request a new note
C
A N
S L
I M
|
Symbol/Exchange
Company Name
Industry Group |
PRICE |
CHANGE
(%Change) |
Day High |
Volume
(% DAV)
(% 50 day avg vol) |
52 Wk Hi
% From Hi |
Featured
Date |
Price
Featured |
Pivot Featured |
|
Max Buy |
OTEX
-
NASDAQ
Open Text Corp
INTERNET - Internet Software and Services
|
$59.29
|
-0.87
-1.45% |
$60.02
|
137,783
40.98% of 50 DAV
50 DAV is 336,200
|
$67.08
-11.61%
|
6/1/2011
|
$65.86
|
PP = $67.18
|
|
MB = $70.54
|
Most Recent Note - 6/15/2011 5:05:03 PM
G - This week it halted its losing streak near highs prior to its 3/29/11 breakout. It now faces resistance due to the overhead supply created while trading at higher levels in recent months. Technically, gains above its 50 DMA line are needed for its outlook to improve.
>>> The latest Featured Stock Update with an annotated graph appeared on 6/2/2011. Click here.
View all notes |
Alert me of new notes |
CANSLIM.net Company Profile |
SEC |
Zacks Reports |
StockTalk |
News |
Chart |
Request a new note
C
A N
S L
I M
|
PCLN
-
NASDAQ
Priceline.Com Inc
INTERNET - Internet Software and Services
|
$471.17
|
-9.55
-1.99% |
$480.99
|
1,043,512
100.06% of 50 DAV
50 DAV is 1,042,900
|
$561.88
-16.14%
|
1/3/2011
|
$399.55
|
PP = $428.20
|
|
MB = $449.61
|
Most Recent Note - 6/15/2011 5:10:33 PM
Volume today was near average as it slumped for a 4th consecutive loss. Deterioration further under the previously noted chart low ($487.70 on 5/25/11) it violated this week raises greater concerns. Based on weakness it will be dropped from the Featured Stocks list tonight. Technically, a rally back above its 50 DMA line is needed for its outlook to improve.
>>> The latest Featured Stock Update with an annotated graph appeared on 5/19/2011. Click here.
View all notes |
Alert me of new notes |
CANSLIM.net Company Profile |
SEC |
Zacks Reports |
StockTalk |
News |
Chart |
Request a new note
C
A N
S L
I M
|
RAX
-
NYSE
Rackspace Hosting Inc
INTERNET - Internet Software and; Services
|
$40.12
|
-1.02
-2.48% |
$41.28
|
1,240,456
69.63% of 50 DAV
50 DAV is 1,781,500
|
$46.50
-13.71%
|
6/3/2011
|
$43.36
|
PP = $46.59
|
|
MB = $48.92
|
Most Recent Note - 6/15/2011 5:12:51 PM
G - Small loss today on lighter volume led to its lowest close since 3/29/11. Gains have lacked conviction following its damaging 50 DMA line violation. A subsequent breach of its recent chart low ($38.84 on 5/12/11) would trigger a more worrisome technical sell signal.
>>> The latest Featured Stock Update with an annotated graph appeared on 6/14/2011. Click here.
View all notes |
Alert me of new notes |
CANSLIM.net Company Profile |
SEC |
Zacks Reports |
StockTalk |
News |
Chart |
Request a new note
C
A N
S L
I M
|
SWI
-
NYSE
Solarwinds Inc
COMPUTER SOFTWARE and SERVICES - Application Software
|
$25.20
|
-0.96
-3.67% |
$26.68
|
2,578,483
414.81% of 50 DAV
50 DAV is 621,600
|
$26.42
-4.62%
|
6/7/2011
|
$24.22
|
PP = $25.05
|
|
MB = $26.30
|
Most Recent Note - 6/15/2011 5:18:47 PM
Y - Hit another new high and traded above its max buy level today, but closed at the session low with a loss after a worrisome negative reversal with volume 4 times average. Technically, it had gapped up and rallied for a considerable gain with heavy volume above its pivot point on 6/14/11 and triggered a technical buy signal. Previously noted - "Concerns remain until a follow-through day confirms the broader market (M criteria) is truly favorable."
>>> The latest Featured Stock Update with an annotated graph appeared on 6/8/2011. Click here.
View all notes |
Alert me of new notes |
CANSLIM.net Company Profile |
SEC |
Zacks Reports |
StockTalk |
News |
Chart |
Request a new note
C
A N
S L
I M
|
ULTA
-
NASDAQ
Ulta Salon Cosm & Frag
SPECIALTY RETAIL - Specialty Retail, Other
|
$57.03
|
-2.28
-3.84% |
$59.40
|
1,070,839
157.04% of 50 DAV
50 DAV is 681,900
|
$59.35
-3.91%
|
1/6/2011
|
$36.12
|
PP = $37.34
|
|
MB = $39.21
|
Most Recent Note - 6/15/2011 4:57:02 PM
G - Pulled back from its all-time high today with a loss on above average volume. It has not formed a sound base pattern. The M criteria argues against new buying efforts in stocks until a new confirmed rally with follow-through day from at least one of the major averages.
>>> The latest Featured Stock Update with an annotated graph appeared on 5/26/2011. Click here.
View all notes |
Alert me of new notes |
CANSLIM.net Company Profile |
SEC |
Zacks Reports |
StockTalk |
News |
Chart |
Request a new note
C
A N
S L
I M
|
Symbol/Exchange
Company Name
Industry Group |
PRICE |
CHANGE
(%Change) |
Day High |
Volume
(% DAV)
(% 50 day avg vol) |
52 Wk Hi
% From Hi |
Featured
Date |
Price
Featured |
Pivot Featured |
|
Max Buy |
ZAGG
-
NASDAQ
Zagg Inc
SPECIALTY RETAIL - Specialty Retail, Other
|
$12.15
|
-0.40
-3.19% |
$12.62
|
1,375,210
110.03% of 50 DAV
50 DAV is 1,249,900
|
$13.05
-6.90%
|
6/1/2011
|
$10.92
|
PP = $10.59
|
|
MB = $11.12
|
Most Recent Note - 6/15/2011 7:09:02 PM
G - Pulled back from its all-time high today after 3 consecutive gains backed by above average volume. It is extended from the previously noted cup-with-handle type base pattern. Its recent low ($10.15 on 6/07/11) now defines an important near-term chart support level to watch on pullbacks.
>>> The latest Featured Stock Update with an annotated graph appeared on 6/1/2011. Click here.
View all notes |
Alert me of new notes |
CANSLIM.net Company Profile |
SEC |
Zacks Reports |
StockTalk |
News |
Chart |
Request a new note
C
A N
S L
I M
|
|
|
|
THESE ARE NOT BUY RECOMMENDATIONS!
Comments contained in the body of this report are technical
opinions only. The material herein has been obtained
from sources believed to be reliable and accurate, however,
its accuracy and completeness cannot be guaranteed.
This site is not an investment advisor, hence it does
not endorse or recommend any securities or other investments.
Any recommendation contained in this report may not
be suitable for all investors and it is not to be deemed
an offer or solicitation on our part with respect to
the purchase or sale of any securities. All trademarks,
service marks and trade names appearing in this report
are the property of their respective owners, and are
likewise used for identification purposes only.
This report is a service available
only to active Paid Premium Members.
You may opt-out of receiving report notifications
at any time. Questions or comments may be submitted
by writing to Premium Membership Services 665 S.E. 10 Street, Suite 201 Deerfield Beach, FL 33441-5634 or by calling 1-800-965-8307
or 954-785-1121.
|
|
|

