You are not logged in.
This means you
CAN ONLY VIEW reports that were published prior to Monday, April 14, 2025.
You
MUST UPGRADE YOUR MEMBERSHIP if you want to see any current reports.
AFTER MARKET UPDATE - THURSDAY, JUNE 14TH, 2012
Previous After Market Report Next After Market Report >>>
|
|
|
|
DOW |
+155.53 |
12,651.91 |
+1.24% |
|
Volume |
779,141,060 |
+10% |
|
Volume |
1,586,440,220 |
+2% |
|
NASDAQ |
+17.72 |
2,836.33 |
+0.63% |
|
Advancers |
2,213 |
69% |
|
Advancers |
1,732 |
67% |
|
S&P 500 |
+14.22 |
1,329.10 |
+1.08% |
|
Decliners |
901 |
28% |
|
Decliners |
735 |
28% |
|
Russell 2000 |
+9.96 |
762.34 |
+1.32% |
|
52 Wk Highs |
61 |
|
|
52 Wk Highs |
34 |
|
|
S&P 600 |
+5.15 |
425.22 |
+1.23% |
|
52 Wk Lows |
54 |
|
|
52 Wk Lows |
68 |
|
|
 |
Major Averages Rose Despite Worse Jobless Claims
Kenneth J. Gruneisen - Passed the CAN SLIM® Master's Exam
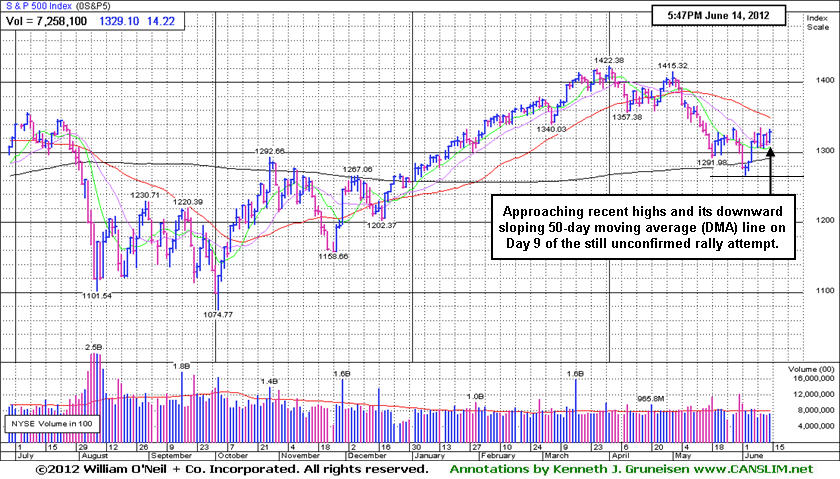
The major averages posted gains on Thursday's session, but they were not strong enough gains percentage-wise to be considered a solid follow-through day confirming the latest rally attempt. Volume totals were slightly higher on the Nasdaq exchange and on the NYSE versus the prior session, but the volume totals remained below average. Breadth was positive as advancers led decliners by more than a 2-1 ratio on the NYSE and on the Nasdaq exchange. The total number of new 52-week highs exceeded new 52-week lows on the NYSE, but new 52-week lows again exceeded new 52-week highs on the Nasdaq exchange. There were 24 high-ranked companies from the CANSLIM.net Leaders List made new 52-week highs and appeared on the CANSLIM.net BreakOuts Page, up from the prior session total of 19 stocks. At the close there gains for 10 of the 14 high-ranked companies currently included on the Featured Stocks Page.
Markets toggled between gains and losses as investors digested U.S. economic data. Weekly jobless claims came in at 386,000, more than the projected 375,000. In a separate report, inflation eased in May with the consumer price index falling by -0.3%. Investors also remain cautious on the uncertainties in Europe while heading into the Greek elections on Sunday. Regardless of the reasons pundits may point to for why stocks rose, it was an encouraging sign to see the market shake off negative news. Despite the weaker-than-expected result in weekly jobless claims, equities traded higher throughout the day on speculation that the Federal Reserve could provide further stimulus. In the final hour of trading, stocks extended gains after reports circulated that several central banks were prepared to increase liquidity in financial markets if needed.
All 10 sectors on the S&P were higher. Consumer stocks had gains as shares of McDonald's Corp (MCD +1.99%) and AT&T Inc (T +2.03%) were in the green. Meanwhile, Nokia Inc (NOK -15.77%) fell after the company announced plans to cut 10,000 jobs and lowered their earnings guidance.
In bondland, Treasuries were lower along the curve. The benchmark 10-year note gave up 11 ticks to yield 1.63% and the 30-year bond was off 5/16 of a point to yield 2.72%.
Technically, the major averages (M criteria) are still considered to be in a rally attempt within an ongoing correction, and stocks may still be vulnerable to greater downside. Historical studies suggest that the most constructive market rallies produced a solid follow-through day (FTD) between Days 4-7 of a new rally effort. Although we are beyond that most ideal window, subsequent gains of +1.4% or greater by at least one of the major indexes, backed by higher volume (preferably above average volume) and coupled with an expansion in the number of stocks hitting new highs, could still confirm the rally as long as the "Day 1" lows are not undercut. Only fresh technical proof may give fact-based investors the clearance to begin with new buying efforts strictly in sound buy candidates. Meanwhile, investors should keep up a watchlist of worthy buy candidates while remaining protective of capital.
The Q2 2012 Webcast is scheduled for Wednesday, June 27th at 8PM EST and will be available "ON DEMAND" afterward. All who have the UPGRADED membership now get access to these informative *Quarterly Webcasts included at no additional cost. (*Previously sold separately at $99 per webcast.) Links to archived webcasts and all prior reports are on the Premium Member Homepage. Please use the inquiry form to submit any questions that you would like to see answered in the upcoming webcast or to make any suggestions or comments about our website and services. Thank you!
PICTURED: The S&P 500 Index is approaching recent highs and its downward sloping 50-day moving average (DMA) line on Day 9 of the still unconfirmed rally attempt.
|
 Kenneth J. Gruneisen started out as a licensed stockbroker in August 1987, a couple of months prior to the historic stock market crash that took the Dow Jones Industrial Average down -22.6% in a single day. He has published daily fact-based fundamental and technical analysis on high-ranked stocks online for two decades. Through FACTBASEDINVESTING.COM, Kenneth provides educational articles, news, market commentary, and other information regarding proven investment systems that work in good times and bad.
Comments contained in the body of this report are technical opinions only and are not necessarily those of Gruneisen Growth Corp. The material herein has been obtained from sources believed to be reliable and accurate, however, its accuracy and completeness cannot be guaranteed. Our firm, employees, and customers may effect transactions, including transactions contrary to any recommendation herein, or have positions in the securities mentioned herein or options with respect thereto. Any recommendation contained in this report may not be suitable for all investors and it is not to be deemed an offer or solicitation on our part with respect to the purchase or sale of any securities. |
|
 |
Medical, Retail, Financial, and Commodity-Linked Indexes Rose
Kenneth J. Gruneisen - Passed the CAN SLIM® Master's Exam
The Biotechnology Index ($BTK +2.14%) and Healthcare Index ($HMO +1.59%) were Thursday's leading gainers. A gain for the Retail Index ($RLX +1.21%) and strength in financial shares also helped provide a positive influence for the major averages as the Bank Index ($BKX +1.45%) and Broker/Dealer Index ($XBD +1.16%) posted gains. The Networking Index ($NWX +0.42%) posted a modest gain but the Semiconductor Index ($SOX -0.17%) and Internet Index ($IIX +0.07%) sputtered. Commodity-linked groups rose as the Gold & Silver Index ($XAU +0.69%), Integrated Oil Index ($XOI +1.09%), and Oil Services Index ($OSX +1.18%) rounded out a positive session for most industry groups.
Charts courtesy www.stockcharts.com
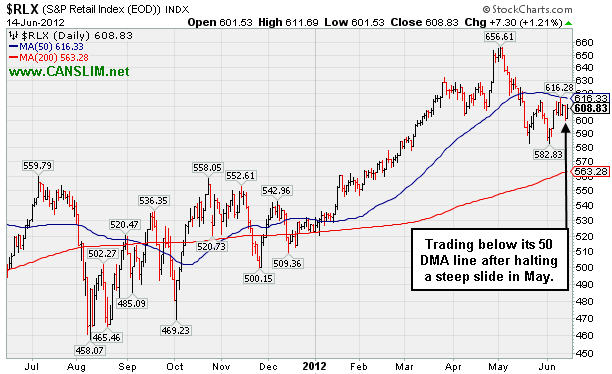
PICTURED: The Retail Index ($RLX +1.21%) is trading below its 50-day moving average (DMA) line after halting a steep slide in May. A rally above that short-term average would help the market outlook, but deterioration below recent lows would bode poorly.
| Oil Services |
$OSX |
199.65 |
+2.33 |
+1.18% |
-7.69% |
| Healthcare |
$HMO |
2,229.44 |
+34.97 |
+1.59% |
-2.29% |
| Integrated Oil |
$XOI |
1,130.32 |
+12.24 |
+1.09% |
-8.04% |
| Semiconductor |
$SOX |
369.15 |
-0.64 |
-0.17% |
+1.29% |
| Networking |
$NWX |
205.53 |
+0.86 |
+0.42% |
-4.48% |
| Internet |
$IIX |
294.07 |
+0.20 |
+0.07% |
+4.38% |
| Broker/Dealer |
$XBD |
85.14 |
+0.98 |
+1.16% |
+2.25% |
| Retail |
$RLX |
608.83 |
+7.30 |
+1.21% |
+16.37% |
| Gold & Silver |
$XAU |
163.69 |
+1.12 |
+0.69% |
-9.38% |
| Bank |
$BKX |
44.05 |
+0.63 |
+1.45% |
+11.86% |
| Biotech |
$BTK |
1,431.92 |
+29.98 |
+2.14% |
+31.20% |
|
|
|
 |
New Pivot Point Cited While Building Based During Market Correction
Kenneth J. Gruneisen - Passed the CAN SLIM® Master's Exam
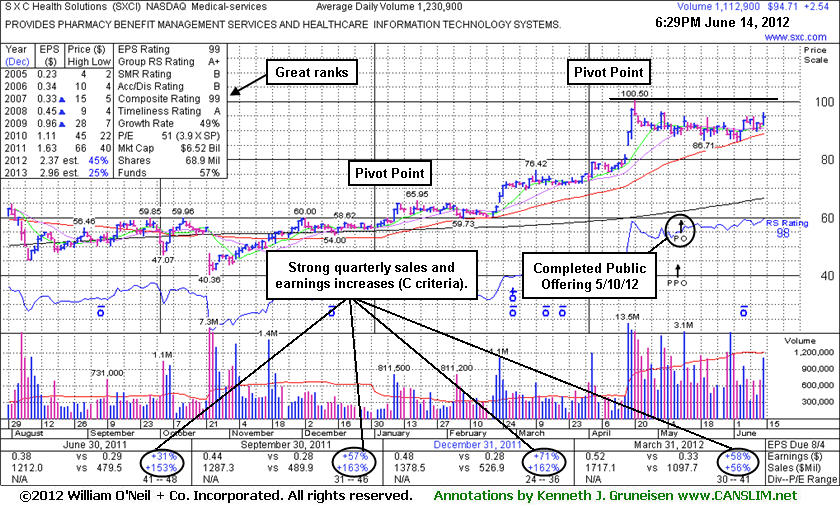
SXC Health Solutions Corp. (SXCI +$3.59 or +3.89% to $95.76) has been consolidating in a tight trading range in recent weeks while finding support above its 50-day moving average (DMA) line. It completed a new Public Offering on 5/10/12. A new pivot point is cited based on its 4/20/12 high plus 10 cents while building on a 9-week base. Volume driven gains above the pivot point may trigger a new (or add-on) technical buy signal. However, the M criteria still argues against new buying efforts without a confirmed rally with a solid FTD from at least one of the major averages. It reported earnings +58% on +56% sales revenues for the quarter ended March 31, 2012 versus the year ago period, continuing its streak of strong quarterly and good annual earnings increases which satisfy the C and A criteria. Ownership by top-rated funds rose from 453 in Jun '10 to 608 in Dec '11. Concerning the I criteria, that is a very favorable sign.
Its last appearance in this FSU section was on 5/17/12 with an annotated daily graph under the headline, "Consolidation May Be New Base; Poor Market an Overriding Concern". Much earlier, on 2/23/12 its color code had been changed to yellow as a pivot point was cited based on its 1/19/12 high plus 10 cents. The gap up for a considerable volume-driven gain on that session triggered a new (or add-on) technical buy signal. It was first featured at $62.05 on 1/10/12 when highlighted in yellow in the mid-day report with an annotated daily graph (read here).
|
|
|
Color Codes Explained :
Y - Better candidates highlighted by our
staff of experts.
G - Previously featured
in past reports as yellow but may no longer be buyable under the
guidelines.
***Last / Change / Volume data in this table is the closing quote data***
Symbol/Exchange
Company Name
Industry Group |
PRICE |
CHANGE
(%Change) |
Day High |
Volume
(% DAV)
(% 50 day avg vol) |
52 Wk Hi
% From Hi |
Featured
Date |
Price
Featured |
Pivot Featured |
|
Max Buy |
ALXN
-
NASDAQ
Alexion Pharmaceuticals
DRUGS - Drug Manufacturers - Other
|
$92.96
|
+1.30
1.42% |
$93.71
|
1,393,708
69.59% of 50 DAV
50 DAV is 2,002,700
|
$95.01
-2.16%
|
5/1/2012
|
$91.73
|
PP = $95.11
|
|
MB = $99.87
|
Most Recent Note - 6/12/2012 2:02:35 PM
Y - Faces near-term resistance in the $94-95 area, but little overhead supply remains to hinder its progress while perched within close striking distance of its 52-week high today.
>>> The latest Featured Stock Update with an annotated graph appeared on 5/31/2012. Click here.
View all notes |
Alert me of new notes |
CANSLIM.net Company Profile |
SEC |
Zacks Reports |
StockTalk |
News |
Chart |
Request a new note
C
A N
S L
I M


|
ASPS
-
NASDAQ
Altisource Ptf Sltns Sa
REAL ESTATE - Property Management/Developmen
|
$65.35
|
-0.67
-1.01% |
$66.52
|
169,769
127.36% of 50 DAV
50 DAV is 133,300
|
$67.03
-2.51%
|
6/5/2012
|
$60.01
|
PP = $63.00
|
|
MB = $66.15
|
Most Recent Note - 6/12/2012 2:05:08 PM
Y - Touched a new 52-week high today and no resistance remains due to overhead supply. Technically it triggered a buy signal last week and it is approaching its "max buy" level, however the major averages (M criteria) also need to confirm a new rally with a solid follow-through day before any new buying efforts are justified under the fact-based investment system.
>>> The latest Featured Stock Update with an annotated graph appeared on 6/5/2012. Click here.
View all notes |
Alert me of new notes |
CANSLIM.net Company Profile |
SEC |
Zacks Reports |
StockTalk |
News |
Chart |
Request a new note
C
A N
S L
I M
|
CERN
-
NASDAQ
Cerner Corp
COMPUTER SOFTWARE and SERVICES - Healthcare Information Service
|
$81.53
|
+1.61
2.01% |
$81.64
|
1,093,961
86.13% of 50 DAV
50 DAV is 1,270,200
|
$84.10
-3.06%
|
6/7/2012
|
$78.36
|
PP = $84.20
|
|
MB = $88.41
|
Most Recent Note - 6/12/2012 2:06:44 PM
Y - The M criteria requires a FTD before any new buying efforts may be considered under the investment system's guidelines. Volume-driven gains above its pivot point are still needed to trigger a new (or add-on) technical buy signal.
>>> The latest Featured Stock Update with an annotated graph appeared on 6/7/2012. Click here.
View all notes |
Alert me of new notes |
CANSLIM.net Company Profile |
SEC |
Zacks Reports |
StockTalk |
News |
Chart |
Request a new note
C
A N
S L
I M
|
CMCSA
-
NASDAQ
Comcast Corp Cl A
MEDIA - CATV Systems
|
$30.71
|
+0.73
2.43% |
$30.78
|
15,429,090
114.43% of 50 DAV
50 DAV is 13,484,000
|
$30.88
-0.53%
|
6/11/2012
|
$29.94
|
PP = $30.98
|
|
MB = $32.53
|
Most Recent Note - 6/12/2012 12:05:34 PM
Y - Perched within close striking distance of its 52-week high today. New pivot point was cited based on its 5/01/12 high plus 10 cents. The prior low ($28.09 on 5/21/12) defines important near-term support to watch. See the latest FSU analysis for more details and a new annotated graph.
>>> The latest Featured Stock Update with an annotated graph appeared on 6/11/2012. Click here.
View all notes |
Alert me of new notes |
CANSLIM.net Company Profile |
SEC |
Zacks Reports |
StockTalk |
News |
Chart |
Request a new note
C
A N
S L
I M
|
DG
-
NYSE
Dollar General Corp
RETAIL - Discount, Variety Stores
|
$50.55
|
+0.37
0.74% |
$50.85
|
4,621,468
146.27% of 50 DAV
50 DAV is 3,159,600
|
$50.75
-0.39%
|
5/7/2012
|
$48.51
|
PP = $47.69
|
|
MB = $50.07
|
Most Recent Note - 6/12/2012 4:29:41 PM
G - Finished at a best-ever close today. Completed another Secondary Offering on 6/05/12, its 4th Secondary Offering since September '11. See the latest FSU analysis for more details and a new annotated graph.
>>> The latest Featured Stock Update with an annotated graph appeared on 6/12/2012. Click here.
View all notes |
Alert me of new notes |
CANSLIM.net Company Profile |
SEC |
Zacks Reports |
StockTalk |
News |
Chart |
Request a new note
C
A N
S L
I M
|
Symbol/Exchange
Company Name
Industry Group |
PRICE |
CHANGE
(%Change) |
Day High |
Volume
(% DAV)
(% 50 day avg vol) |
52 Wk Hi
% From Hi |
Featured
Date |
Price
Featured |
Pivot Featured |
|
Max Buy |
EXPE
-
NASDAQ
Expedia Inc
INTERNET - Internet Information Providers
|
$47.53
|
+0.10
0.21% |
$47.75
|
3,302,134
73.63% of 50 DAV
50 DAV is 4,484,500
|
$49.12
-3.24%
|
4/27/2012
|
$41.80
|
PP = $35.57
|
|
MB = $37.35
|
Most Recent Note - 6/13/2012 12:00:50 PM
G - Pulling back today after recently wedging to new 52-week highs with gains backed by below average volume. It is extended from its prior highs in the $43 area which define initial support above its 50 DMA line.
>>> The latest Featured Stock Update with an annotated graph appeared on 6/8/2012. Click here.
View all notes |
Alert me of new notes |
CANSLIM.net Company Profile |
SEC |
Zacks Reports |
StockTalk |
News |
Chart |
Request a new note
C
A N
S L
I M
|
GNC
-
NYSE
G N C Holdings Inc
RETAIL - Drug Stores
|
$36.50
|
-0.16
-0.44% |
$37.48
|
1,746,180
92.06% of 50 DAV
50 DAV is 1,896,800
|
$41.95
-12.99%
|
1/19/2012
|
$28.99
|
PP = $29.60
|
|
MB = $31.08
|
Most Recent Note - 6/13/2012 6:18:42 PM
G - Slumped below its 50 DMA line with a loss today on lighter volume. Recent lows define important near-term support while it could be forming a "double bottom" base.
>>> The latest Featured Stock Update with an annotated graph appeared on 6/6/2012. Click here.
View all notes |
Alert me of new notes |
CANSLIM.net Company Profile |
SEC |
Zacks Reports |
StockTalk |
News |
Chart |
Request a new note
C
A N
S L
I M
|
NTES
-
NASDAQ
Netease Inc Adr
INTERNET - Internet Information Providers
|
$59.51
|
+0.25
0.42% |
$60.29
|
688,606
97.29% of 50 DAV
50 DAV is 707,800
|
$65.54
-9.20%
|
3/19/2012
|
$56.18
|
PP = $55.10
|
|
MB = $57.86
|
Most Recent Note - 6/12/2012 2:09:17 PM
G - Pulling back from its 52-week high with a 3rd consecutive loss today on lighter than average volume. Its 50 DMA line defines near-term support and prior lows near the $55 area define the next important chart support to watch where violations may trigger a worrisome technical sell signals.
>>> The latest Featured Stock Update with an annotated graph appeared on 5/24/2012. Click here.
View all notes |
Alert me of new notes |
CANSLIM.net Company Profile |
SEC |
Zacks Reports |
StockTalk |
News |
Chart |
Request a new note
C
A N
S L
I M
|
SWI
-
NYSE
Solarwinds Inc
COMPUTER SOFTWARE and SERVICES - Application Software
|
$44.03
|
+1.01
2.35% |
$44.17
|
617,639
59.53% of 50 DAV
50 DAV is 1,037,600
|
$48.64
-9.48%
|
4/26/2012
|
$45.15
|
PP = $42.32
|
|
MB = $44.44
|
 Most Recent Note - 6/14/2012 6:52:41 PM
G - Consolidating just above its 50 DMA line today with a gain on below average volume. A damaging violation of that short-term average and the 6/04/11 low ($41.24) would trigger a more worrisome technical sell signals.
>>> The latest Featured Stock Update with an annotated graph appeared on 5/21/2012. Click here.
View all notes |
Alert me of new notes |
CANSLIM.net Company Profile |
SEC |
Zacks Reports |
StockTalk |
News |
Chart |
Request a new note
C
A N
S L
I M
|
SXCI
-
NASDAQ
S X C Health Solutions
COMPUTER SOFTWARE and SERVICES - Healthcare Information Service
|
$94.71
|
+2.54
2.76% |
$96.20
|
1,113,027
90.42% of 50 DAV
50 DAV is 1,230,900
|
$100.50
-5.76%
|
6/14/2012
|
$94.71
|
PP = $100.60
|
|
MB = $105.63
|
Most Recent Note - 6/14/2012 6:50:38 PM
Y - Color code is changed to yellow with new pivot point cited based on its 4/20/12 high plus 10 cents. Subsequent volume-driven gains may trigger a buy signal, however the M criteria must also improve before any new buying efforts are justified under the fact-based system. Its 50 DMA line defines important support for chart readers. See the latest FSU analysis for more details and a new annotated graph.
>>> The latest Featured Stock Update with an annotated graph appeared on 6/14/2012. Click here.
View all notes |
Alert me of new notes |
CANSLIM.net Company Profile |
SEC |
Zacks Reports |
StockTalk |
News |
Chart |
Request a new note
C
A N
S L
I M
|
Symbol/Exchange
Company Name
Industry Group |
PRICE |
CHANGE
(%Change) |
Day High |
Volume
(% DAV)
(% 50 day avg vol) |
52 Wk Hi
% From Hi |
Featured
Date |
Price
Featured |
Pivot Featured |
|
Max Buy |
TDG
-
NYSE
Transdigm Group Inc
AEROSPACE/DEFENSE - Aerospace/Defense Products and; Services
|
$124.49
|
-0.68
-0.54% |
$127.07
|
721,142
134.94% of 50 DAV
50 DAV is 534,400
|
$132.69
-6.18%
|
2/29/2012
|
$120.10
|
PP = $118.93
|
|
MB = $124.88
|
Most Recent Note - 6/13/2012 6:20:07 PM
G - Quietly consolidating above important support at its 50 DMA line while perched within close striking distance of its all-time high. Its prior low ($118.43 on 5/18/12) defines the next important near-term chart support level to watch.
>>> The latest Featured Stock Update with an annotated graph appeared on 5/23/2012. Click here.
View all notes |
Alert me of new notes |
CANSLIM.net Company Profile |
SEC |
Zacks Reports |
StockTalk |
News |
Chart |
Request a new note
C
A N
S L
I M
|
UA
-
NYSE
Under Armour Inc Cl A
CONSUMER NON-DURABLES - Textile - Apparel Clothing
|
$101.68
|
+0.75
0.74% |
$102.97
|
1,041,946
105.75% of 50 DAV
50 DAV is 985,300
|
$107.15
-5.10%
|
2/15/2012
|
$85.77
|
PP = $84.86
|
|
MB = $89.10
|
Most Recent Note - 6/13/2012 6:22:30 PM
G - Ended near the session low today with a large loss on lighter (but still above average) volume, pulling back from a best-ever close. Perched near its 52-week and all-time highs after a "negative reversal" on 6/11/12 with above average volume. It was previously noted - "No resistance remains due to overhead supply. Fundamental concerns remain after a slightly sub par earnings increase in the Dec '11 quarter."
>>> The latest Featured Stock Update with an annotated graph appeared on 5/29/2012. Click here.
View all notes |
Alert me of new notes |
CANSLIM.net Company Profile |
SEC |
Zacks Reports |
StockTalk |
News |
Chart |
Request a new note
C
A N
S L
I M
|
VSI
-
NYSE
Vitamin Shoppe Inc
SPECIALTY RETAIL - Specialty Retail, Other
|
$49.04
|
-0.19
-0.39% |
$49.55
|
356,452
78.44% of 50 DAV
50 DAV is 454,400
|
$55.29
-11.30%
|
4/25/2012
|
$47.77
|
PP = $48.46
|
|
MB = $50.88
|
Most Recent Note - 6/13/2012 6:23:21 PM
Y - Down today on below average volume, quietly consolidating above prior highs in the $48 area and above its 50 DMA line which coincide defining important chart support. Market conditions argue against new buying efforts until a FTD from at least one of the major averages confirms a new rally. Color code was changed to yellow while one may consider a secondary buy point from its successful test of the 10 week average up to +5% above the recent high. Disciplined investors always limit losses by selling if a stock falls more than -7% from their buy price.
>>> The latest Featured Stock Update with an annotated graph appeared on 6/4/2012. Click here.
View all notes |
Alert me of new notes |
CANSLIM.net Company Profile |
SEC |
Zacks Reports |
StockTalk |
News |
Chart |
Request a new note
C
A N
S L
I M
|
WFM
-
NASDAQ
Whole Foods Market Inc
RETAIL - Grocery Stores
|
$91.54
|
+1.64
1.82% |
$91.80
|
1,961,035
107.32% of 50 DAV
50 DAV is 1,827,200
|
$92.00
-0.50%
|
6/13/2012
|
$89.90
|
PP = $91.60
|
|
MB = $96.18
|
Most Recent Note - 6/13/2012 6:17:24 PM
Y - Churned above average volume today near its 52-week high with no resistance remaining due to overhead supply. Its 50 DMA line and prior lows define important near-term support. New pivot point is cited based on its 5/04/12 high plus 10 cents. See the latest FSU analysis for more details and a new annotated graph.
>>> The latest Featured Stock Update with an annotated graph appeared on 6/13/2012. Click here.
View all notes |
Alert me of new notes |
CANSLIM.net Company Profile |
SEC |
Zacks Reports |
StockTalk |
News |
Chart |
Request a new note
C
A N
S L
I M
|
|
|
|
THESE ARE NOT BUY RECOMMENDATIONS!
Comments contained in the body of this report are technical
opinions only. The material herein has been obtained
from sources believed to be reliable and accurate, however,
its accuracy and completeness cannot be guaranteed.
This site is not an investment advisor, hence it does
not endorse or recommend any securities or other investments.
Any recommendation contained in this report may not
be suitable for all investors and it is not to be deemed
an offer or solicitation on our part with respect to
the purchase or sale of any securities. All trademarks,
service marks and trade names appearing in this report
are the property of their respective owners, and are
likewise used for identification purposes only.
This report is a service available
only to active Paid Premium Members.
You may opt-out of receiving report notifications
at any time. Questions or comments may be submitted
by writing to Premium Membership Services 665 S.E. 10 Street, Suite 201 Deerfield Beach, FL 33441-5634 or by calling 1-800-965-8307
or 954-785-1121.
|
|
|

