You are not logged in.
This means you
CAN ONLY VIEW reports that were published prior to Thursday, March 20, 2025.
You
MUST UPGRADE YOUR MEMBERSHIP if you want to see any current reports.
AFTER MARKET UPDATE - MONDAY, JUNE 14TH, 2010
Previous After Market Report Next After Market Report >>>
|
|
|
|
DOW |
-20.18 |
10,190.89 |
-0.20% |
|
Volume |
1,142,258,940 |
+10% |
|
Volume |
1,849,412,950 |
+4% |
|
NASDAQ |
+0.36 |
2,243.96 |
+0.02% |
|
Advancers |
1,872 |
59% |
|
Advancers |
1,501 |
54% |
|
S&P 500 |
-1.97 |
1,089.63 |
-0.18% |
|
Decliners |
1,200 |
38% |
|
Decliners |
1,177 |
42% |
|
Russell 2000 |
+3.27 |
652.27 |
+0.50% |
|
52 Wk Highs |
64 |
|
|
52 Wk Highs |
53 |
|
|
S&P 600 |
+1.62 |
348.49 |
+0.47% |
|
52 Wk Lows |
7 |
|
|
52 Wk Lows |
32 |
|
|
 |
Major Averages End Mixed On Higher Volume
Adam Sarhan, Contributing Writer,
The major averages ended mixed but near their intra-day lows after Greece's Debt was downgraded by Moody's. Volume totals were reported higher compared to Friday's levels on the Nasdaq and on the NYSE. Advancers led decliners by about a 3-to-2 ratio on the NYSE and a 5-to-4 ratio on the Nasdaq exchange. There were 31 high-ranked companies from the CANSLIM.net Leaders List that made a new 52-week high and appeared on the CANSLIM.net BreakOuts Page, higher than the 19 issues that appeared on the prior session. New 52-week highs outnumbered new 52-week lows on the NYSE and on the Nasdaq exchange.
The MSCI World Index rose for a fifth consecutive day which was its the longest winning streak since October 2009 as the US dollar continued its 5-day slide against the euro. This should not surprise our readers because we have written for months about the inverse relationship between the dollar and dollar denominated assets (mainly stocks and commodities). That said, the euro edged higher after European industrial production rose which suggests the global economy continues to rebound. The euro and US equities briefly pulled back after Moody's cut Greece's credit rating.
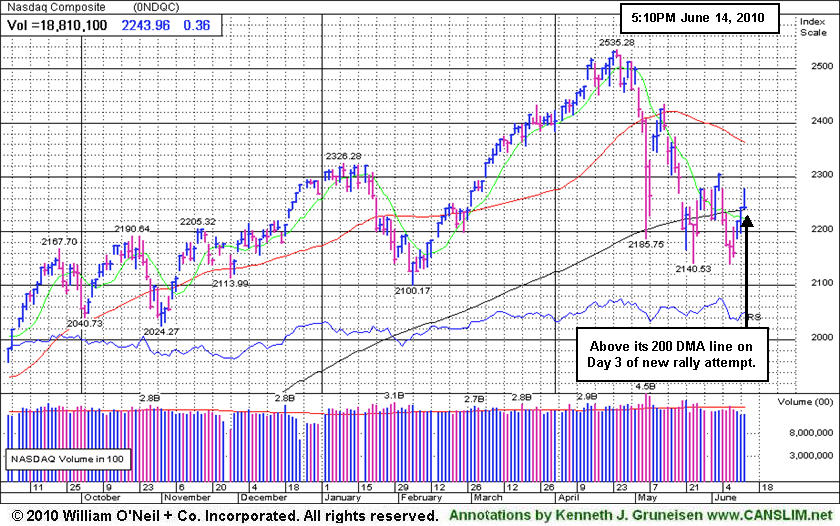
The benchmark S&P 500 Index marked Day 14 of its current rally attempt and is currently encountering resistance just below its long-term moving average line. The Dow Jones Industrial Average marked Day 5 of its latest rally attempt while the Nasdaq Composite Index marked Day 3. At this point, the window is now open for the major averages to produce a sound follow-through day (FTD) unless the recent lows, respectively, are breached. Furthermore, it is well known that a market should not be considered "healthy" unless it trades above its rising 200-day moving average (DMA) line. The fact that all the major averages are below both their 50 & 200 DMA lines bodes poorly for the near term. That said, the bears will likely remain in control until the popular averages close above their important moving averages. Trade accordingly.
Are You Frustrated With The Market?
Inquire Today About Our Professional Money Management Services:
If your portfolio is greater than $100,000 and you would like a free portfolio review, click here to get connected with one of our portfolio managers. ** Serious inquires only, please.
PICTURED: The Nasdaq Composite Index marked Day 3 of a new rally attempt.
|
|
|
 |
Financial and Commodity-Linked Groups Backpedal
Kenneth J. Gruneisen - Passed the CAN SLIM® Master's Exam
Financial shares finished lower on Monday as the Broker/Dealer Index ($XBD -1.08%) and Bank Index ($BKX -0.78%) created a drag on the major averages. Commodity-linked areas also backpedaled as the Gold & Silver Index ($XAU -1.52%), Oil Services Index ($OSX -1.41%), and Integrated Oil Index ($XOI -0.42%). A gain from the and mostly positive action in the tech sector offset other groups' weakness as the Semiconductor Index ($SOX +0.70%) outpaced the Networking Index ($NWX +0.16%) and Biotechnology Index ($BTK +0.29%), but the Internet Index ($IIX -0.22%) ended with a small loss. The Healthcare Index ($HMO +0.26%) edged higher.
Charts courtesy www.stockcharts.com
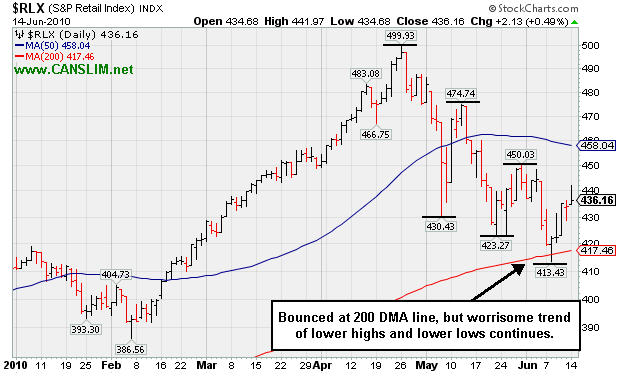
PICTURED: The Retail Index ($RLX +0.49%) bounced at its 200-day moving average (DMA) line, but a worrisome trend of lower highs and lower lows continues.
| Oil Services |
$OSX |
171.59 |
-2.46 |
-1.41% |
-11.97% |
| Healthcare |
$HMO |
1,509.72 |
+3.86 |
+0.26% |
+2.50% |
| Integrated Oil |
$XOI |
940.60 |
-3.99 |
-0.42% |
-11.95% |
| Semiconductor |
$SOX |
351.97 |
+2.44 |
+0.70% |
-2.21% |
| Networking |
$NWX |
231.87 |
+0.35 |
+0.15% |
+0.35% |
| Internet |
$IIX |
237.79 |
-0.50 |
-0.21% |
+1.68% |
| Broker/Dealer |
$XBD |
105.41 |
-1.19 |
-1.12% |
-8.38% |
| Retail |
$RLX |
436.16 |
+2.13 |
+0.49% |
+6.09% |
| Gold & Silver |
$XAU |
172.65 |
-2.66 |
-1.52% |
+2.62% |
| Bank |
$BKX |
48.55 |
-0.38 |
-0.78% |
+13.67% |
| Biotech |
$BTK |
1,070.51 |
+2.88 |
+0.27% |
+13.63% |
|
|
|
 |
Mild Distributional Pressure Being Encountered Near Highs
Kenneth J. Gruneisen - Passed the CAN SLIM® Master's Exam
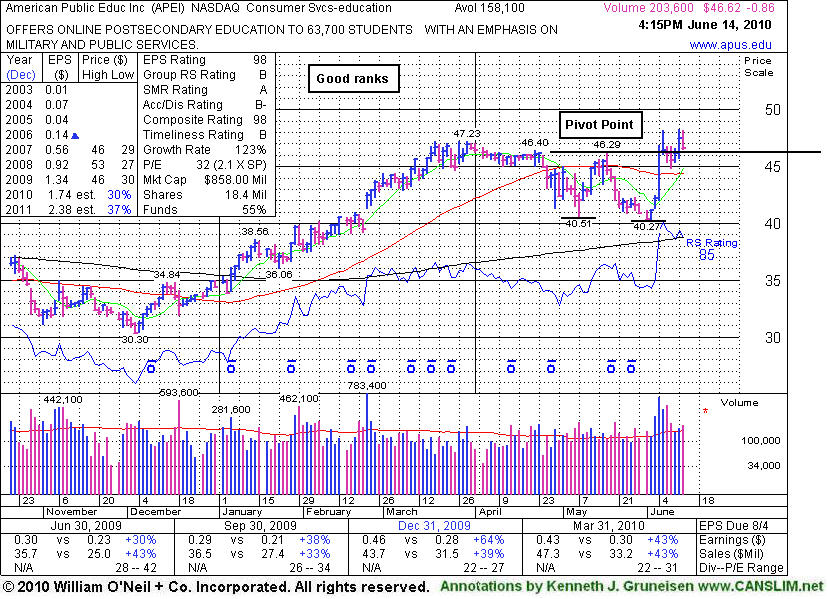
Often, when a leading stock is setting up to breakout of a solid base, it is highlighted in CANSLIM.net's Mid-Day Breakouts Report. The most relevant factors are noted in the report which allows prudent CANSLIM oriented investors to place the issue in their watch list. After doing any necessary backup research, the investor is prepared to act if and when the stock triggers a technical buy signal (breaks above its pivot point on more than +50% average turnover). In the event the stock fails to trigger a technical buy signal and its price declines then it will simply be removed from the watch list.
American Public Education Inc. (APEI -$0.86 or -1.81% to $46.62) gapped up today and then reversed into the red for the session, encountering mild distributional pressure as it fell on slightly higher volume. Its 6/07/10 gain and close above its pivot point with above average volume triggered a technical buy signal, although it finished in the lower half of its intra-day range. It was featured in yellow in the 6/07/10 mid-day report with an annotated graph (read here). Other for-profit educators recently stalled as proposed regulatory changes have been feared to have a negative impact. However, little resistance remains due to overhead supply, so the bias is generally positive while it hovers near its 52-week high.
|
|
|
Color Codes Explained :
Y - Better candidates highlighted by our
staff of experts.
G - Previously featured
in past reports as yellow but may no longer be buyable under the
guidelines.
***Last / Change / Volume data in this table is the closing quote data***
Symbol/Exchange
Company Name
Industry Group |
PRICE |
CHANGE
(%Change) |
Day High |
Volume
(% DAV)
(% 50 day avg vol) |
52 Wk Hi
% From Hi |
Featured
Date |
Price
Featured |
Pivot Featured |
|
Max Buy |
APEI
-
NASDAQ
American Public Educ Inc
DIVERSIFIED SERVICES - Education and Training Services
|
$46.62
|
-0.86
-1.81% |
$48.15
|
203,603
128.78% of 50 DAV
50 DAV is 158,100
|
$48.26
-3.40%
|
6/7/2010
|
$46.60
|
PP = $46.29
|
|
MB = $48.60
|
 Most Recent Note - 6/14/2010 4:18:24 PM
Y - Gapped up today and then reversed into the red. Its 6/07/10 gain and close above its pivot point with above average volume triggered a technical buy signal. Featured in yellow in the 6/07/10 mid-day report with an annotated graph (read here).
>>> The latest Featured Stock Update with an annotated graph appeared on 6/14/2010. Click here.
View all notes |
Alert me of new notes |
CANSLIM.net Company Profile |
SEC |
Zacks Reports |
StockTalk |
News |
Chart |
Request a new note
C
A N
S L
I M


|
BIDU
-
NASDAQ
Baidu Inc Ads
INTERNET - Internet Information Providers
|
$72.93
|
+0.08
0.11% |
$74.95
|
8,251,846
54.40% of 50 DAV
50 DAV is 15,167,900
|
$82.29
-11.37%
|
1/13/2010
|
$43.13
|
PP = $42.68
|
|
MB = $44.81
|
Most Recent Note - 6/14/2010 4:19:11 PM
G - Holding its ground since a gap up on 6/10/10, rallying from support at its 50 DMA line. A worrisome negative reversal from its all-time high on 5/13/10 followed a 10:1 stock split.
>>> The latest Featured Stock Update with an annotated graph appeared on 6/1/2010. Click here.
View all notes |
Alert me of new notes |
CANSLIM.net Company Profile |
SEC |
Zacks Reports |
StockTalk |
News |
Chart |
Request a new note
C
A N
S L
I M
|
BRLI
-
NASDAQ
Bio Reference Labs Inc
HEALTH SERVICES - Medical Laboratories and Researc
|
$23.32
|
+0.13
0.56% |
$23.60
|
94,570
50.06% of 50 DAV
50 DAV is 188,900
|
$24.67
-5.49%
|
2/12/2010
|
$39.02
|
PP = $20.49
|
|
MB = $21.51
|
Most Recent Note - 6/14/2010 4:21:55 PM
G - Today marked its 3rd consecutive gain on light volume, consolidating above its 50 DMA line. Basing for about 7 weeks since a 2:1 stock split effective on 4/22/10.
>>> The latest Featured Stock Update with an annotated graph appeared on 5/26/2010. Click here.
View all notes |
Alert me of new notes |
CANSLIM.net Company Profile |
SEC |
Zacks Reports |
StockTalk |
News |
Chart |
Request a new note
C
A N
S L
I M
|
CRM
-
NYSE
Salesforce.Com Inc
INTERNET - Internet Software and Services
|
$93.50
|
-3.14
-3.25% |
$97.09
|
3,751,465
149.13% of 50 DAV
50 DAV is 2,515,600
|
$96.87
-3.48%
|
6/2/2010
|
$88.44
|
PP = $89.60
|
|
MB = $94.08
|
Most Recent Note - 6/14/2010 4:23:41 PM
G - Finished near the session low after touching a new all-time high today above its "max buy" level. Color code was changed to green. Prior highs in the $89 area are an important support level to watch above its 50 DMA line.
>>> The latest Featured Stock Update with an annotated graph appeared on 6/2/2010. Click here.
View all notes |
Alert me of new notes |
CANSLIM.net Company Profile |
SEC |
Zacks Reports |
StockTalk |
News |
Chart |
Request a new note
C
A N
S L
I M
|
DECK
-
NASDAQ
Deckers Outdoor Corp
CONSUMER NON-DURABLES - Textile - Apparel Footwear
|
$160.58
|
+1.37
0.86% |
$164.19
|
585,664
117.25% of 50 DAV
50 DAV is 499,500
|
$160.00
0.36%
|
6/11/2010
|
$157.34
|
PP = $158.57
|
|
MB = $166.50
|
Most Recent Note - 6/14/2010 4:24:25 PM
Y - Hit another new 52-week high today, yet closed near the session low. A gain with 2 times average volume helped it clear a choppy 7-week consolidation on 6/11/10 and trigger a technical buy signal. Featured in the 6/11/10 mid-day report (read here) while noted - "Possibly on course to challenge its 2007 all-time high ($166). Quarterly sales revenues increases have been in the +16% range while earnings increases were above the +25% minimum guideline in the 3 latest comparisons. The previously noted 2/26/10 'breakaway gap' was followed by meaningful gains. This apparel firm has a great annual earnings history (A criteria)."
>>> The latest Featured Stock Update with an annotated graph appeared on 6/11/2010. Click here.
View all notes |
Alert me of new notes |
CANSLIM.net Company Profile |
SEC |
Zacks Reports |
StockTalk |
News |
Chart |
Request a new note
C
A N
S L
I M
|
Symbol/Exchange
Company Name
Industry Group |
PRICE |
CHANGE
(%Change) |
Day High |
Volume
(% DAV)
(% 50 day avg vol) |
52 Wk Hi
% From Hi |
Featured
Date |
Price
Featured |
Pivot Featured |
|
Max Buy |
LOPE
-
NASDAQ
Grand Canyon Education
DIVERSIFIED SERVICES - Education and; Training Services
|
$23.42
|
-0.21
-0.89% |
$23.96
|
238,845
55.60% of 50 DAV
50 DAV is 429,600
|
$28.46
-17.71%
|
4/13/2010
|
$27.71
|
PP = $27.33
|
|
MB = $28.70
|
Most Recent Note - 6/14/2010 4:39:06 PM
G - Based on weak action it will be dropped from the Featured Stocks list tonight. Quietly consolidating, it would need to rally back above its 50 DMA line for its outlook to improve.
>>> The latest Featured Stock Update with an annotated graph appeared on 5/27/2010. Click here.
View all notes |
Alert me of new notes |
CANSLIM.net Company Profile |
SEC |
Zacks Reports |
StockTalk |
News |
Chart |
Request a new note
C
A N
S L
I M
|
MELI
-
NASDAQ
Mercadolibre Inc
INTERNET - Internet Software and; Services
|
$57.84
|
+0.04
0.07% |
$59.49
|
1,018,826
139.93% of 50 DAV
50 DAV is 728,100
|
$58.81
-1.65%
|
5/13/2010
|
$54.21
|
PP = $55.85
|
|
MB = $58.64
|
Most Recent Note - 6/14/2010 4:30:39 PM
G - Gain today for another new 52-week high, trading above its "max buy" level. Color code was changed to green. Prior chart highs in the $55 area may now act as an initial support level on pullbacks.
>>> The latest Featured Stock Update with an annotated graph appeared on 6/10/2010. Click here.
View all notes |
Alert me of new notes |
CANSLIM.net Company Profile |
SEC |
Zacks Reports |
StockTalk |
News |
Chart |
Request a new note
C
A N
S L
I M
|
ROVI
-
NASDAQ
Rovi Corp
COMPUTER SOFTWARE andamp; SERVICES - Security Software andamp; Services
|
$37.21
|
-0.78
-2.05% |
$38.08
|
875,016
65.81% of 50 DAV
50 DAV is 1,329,600
|
$40.06
-7.11%
|
6/3/2010
|
$38.70
|
PP = $40.16
|
|
MB = $42.17
|
Most Recent Note - 6/14/2010 4:32:10 PM
G - Loss today on below average volume as it slipped back under its 50 DMA line. Recently found support near prior lows in the $35 area, and stayed above its October 2009 chart high.
>>> The latest Featured Stock Update with an annotated graph appeared on 6/9/2010. Click here.
View all notes |
Alert me of new notes |
CANSLIM.net Company Profile |
SEC |
Zacks Reports |
StockTalk |
News |
Chart |
Request a new note
C
A N
S L
I M
|
SUMR
-
NASDAQ
Summer Infant Inc
CONSUMER NON-DURABLES - Personal Products
|
$6.81
|
+0.12
1.79% |
$6.84
|
68,240
86.82% of 50 DAV
50 DAV is 78,600
|
$8.42
-19.12%
|
5/4/2010
|
$6.85
|
PP = $7.09
|
|
MB = $7.44
|
Most Recent Note - 6/14/2010 4:34:41 PM
G - Holding its ground after recent distributional pressure to near prior chart lows in the $6.25 area followed 6/08/10 violations of prior chart highs and its 50 DMA line which triggered technical sell signals. Only a prompt rebound back above its short-term average would help its outlook.
>>> The latest Featured Stock Update with an annotated graph appeared on 6/8/2010. Click here.
View all notes |
Alert me of new notes |
CANSLIM.net Company Profile |
SEC |
Zacks Reports |
StockTalk |
News |
Chart |
Request a new note
C
A N
S L
I M
|
THOR
-
NASDAQ
Thoratec Corp
HEALTH SERVICES - Medical Instruments and Supplies
|
$44.04
|
-0.75
-1.67% |
$45.62
|
767,424
83.91% of 50 DAV
50 DAV is 914,600
|
$46.50
-5.29%
|
6/3/2010
|
$44.38
|
PP = $45.35
|
|
MB = $47.62
|
Most Recent Note - 6/14/2010 4:36:57 PM
Y - Gapped up today, then reversed into the red, finishing -5.3% off its 52 week high. Virtually no resistance remains due to overhead supply.
>>> The latest Featured Stock Update with an annotated graph appeared on 6/3/2010. Click here.
View all notes |
Alert me of new notes |
CANSLIM.net Company Profile |
SEC |
Zacks Reports |
StockTalk |
News |
Chart |
Request a new note
C
A N
S L
I M
|
Symbol/Exchange
Company Name
Industry Group |
PRICE |
CHANGE
(%Change) |
Day High |
Volume
(% DAV)
(% 50 day avg vol) |
52 Wk Hi
% From Hi |
Featured
Date |
Price
Featured |
Pivot Featured |
|
Max Buy |
ULTA
-
NASDAQ
Ulta Salon Cosm & Frag
SPECIALTY RETAIL - Specialty Retail, Other
|
$24.53
|
-0.15
-0.61% |
$24.89
|
1,084,319
195.65% of 50 DAV
50 DAV is 554,200
|
$26.00
-5.65%
|
5/28/2010
|
$25.58
|
PP = $25.86
|
|
MB = $27.15
|
Most Recent Note - 6/14/2010 4:38:26 PM
Y - Held its ground above its 50 DMA line today after a considerable gain on 6/11/10 with 11 times average volume. Its color code was changed to yellow. Announced year-over-year sales growth of +19.1% to $320.2 million from $268.8 million. Earnings per share came in at 23 cents, or nearly 3 times the year-ago performance of 8 cents, beating the Zacks Consensus Estimate by nearly 28%.
>>> The latest Featured Stock Update with an annotated graph appeared on 6/7/2010. Click here.
View all notes |
Alert me of new notes |
CANSLIM.net Company Profile |
SEC |
Zacks Reports |
StockTalk |
News |
Chart |
Request a new note
C
A N
S L
I M
|
|
|
|
THESE ARE NOT BUY RECOMMENDATIONS!
Comments contained in the body of this report are technical
opinions only. The material herein has been obtained
from sources believed to be reliable and accurate, however,
its accuracy and completeness cannot be guaranteed.
This site is not an investment advisor, hence it does
not endorse or recommend any securities or other investments.
Any recommendation contained in this report may not
be suitable for all investors and it is not to be deemed
an offer or solicitation on our part with respect to
the purchase or sale of any securities. All trademarks,
service marks and trade names appearing in this report
are the property of their respective owners, and are
likewise used for identification purposes only.
This report is a service available
only to active Paid Premium Members.
You may opt-out of receiving report notifications
at any time. Questions or comments may be submitted
by writing to Premium Membership Services 665 S.E. 10 Street, Suite 201 Deerfield Beach, FL 33441-5634 or by calling 1-800-965-8307
or 954-785-1121.
|
|
|


