You are not logged in.
This means you
CAN ONLY VIEW reports that were published prior to Monday, April 14, 2025.
You
MUST UPGRADE YOUR MEMBERSHIP if you want to see any current reports.
AFTER MARKET UPDATE - WEDNESDAY, JUNE 13TH, 2012
Previous After Market Report Next After Market Report >>>
|
|
|
|
DOW |
-77.42 |
12,496.38 |
-0.62% |
|
Volume |
707,122,700 |
-2% |
|
Volume |
1,561,667,930 |
+1% |
|
NASDAQ |
-24.46 |
2,818.61 |
-0.86% |
|
Advancers |
954 |
30% |
|
Advancers |
747 |
29% |
|
S&P 500 |
-9.30 |
1,314.88 |
-0.70% |
|
Decliners |
2,114 |
67% |
|
Decliners |
1,727 |
67% |
|
Russell 2000 |
-9.15 |
752.38 |
-1.20% |
|
52 Wk Highs |
44 |
|
|
52 Wk Highs |
31 |
|
|
S&P 600 |
-5.82 |
420.07 |
-1.37% |
|
52 Wk Lows |
51 |
|
|
52 Wk Lows |
61 |
|
|
 |
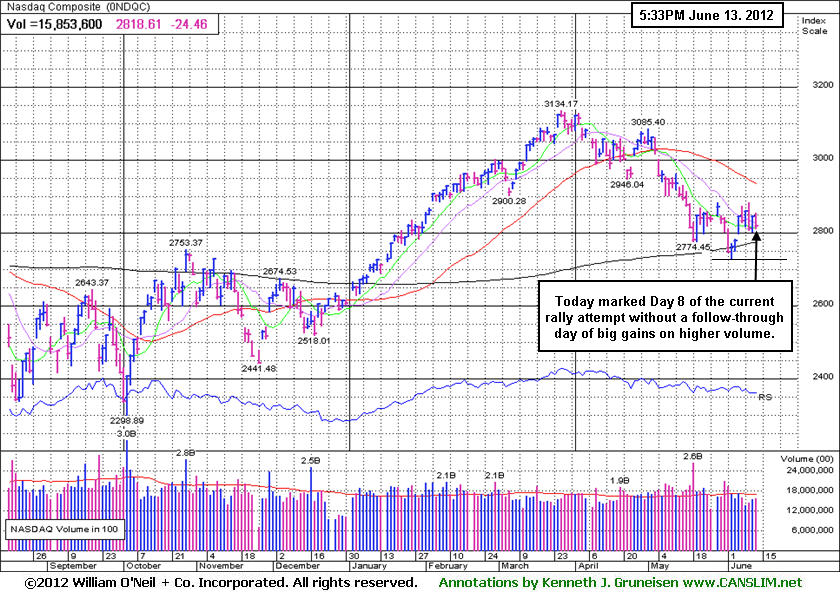
Indices Have Yet to Produce Confirming Follow-Through Gains
Kenneth J. Gruneisen - Passed the CAN SLIM® Master's Exam
The major averages fell again on Wednesday's session. Volume totals were again reported mixed, slightly higher on the Nasdaq exchange and lower on the NYSE versus the prior session. Breadth was negative as decliners led advancers by more than a 2-1 ratio on the NYSE and on the Nasdaq exchange. The total number of new 52-week lows exceeded new 52-week highs on both the Nasdaq exchange and on the NYSE. There were 19 high-ranked companies from the CANSLIM.net Leaders List made new 52-week highs and appeared on the CANSLIM.net BreakOuts Page, up from the prior session total of 13 stocks. However, at the close there were unanimous losses for all of the 14 high-ranked companies currently included on the Featured Stocks Page.
Stocks extended their losses into the closing bell, struggling as U.S. economic data provided a mixed picture and European uncertainties continued to weigh on investors. All 10 sectors on the S&P ended in the red, led by sharp declines in the industrial and material sectors. Shares of U.S. Steel Corp (X -1.96%) and United Technologies Corp (UTX -1.09%) fell. Energy stocks were also under pressure as crude oil slid 95 cents to $82.37 per barrel. Exxon Mobil Corp (XOM -0.78%) and Transocean Ltd (RIG -1.87%) lost ground.
In other news, JP Morgan Chase & Co (JPM +1.57%) gained following CEO Jamie Dimon's testimony to the Senate Banking Committee. Meanwhile, Morgan Stanley (MS -2.01%) and other influential financial shares faced pressure or finished the session with negligible gains. On the M&A front, Johnson & Johnson (JNJ +2.17%) rose after the company announced that it had received regulatory clearance to move forward with its $19 billion acquisition of Synthes.
In bondland, Treasuries were higher along the curve. The 10-year note was up 17 ticks to yield 1.60% and the 30-year bond gained over a point to yield 2.71%.
Technically, the major averages (M criteria) are still considered to be in a rally attempt within an ongoing correction, and stocks may still be vulnerable to greater downside. Historical studies suggest that the most constructive market rallies produced a solid follow-through day (FTD) between Days 4-7 of a new rally effort. Although we are beyond that most ideal window, subsequent gains of +1.4% or greater by at least one of the major indexes, backed by higher volume (preferably above average volume) and coupled with an expansion in the number of stocks hitting new highs, could still confirm the rally as long as the "Day 1" lows are not undercut. Only fresh technical proof may give fact-based investors the clearance to begin with new buying efforts strictly in sound buy candidates. Meanwhile, investors should keep up a watchlist of worthy buy candidates while remaining protective of capital.
PICTURED: The Nasdaq Composite Index is still awaiting confirming gains on higher volume after Day 8 of its rally attempt.
|
 Kenneth J. Gruneisen started out as a licensed stockbroker in August 1987, a couple of months prior to the historic stock market crash that took the Dow Jones Industrial Average down -22.6% in a single day. He has published daily fact-based fundamental and technical analysis on high-ranked stocks online for two decades. Through FACTBASEDINVESTING.COM, Kenneth provides educational articles, news, market commentary, and other information regarding proven investment systems that work in good times and bad.
Comments contained in the body of this report are technical opinions only and are not necessarily those of Gruneisen Growth Corp. The material herein has been obtained from sources believed to be reliable and accurate, however, its accuracy and completeness cannot be guaranteed. Our firm, employees, and customers may effect transactions, including transactions contrary to any recommendation herein, or have positions in the securities mentioned herein or options with respect thereto. Any recommendation contained in this report may not be suitable for all investors and it is not to be deemed an offer or solicitation on our part with respect to the purchase or sale of any securities. |
|
 |
Energy, Tech, and Retail Indexes Ended Lower
Kenneth J. Gruneisen - Passed the CAN SLIM® Master's Exam
The Oil Services Index ($OSX -2.03%) and Integrated Oil Index ($XOI -0.72%) slumped against a backdrop of falling crude prices. The Networking Index ($NWX -1.55%), Semiconductor Index ($SOX -1.06%), Internet Index ($IIX -1.00%), and Biotechnology Index ($BTK -0.42%) ended unanimously lower. The Healthcare Index ($HMO -1.29%) also lost ground. Weakness in the Retail Index ($RLX -1.52%) and the Broker/Dealer Index ($XBD -1.24%) were a negative influence on the major averages, meanwhile the Bank Index ($BKX -0.16%) edged lower and the Gold & Silver Index ($XAU +0.01%) finished flat.
Charts courtesy www.stockcharts.com
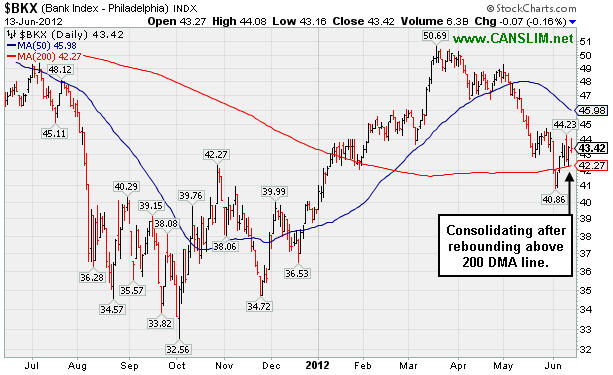
PICTURED: The Bank Index ($BKX -0.16%) is consolidating after rebounding above its 200-day moving average (DMA) line. A subsequent slump below that important long-term average and below recent lows would bode poorly for the broader market outlook. Financial shares have been a reliable "leading indicator" which regular readers have seen noted numerous times in past years.
| Oil Services |
$OSX |
197.32 |
-4.08 |
-2.03% |
-8.77% |
| Healthcare |
$HMO |
2,194.47 |
-28.70 |
-1.29% |
-3.82% |
| Integrated Oil |
$XOI |
1,118.08 |
-8.11 |
-0.72% |
-9.03% |
| Semiconductor |
$SOX |
369.79 |
-3.95 |
-1.06% |
+1.47% |
| Networking |
$NWX |
204.67 |
-3.22 |
-1.55% |
-4.88% |
| Internet |
$IIX |
293.87 |
-2.96 |
-1.00% |
+4.31% |
| Broker/Dealer |
$XBD |
84.17 |
-1.05 |
-1.24% |
+1.08% |
| Retail |
$RLX |
601.53 |
-9.28 |
-1.52% |
+14.97% |
| Gold & Silver |
$XAU |
162.57 |
+0.02 |
+0.01% |
-10.00% |
| Bank |
$BKX |
43.42 |
-0.07 |
-0.16% |
+10.26% |
| Biotech |
$BTK |
1,401.94 |
-5.87 |
-0.42% |
+28.45% |
|
|
|
 |
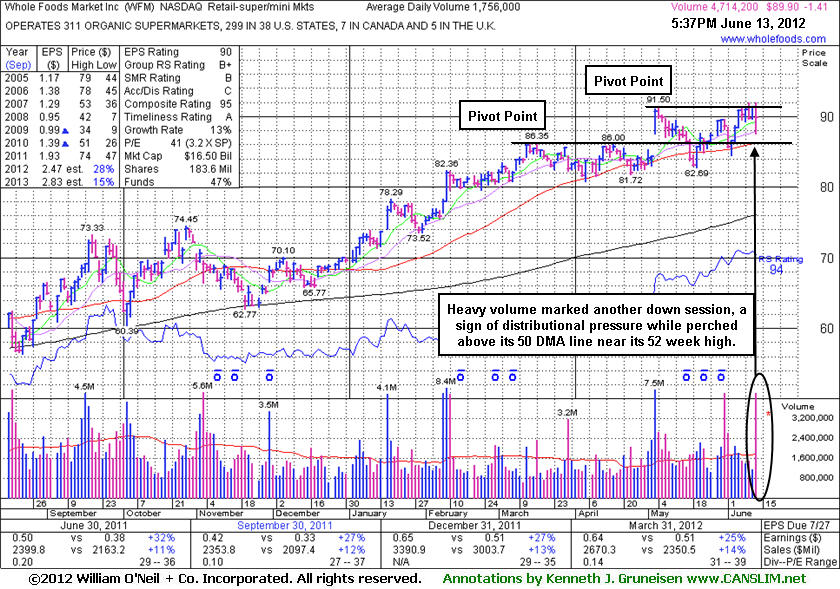
New Pivot Point Cited While Contending With Distributional Pressure
Kenneth J. Gruneisen - Passed the CAN SLIM® Master's Exam
Whole Foods Market Inc (WFM -$1.41 or -1.54% to $89.90) traded heavy volume as it lost ground today, a sign of more distributional pressure. It has been churning above average volume near its 52-week high, making little progress above prior chart highs even while no resistance remains due to overhead supply. A new pivot point is being cited based on its 5/04/12 high plus 10 cents, and subsequent volume-driven gains may trigger a new (or add-on) technical buy signal. Keep in mind that 3 out of 4 stocks follow the direction of the major averages (M criteria), so the outcome in the weeks ahead depends greatly on the major averages' ability to halt the current correction and produce a new confirmed rally with a solid follow-through day.
Its 50-day moving average (DMA) line and prior lows define important near-term support, and subsequent violations would raise concerns and trigger technical sell signals. The Retail - Super/Mini-Markets group has seen its Group Relative Strength Rating rise from 60 to 76 in the time since it was last shown in this FSU section with an annotated graph on 5/11/12 under the headline, "Consolidating Above Prior Highs After Breakaway Gap". Its considerable "breakaway gap" on 5/03/12 had cleared an orderly flat base pattern, but its subsequent slump below prior highs and its 50 DMA line completely negated the bullish breakout. Ongoing leadership from a couple of other high-ranked companies in the industry group provides some reassurance concerning the L criteria. Quarterly comparisons have shown strong earnings increases above the +25% guideline (C criteria). Its annual earnings (A criteria) history has been improving since a downturn in FY '08. The number of top-rated funds owning its shares rose from 1,046 in Jun '11 to 1,202 in Mar '12, a reassuring sign concerning the I criteria.
|
|
|
Color Codes Explained :
Y - Better candidates highlighted by our
staff of experts.
G - Previously featured
in past reports as yellow but may no longer be buyable under the
guidelines.
***Last / Change / Volume data in this table is the closing quote data***
Symbol/Exchange
Company Name
Industry Group |
PRICE |
CHANGE
(%Change) |
Day High |
Volume
(% DAV)
(% 50 day avg vol) |
52 Wk Hi
% From Hi |
Featured
Date |
Price
Featured |
Pivot Featured |
|
Max Buy |
ALXN
-
NASDAQ
Alexion Pharmaceuticals
DRUGS - Drug Manufacturers - Other
|
$91.66
|
-2.06
-2.20% |
$93.74
|
1,258,271
62.66% of 50 DAV
50 DAV is 2,008,100
|
$95.01
-3.53%
|
5/1/2012
|
$91.73
|
PP = $95.11
|
|
MB = $99.87
|
Most Recent Note - 6/12/2012 2:02:35 PM
Y - Faces near-term resistance in the $94-95 area, but little overhead supply remains to hinder its progress while perched within close striking distance of its 52-week high today.
>>> The latest Featured Stock Update with an annotated graph appeared on 5/31/2012. Click here.
View all notes |
Alert me of new notes |
CANSLIM.net Company Profile |
SEC |
Zacks Reports |
StockTalk |
News |
Chart |
Request a new note
C
A N
S L
I M


|
ASPS
-
NASDAQ
Altisource Ptf Sltns Sa
REAL ESTATE - Property Management/Developmen
|
$66.02
|
-0.11
-0.17% |
$66.43
|
108,583
81.40% of 50 DAV
50 DAV is 133,400
|
$67.03
-1.51%
|
6/5/2012
|
$60.01
|
PP = $63.00
|
|
MB = $66.15
|
Most Recent Note - 6/12/2012 2:05:08 PM
Y - Touched a new 52-week high today and no resistance remains due to overhead supply. Technically it triggered a buy signal last week and it is approaching its "max buy" level, however the major averages (M criteria) also need to confirm a new rally with a solid follow-through day before any new buying efforts are justified under the fact-based investment system.
>>> The latest Featured Stock Update with an annotated graph appeared on 6/5/2012. Click here.
View all notes |
Alert me of new notes |
CANSLIM.net Company Profile |
SEC |
Zacks Reports |
StockTalk |
News |
Chart |
Request a new note
C
A N
S L
I M
|
CERN
-
NASDAQ
Cerner Corp
COMPUTER SOFTWARE and SERVICES - Healthcare Information Service
|
$79.92
|
-0.43
-0.54% |
$81.00
|
1,191,854
94.32% of 50 DAV
50 DAV is 1,263,600
|
$84.10
-4.97%
|
6/7/2012
|
$78.36
|
PP = $84.20
|
|
MB = $88.41
|
Most Recent Note - 6/12/2012 2:06:44 PM
Y - The M criteria requires a FTD before any new buying efforts may be considered under the investment system's guidelines. Volume-driven gains above its pivot point are still needed to trigger a new (or add-on) technical buy signal.
>>> The latest Featured Stock Update with an annotated graph appeared on 6/7/2012. Click here.
View all notes |
Alert me of new notes |
CANSLIM.net Company Profile |
SEC |
Zacks Reports |
StockTalk |
News |
Chart |
Request a new note
C
A N
S L
I M
|
CMCSA
-
NASDAQ
Comcast Corp Cl A
MEDIA - CATV Systems
|
$29.98
|
-0.47
-1.54% |
$30.44
|
14,024,974
104.35% of 50 DAV
50 DAV is 13,440,500
|
$30.88
-2.90%
|
6/11/2012
|
$29.94
|
PP = $30.98
|
|
MB = $32.53
|
Most Recent Note - 6/12/2012 12:05:34 PM
Y - Perched within close striking distance of its 52-week high today. New pivot point was cited based on its 5/01/12 high plus 10 cents. The prior low ($28.09 on 5/21/12) defines important near-term support to watch. See the latest FSU analysis for more details and a new annotated graph.
>>> The latest Featured Stock Update with an annotated graph appeared on 6/11/2012. Click here.
View all notes |
Alert me of new notes |
CANSLIM.net Company Profile |
SEC |
Zacks Reports |
StockTalk |
News |
Chart |
Request a new note
C
A N
S L
I M
|
DG
-
NYSE
Dollar General Corp
RETAIL - Discount, Variety Stores
|
$50.18
|
-0.15
-0.30% |
$50.70
|
3,448,918
109.35% of 50 DAV
50 DAV is 3,154,100
|
$50.75
-1.12%
|
5/7/2012
|
$48.51
|
PP = $47.69
|
|
MB = $50.07
|
Most Recent Note - 6/12/2012 4:29:41 PM
G - Finished at a best-ever close today. Completed another Secondary Offering on 6/05/12, its 4th Secondary Offering since September '11. See the latest FSU analysis for more details and a new annotated graph.
>>> The latest Featured Stock Update with an annotated graph appeared on 6/12/2012. Click here.
View all notes |
Alert me of new notes |
CANSLIM.net Company Profile |
SEC |
Zacks Reports |
StockTalk |
News |
Chart |
Request a new note
C
A N
S L
I M
|
Symbol/Exchange
Company Name
Industry Group |
PRICE |
CHANGE
(%Change) |
Day High |
Volume
(% DAV)
(% 50 day avg vol) |
52 Wk Hi
% From Hi |
Featured
Date |
Price
Featured |
Pivot Featured |
|
Max Buy |
EXPE
-
NASDAQ
Expedia Inc
INTERNET - Internet Information Providers
|
$47.43
|
-1.30
-2.67% |
$47.99
|
6,497,772
146.92% of 50 DAV
50 DAV is 4,422,800
|
$49.12
-3.44%
|
4/27/2012
|
$41.80
|
PP = $35.57
|
|
MB = $37.35
|
 Most Recent Note - 6/13/2012 12:00:50 PM
G - Pulling back today after recently wedging to new 52-week highs with gains backed by below average volume. It is extended from its prior highs in the $43 area which define initial support above its 50 DMA line.
>>> The latest Featured Stock Update with an annotated graph appeared on 6/8/2012. Click here.
View all notes |
Alert me of new notes |
CANSLIM.net Company Profile |
SEC |
Zacks Reports |
StockTalk |
News |
Chart |
Request a new note
C
A N
S L
I M
|
GNC
-
NYSE
G N C Holdings Inc
RETAIL - Drug Stores
|
$36.66
|
-1.21
-3.20% |
$37.91
|
1,552,830
81.72% of 50 DAV
50 DAV is 1,900,100
|
$41.95
-12.61%
|
1/19/2012
|
$28.99
|
PP = $29.60
|
|
MB = $31.08
|
Most Recent Note - 6/13/2012 6:18:42 PM
G - Slumped below its 50 DMA line with a loss today on lighter volume. Recent lows define important near-term support while it could be forming a "double bottom" base.
>>> The latest Featured Stock Update with an annotated graph appeared on 6/6/2012. Click here.
View all notes |
Alert me of new notes |
CANSLIM.net Company Profile |
SEC |
Zacks Reports |
StockTalk |
News |
Chart |
Request a new note
C
A N
S L
I M
|
NTES
-
NASDAQ
Netease Inc Adr
INTERNET - Internet Information Providers
|
$59.26
|
-1.49
-2.45% |
$61.22
|
838,489
118.87% of 50 DAV
50 DAV is 705,400
|
$65.54
-9.58%
|
3/19/2012
|
$56.18
|
PP = $55.10
|
|
MB = $57.86
|
Most Recent Note - 6/12/2012 2:09:17 PM
G - Pulling back from its 52-week high with a 3rd consecutive loss today on lighter than average volume. Its 50 DMA line defines near-term support and prior lows near the $55 area define the next important chart support to watch where violations may trigger a worrisome technical sell signals.
>>> The latest Featured Stock Update with an annotated graph appeared on 5/24/2012. Click here.
View all notes |
Alert me of new notes |
CANSLIM.net Company Profile |
SEC |
Zacks Reports |
StockTalk |
News |
Chart |
Request a new note
C
A N
S L
I M
|
SWI
-
NYSE
Solarwinds Inc
COMPUTER SOFTWARE and SERVICES - Application Software
|
$43.02
|
-0.88
-2.00% |
$44.16
|
403,206
38.58% of 50 DAV
50 DAV is 1,045,200
|
$48.64
-11.55%
|
4/26/2012
|
$45.15
|
PP = $42.32
|
|
MB = $44.44
|
Most Recent Note - 6/11/2012 4:50:47 PM
G - Slumped back toward its 50 DMA line and finished near the session low with a loss today on higher but below average volume. A damaging violation of that short-term average and the 6/04/11 low ($41.24) would trigger a more worrisome technical sell signals.
>>> The latest Featured Stock Update with an annotated graph appeared on 5/21/2012. Click here.
View all notes |
Alert me of new notes |
CANSLIM.net Company Profile |
SEC |
Zacks Reports |
StockTalk |
News |
Chart |
Request a new note
C
A N
S L
I M
|
SXCI
-
NASDAQ
S X C Health Solutions
COMPUTER SOFTWARE and SERVICES - Healthcare Information Service
|
$92.17
|
-0.34
-0.37% |
$92.52
|
716,265
58.23% of 50 DAV
50 DAV is 1,230,000
|
$100.50
-8.29%
|
2/23/2012
|
$68.24
|
PP = $66.05
|
|
MB = $69.35
|
Most Recent Note - 6/11/2012 4:48:19 PM
G - Closed near the session low today with a loss on below average volume. Its 50 DMA line defines important support for chart readers. Completed a new Public Offering on 5/10/12. It may be forming a new base, however the M criteria argues against new buying efforts without a confirmed rally with a solid FTD from at least one of the major averages.
>>> The latest Featured Stock Update with an annotated graph appeared on 5/17/2012. Click here.
View all notes |
Alert me of new notes |
CANSLIM.net Company Profile |
SEC |
Zacks Reports |
StockTalk |
News |
Chart |
Request a new note
C
A N
S L
I M
|
Symbol/Exchange
Company Name
Industry Group |
PRICE |
CHANGE
(%Change) |
Day High |
Volume
(% DAV)
(% 50 day avg vol) |
52 Wk Hi
% From Hi |
Featured
Date |
Price
Featured |
Pivot Featured |
|
Max Buy |
TDG
-
NYSE
Transdigm Group Inc
AEROSPACE/DEFENSE - Aerospace/Defense Products and; Services
|
$125.17
|
-1.67
-1.32% |
$127.04
|
304,900
56.79% of 50 DAV
50 DAV is 536,900
|
$132.69
-5.67%
|
2/29/2012
|
$120.10
|
PP = $118.93
|
|
MB = $124.88
|
Most Recent Note - 6/13/2012 6:20:07 PM
G - Quietly consolidating above important support at its 50 DMA line while perched within close striking distance of its all-time high. Its prior low ($118.43 on 5/18/12) defines the next important near-term chart support level to watch.
>>> The latest Featured Stock Update with an annotated graph appeared on 5/23/2012. Click here.
View all notes |
Alert me of new notes |
CANSLIM.net Company Profile |
SEC |
Zacks Reports |
StockTalk |
News |
Chart |
Request a new note
C
A N
S L
I M
|
UA
-
NYSE
Under Armour Inc Cl A
CONSUMER NON-DURABLES - Textile - Apparel Clothing
|
$100.93
|
-4.90
-4.63% |
$105.80
|
1,135,010
116.05% of 50 DAV
50 DAV is 978,000
|
$107.15
-5.80%
|
2/15/2012
|
$85.77
|
PP = $84.86
|
|
MB = $89.10
|
Most Recent Note - 6/13/2012 6:22:30 PM
G - Ended near the session low today with a large loss on lighter (but still above average) volume, pulling back from a best-ever close. Perched near its 52-week and all-time highs after a "negative reversal" on 6/11/12 with above average volume. It was previously noted - "No resistance remains due to overhead supply. Fundamental concerns remain after a slightly sub par earnings increase in the Dec '11 quarter."
>>> The latest Featured Stock Update with an annotated graph appeared on 5/29/2012. Click here.
View all notes |
Alert me of new notes |
CANSLIM.net Company Profile |
SEC |
Zacks Reports |
StockTalk |
News |
Chart |
Request a new note
C
A N
S L
I M
|
VSI
-
NYSE
Vitamin Shoppe Inc
SPECIALTY RETAIL - Specialty Retail, Other
|
$49.23
|
-1.44
-2.84% |
$50.72
|
318,197
70.29% of 50 DAV
50 DAV is 452,700
|
$55.29
-10.96%
|
4/25/2012
|
$47.77
|
PP = $48.46
|
|
MB = $50.88
|
Most Recent Note - 6/13/2012 6:23:21 PM
Y - Down today on below average volume, quietly consolidating above prior highs in the $48 area and above its 50 DMA line which coincide defining important chart support. Market conditions argue against new buying efforts until a FTD from at least one of the major averages confirms a new rally. Color code was changed to yellow while one may consider a secondary buy point from its successful test of the 10 week average up to +5% above the recent high. Disciplined investors always limit losses by selling if a stock falls more than -7% from their buy price.
>>> The latest Featured Stock Update with an annotated graph appeared on 6/4/2012. Click here.
View all notes |
Alert me of new notes |
CANSLIM.net Company Profile |
SEC |
Zacks Reports |
StockTalk |
News |
Chart |
Request a new note
C
A N
S L
I M
|
WFM
-
NASDAQ
Whole Foods Market Inc
RETAIL - Grocery Stores
|
$89.90
|
-1.41
-1.54% |
$91.92
|
4,720,184
268.80% of 50 DAV
50 DAV is 1,756,000
|
$92.00
-2.28%
|
6/13/2012
|
$89.90
|
PP = $91.60
|
|
MB = $96.18
|
Most Recent Note - 6/13/2012 6:17:24 PM
Y - Churned above average volume today near its 52-week high with no resistance remaining due to overhead supply. Its 50 DMA line and prior lows define important near-term support. New pivot point is cited based on its 5/04/12 high plus 10 cents. See the latest FSU analysis for more details and a new annotated graph.
>>> The latest Featured Stock Update with an annotated graph appeared on 6/13/2012. Click here.
View all notes |
Alert me of new notes |
CANSLIM.net Company Profile |
SEC |
Zacks Reports |
StockTalk |
News |
Chart |
Request a new note
C
A N
S L
I M
|
|
|
|
THESE ARE NOT BUY RECOMMENDATIONS!
Comments contained in the body of this report are technical
opinions only. The material herein has been obtained
from sources believed to be reliable and accurate, however,
its accuracy and completeness cannot be guaranteed.
This site is not an investment advisor, hence it does
not endorse or recommend any securities or other investments.
Any recommendation contained in this report may not
be suitable for all investors and it is not to be deemed
an offer or solicitation on our part with respect to
the purchase or sale of any securities. All trademarks,
service marks and trade names appearing in this report
are the property of their respective owners, and are
likewise used for identification purposes only.
This report is a service available
only to active Paid Premium Members.
You may opt-out of receiving report notifications
at any time. Questions or comments may be submitted
by writing to Premium Membership Services 665 S.E. 10 Street, Suite 201 Deerfield Beach, FL 33441-5634 or by calling 1-800-965-8307
or 954-785-1121.
|
|
|

