You are not logged in.
This means you
CAN ONLY VIEW reports that were published prior to Monday, April 14, 2025.
You
MUST UPGRADE YOUR MEMBERSHIP if you want to see any current reports.
AFTER MARKET UPDATE - WEDNESDAY, JUNE 12TH, 2013
Previous After Market Report Next After Market Report >>>
|
|
|
|
DOW |
-126.79 |
14,995.23 |
-0.84% |
|
Volume |
691,937,150 |
+0% |
|
Volume |
1,558,245,680 |
+3% |
|
NASDAQ |
-36.52 |
3,400.43 |
-1.06% |
|
Advancers |
583 |
18% |
|
Advancers |
751 |
29% |
|
S&P 500 |
-13.61 |
1,612.52 |
-0.84% |
|
Decliners |
2,509 |
79% |
|
Decliners |
1,738 |
68% |
|
Russell 2000 |
-9.14 |
972.31 |
-0.93% |
|
52 Wk Highs |
41 |
|
|
52 Wk Highs |
97 |
|
|
S&P 600 |
-4.55 |
546.71 |
-0.83% |
|
52 Wk Lows |
401 |
|
|
52 Wk Lows |
37 |
|
|
 |
Correction Prompts Defensive Posturing; Market Reversed Early Gains
Kenneth J. Gruneisen - Passed the CAN SLIM® Master's Exam
The major averages lost ground for a third consecutive session on Wednesday. The weak action has been recognized as a market correction. The volume totals were reported higher than the prior session total on the NYSE and on the Nasdaq exchange. Breadth was negative as decliners led advancers by more than a 4-1 margin on the NYSE and by more than 2-1 on the Nasdaq exchange. There were 30 high-ranked companies from the CANSLIM.net Leaders List making new 52-week highs and appearing on the CANSLIM.net BreakOuts Page, up from the prior session total of 24 stocks. The number of stocks hitting new 52-week lows swelled and solidly outnumbered new 52-week highs on the NYSE, meanwhile new highs still outnumbered new lows on the Nasdaq exchange. There were gains for only 3 of the 11 high-ranked companies currently included on the Featured Stocks Page.
All 10 sectors on the S&P finished lower, led by declines in financial, consumer and telecom stocks. Shares of Vodafone Group Plc (VOD -2.40%) fell on reports that the company is looking to acquire a German telecom firm. On the earnings front, Ulta Salon Cosmetics & Fragrance, Inc (ULTA +14.87%) rallied after the company topped analysts' expectations in the quarter. On the M&A front, Cooper Tire & Rubber Co (CTB +41.12%) rose on news that the company was being acquired by Apollo Tyres for $2.5 billion. In other news, data management firm Gigamon (+49.8%) surged following their IPO at $19 per share.
Turning to fixed income markets, Treasuries ended lower along the curve. The benchmark 10-year was is down 1/2 of a point to yield 2.23% and the 30-year bond fell more than a full point to yield 3.37%.
The damage worsened on Wednesday after market (M criteria) weakness was labeled a "correction" Tuesday evening by writers at the newspaper. There is no denying that the weak and damaging action in the broader market serves as a clear reminder for investors - be protective of any gains, and limit losses! Be especially watchful for any individual issues flashing technical sell signals. It is vitally important to your success with the fact-based investment system to reduce exposure and preserve cash during market downdrafts.
As always, watch upcoming CANSLIM.net reports for new action-worthy leaders best matching the winning models to be covered as they emerge and then included on the Featured Stocks Page - with our Certified experts' latest notes and links to additional resources including detailed analysis with annotated graphs. The Premium Member Homepage - includes "dynamic archives" to all prior pay reports published. Watch for an announcement via email concerning the next WEBCAST.
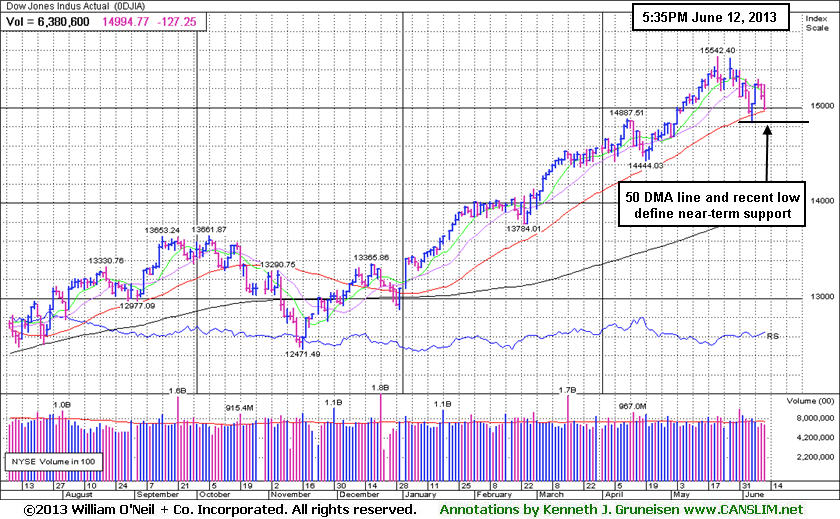
PICTURED: The Dow Jones Industrial Average fell 127 points to 14,995 after being up by as many as 119 points in early trading. The recent low and its 50-day moving average (DMA) line define important near-term chart support to watch where any more damaging losses would raise serious concerns.
|
 Kenneth J. Gruneisen started out as a licensed stockbroker in August 1987, a couple of months prior to the historic stock market crash that took the Dow Jones Industrial Average down -22.6% in a single day. He has published daily fact-based fundamental and technical analysis on high-ranked stocks online for two decades. Through FACTBASEDINVESTING.COM, Kenneth provides educational articles, news, market commentary, and other information regarding proven investment systems that work in good times and bad.
Comments contained in the body of this report are technical opinions only and are not necessarily those of Gruneisen Growth Corp. The material herein has been obtained from sources believed to be reliable and accurate, however, its accuracy and completeness cannot be guaranteed. Our firm, employees, and customers may effect transactions, including transactions contrary to any recommendation herein, or have positions in the securities mentioned herein or options with respect thereto. Any recommendation contained in this report may not be suitable for all investors and it is not to be deemed an offer or solicitation on our part with respect to the purchase or sale of any securities. |
|
 |
Financial, Retail, Tech, and Energy-Related Groups Fell
Kenneth J. Gruneisen - Passed the CAN SLIM® Master's Exam
Losses for the Retail Index ($RLX -0.99%) and weakness in financial shares was a negative influence on the major averages as the Bank Index ($BKX -1.05%) and the Broker/Dealer Index ($XBD -0.80%) fell. The Semiconductor Index ($SOX -1.10%), Biotechnology Index ($BTK -1.06%), Internet Index ($IIX -0.98%), and Networking Index ($NWX -0.74%) suffered unanimous losses. Weakness in energy-related shares dragged the Oil Services Index ($OSX -0.95%) and the Integrated Oil Index ($XOI -0.91%) lower. Defensive groups were mixed as the Healthcare Index ($HMO -0.72%) fell and the Gold & Silver Index ($XAU +0.81%) posted a standout gain.
Charts courtesy www.stockcharts.com
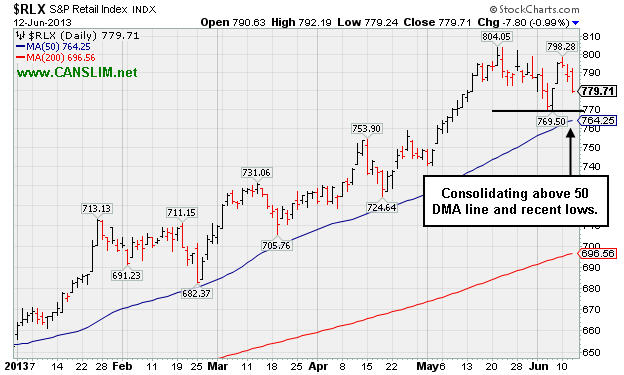
PICTURED: The Retail Index ($RLX -0.99%) is consolidating above its 50-day moving average (DMA) line and above recent lows defining important near-term support.
| Oil Services |
$OSX |
250.16 |
-2.39 |
-0.95% |
+13.63% |
| Healthcare |
$HMO |
3,089.15 |
-22.32 |
-0.72% |
+22.87% |
| Integrated Oil |
$XOI |
1,355.93 |
-12.40 |
-0.91% |
+9.19% |
| Semiconductor |
$SOX |
458.33 |
-5.10 |
-1.10% |
+19.34% |
| Networking |
$NWX |
258.81 |
-1.93 |
-0.74% |
+14.24% |
| Internet |
$IIX |
374.79 |
-3.69 |
-0.98% |
+14.62% |
| Broker/Dealer |
$XBD |
123.46 |
-1.00 |
-0.80% |
+30.88% |
| Retail |
$RLX |
779.71 |
-7.80 |
-0.99% |
+19.39% |
| Gold & Silver |
$XAU |
103.27 |
+0.83 |
+0.81% |
-37.64% |
| Bank |
$BKX |
60.27 |
-0.64 |
-1.05% |
+17.53% |
| Biotech |
$BTK |
1,919.03 |
-20.50 |
-1.06% |
+24.05% |
|
|
|
 |
Finding Support Above 50-Day Moving Average Line
Kenneth J. Gruneisen - Passed the CAN SLIM® Master's Exam
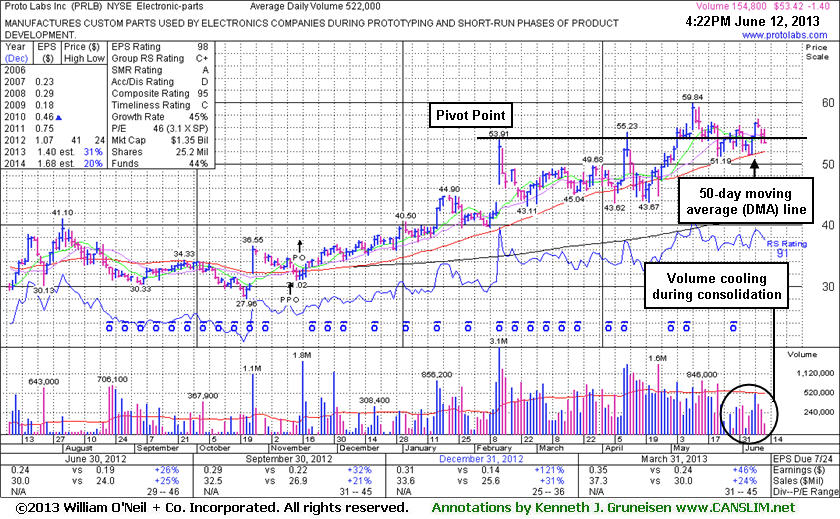
Proto Labs Inc (PRLB -$1.40 or -2.55% to $53.42) is consolidating above important support at its 50-day moving average (DMA) line with volume totals cooling in recent weeks. A subsequent violation may trigger a technical sell signal. The high-ranked Electronic - Parts firm was last shown in this FSU section with an annotated graph on 5/24/13 under the headline, "Finished Week With Quiet Gains After Negating Prior Breakout". It may continue to find support above its 50-day moving average (DMA) line and resume rallying, however disciplined investors always limit losses by selling if any stock falls more than -7% from their purchase price. Keep in mind that 3 out of 4 stocks tend to move in the direction of the major averages (M criteria) and weak action in the broader market this week has been recognized as a "correction" which prompts disciplined investors to adopt a more defensive stance.
The previously cited pivot point (based on its 2/13/13 high) still was considered a very important threshold as it hit a new 52-week high on 5/03/13 with a solid gain backed by +47% above average volume, sufficient to clinch a technical buy signal. However, subsequent gains lacked volume conviction, and then distributional action began taking its toll. The number of top-rated funds owning its shares rose from 131 in Jun '12 to 207 in Mar '13, a reassuring trend concerning the I criteria. Its small supply of only 18.9 million shares (S criteria) in the publicly traded float is ideal, yet it can contribute to greater price volatility in the event of institutional buying or selling. Its Accumulation/ Distribution Rating is currently a D and was noted as a concern earlier. It recently reported earnings +46% on +24% sales revenues for the Mar '13 quarter, continuing its strong growth trend satisfying the C criteria.
|
|
|
Color Codes Explained :
Y - Better candidates highlighted by our
staff of experts.
G - Previously featured
in past reports as yellow but may no longer be buyable under the
guidelines.
***Last / Change / Volume data in this table is the closing quote data***
Symbol/Exchange
Company Name
Industry Group |
PRICE |
CHANGE
(%Change) |
Day High |
Volume
(% DAV)
(% 50 day avg vol) |
52 Wk Hi
% From Hi |
Featured
Date |
Price
Featured |
Pivot Featured |
|
Max Buy |
AL
-
NYSE
Air Lease Corp Cl A
DIVERSIFIED SERVICES - Rental and Leasing Services
|
$27.24
|
-0.12
-0.44% |
$27.65
|
266,460
46.46% of 50 DAV
50 DAV is 573,500
|
$31.00
-12.13%
|
5/9/2013
|
$30.95
|
PP = $29.38
|
|
MB = $30.85
|
Most Recent Note - 6/10/2013 5:45:32 PM
G - Posted a gain today with below average volume and it remains below its 50 DMA line which may now act as resistance. Completed a Secondary Offering on 5/31/13.
>>> The latest Featured Stock Update with an annotated graph appeared on 5/30/2013. Click here.
View all notes |
Alert me of new notes |
CANSLIM.net Company Profile |
SEC |
Zacks Reports |
StockTalk |
News |
Chart |
Request a new note
C
A N
S L
I M


|
AMBA
-
NASDAQ
Ambarella Inc
ELECTRONICS - Semiconductor - Specialized
|
$17.04
|
-0.40
-2.29% |
$17.75
|
1,223,072
125.99% of 50 DAV
50 DAV is 970,800
|
$18.21
-6.43%
|
5/6/2013
|
$15.31
|
PP = $16.10
|
|
MB = $16.91
|
Most Recent Note - 6/11/2013 12:07:34 PM
G - Trading above average volume behind today's 3rd consecutive gain and hitting a new 52-week high. Reported strong earnings and revenues increases for the April '13 quarter. Recent lows and its 50 DMA line ($14.69 now) define important chart support to watch on pullbacks.
>>> The latest Featured Stock Update with an annotated graph appeared on 5/29/2013. Click here.
View all notes |
Alert me of new notes |
CANSLIM.net Company Profile |
SEC |
Zacks Reports |
StockTalk |
News |
Chart |
Request a new note
C
A N
S L
I M
|
EQM
-
NYSE
E Q T Midstream Partners
ENERGY - Oil and Gas Pipelines
|
$46.38
|
+0.18
0.39% |
$46.76
|
34,285
31.69% of 50 DAV
50 DAV is 108,200
|
$51.72
-10.32%
|
4/25/2013
|
$40.16
|
PP = $40.84
|
|
MB = $42.88
|
Most Recent Note - 6/10/2013 5:41:04 PM
G - Posted its 3rd consecutive gain on light volume since halting its slide well above its 50 DMA line defining important near-term chart support.
>>> The latest Featured Stock Update with an annotated graph appeared on 6/6/2013. Click here.
View all notes |
Alert me of new notes |
CANSLIM.net Company Profile |
SEC |
Zacks Reports |
StockTalk |
News |
Chart |
Request a new note
C
A N
S L
I M
|
FLT
-
NYSE
Fleetcor Technologies
DIVERSIFIED SERVICES - Business/Management Services
|
$87.54
|
-0.04
-0.05% |
$88.08
|
970,092
110.75% of 50 DAV
50 DAV is 875,900
|
$88.83
-1.45%
|
5/29/2013
|
$86.02
|
PP = $85.66
|
|
MB = $89.94
|
Most Recent Note - 6/11/2013 3:50:28 PM
Y- Hovering near its all-time high with volume totals recently cooling. Rose from an advanced "3-weeks tight" base with its 5/29/13 gain on +56% above average volume. It may go on to produce more climactic gains, however this was a riskier "late-stage" base.
>>> The latest Featured Stock Update with an annotated graph appeared on 5/31/2013. Click here.
View all notes |
Alert me of new notes |
CANSLIM.net Company Profile |
SEC |
Zacks Reports |
StockTalk |
News |
Chart |
Request a new note
C
A N
S L
I M
|
LOPE
-
NASDAQ
Grand Canyon Education
DIVERSIFIED SERVICES - Education and; Training Services
|
$32.11
|
-0.38
-1.17% |
$32.87
|
204,446
52.46% of 50 DAV
50 DAV is 389,700
|
$34.07
-5.75%
|
5/10/2013
|
$29.03
|
PP = $27.28
|
|
MB = $28.64
|
Most Recent Note - 6/7/2013 4:11:23 PM
G - Volume totals have been cooling while still holding its ground stubbornly perched at its 52-week high, very extended from its previous base. Prior highs in the $27 area define support to watch on pullbacks. Gains of greater than +20% in the first 2-3 weeks following its "breakaway gap" suggest holding for a minimum of 8 week under the fact-based investment system's rules.
>>> The latest Featured Stock Update with an annotated graph appeared on 6/3/2013. Click here.
View all notes |
Alert me of new notes |
CANSLIM.net Company Profile |
SEC |
Zacks Reports |
StockTalk |
News |
Chart |
Request a new note
C
A N
S L
I M
|
Symbol/Exchange
Company Name
Industry Group |
PRICE |
CHANGE
(%Change) |
Day High |
Volume
(% DAV)
(% 50 day avg vol) |
52 Wk Hi
% From Hi |
Featured
Date |
Price
Featured |
Pivot Featured |
|
Max Buy |
MRLN
-
NASDAQ
Marlin Business Services
DIVERSIFIED SERVICES - Rental and Leasing Services
|
$23.49
|
-0.05
-0.21% |
$23.73
|
45,713
197.04% of 50 DAV
50 DAV is 23,200
|
$25.97
-9.55%
|
3/15/2013
|
$22.29
|
PP = $23.18
|
|
MB = $24.34
|
Most Recent Note - 6/11/2013 3:46:11 PM
Y - Slumping back near its 50 DMA line with a loss today on light volume. The recent low ($21.49 on 5/23/13) defines important near-term support below that short-term average where a violation would raise more serious concerns.
>>> The latest Featured Stock Update with an annotated graph appeared on 6/11/2013. Click here.
View all notes |
Alert me of new notes |
CANSLIM.net Company Profile |
SEC |
Zacks Reports |
StockTalk |
News |
Chart |
Request a new note
C
A N
S L
I M
|
NSM
-
NYSE
Nationstar Mtg Hldgs Inc
FINANCIAL SERVICES - Credit Services
|
$41.10
|
-0.69
-1.65% |
$42.17
|
609,162
51.63% of 50 DAV
50 DAV is 1,179,800
|
$46.91
-12.39%
|
5/7/2013
|
$39.71
|
PP = $42.34
|
|
MB = $44.46
|
Most Recent Note - 6/10/2013 5:43:20 PM
Y - Posted a 3rd consecutive small gain on light volume. Disciplined investors always limit losses if any stock falls more than -7% from their purchase price.
>>> The latest Featured Stock Update with an annotated graph appeared on 5/28/2013. Click here.
View all notes |
Alert me of new notes |
CANSLIM.net Company Profile |
SEC |
Zacks Reports |
StockTalk |
News |
Chart |
Request a new note
C
A N
S L
I M
|
PRAA
-
NASDAQ
Portfolio Recovery Assoc
DIVERSIFIED SERVICES - Business/Management Services
|
$153.77
|
+1.87
1.23% |
$154.81
|
75,706
106.48% of 50 DAV
50 DAV is 71,100
|
$153.88
-0.07%
|
5/1/2013
|
$130.77
|
PP = $127.88
|
|
MB = $134.27
|
Most Recent Note - 6/10/2013 5:36:19 PM
G - Endured mild distributional pressure last week yet it remains perched near its high holding its ground with no resistance due to overhead supply. Its 50 DMA line defines important chart support. See the latest FSU analysis for more details and a new annotated graph.
>>> The latest Featured Stock Update with an annotated graph appeared on 6/10/2013. Click here.
View all notes |
Alert me of new notes |
CANSLIM.net Company Profile |
SEC |
Zacks Reports |
StockTalk |
News |
Chart |
Request a new note
C
A N
S L
I M
|
PRLB
-
NYSE
Proto Labs Inc
MANUFACTURING - Small Tools and Accessories
|
$53.42
|
-1.40
-2.55% |
$55.69
|
155,086
29.71% of 50 DAV
50 DAV is 522,000
|
$59.84
-10.73%
|
5/3/2013
|
$54.77
|
PP = $54.01
|
|
MB = $56.71
|
 Most Recent Note - 6/12/2013 6:03:36 PM
Y - Pulled back on light volume today, consolidating above important support at its 50 DMA line. A subsequent violation may trigger a technical sell signal. See the latest FSU analysis for more details and a new annotated graph.
>>> The latest Featured Stock Update with an annotated graph appeared on 6/12/2013. Click here.
View all notes |
Alert me of new notes |
CANSLIM.net Company Profile |
SEC |
Zacks Reports |
StockTalk |
News |
Chart |
Request a new note
C
A N
S L
I M
|
RRTS
-
NYSE
Roadrunner Trans Systems
TRANSPORTATION - Air Delivery and Freight Service
|
$27.95
|
+0.58
2.12% |
$28.00
|
233,917
104.52% of 50 DAV
50 DAV is 223,800
|
$28.62
-2.34%
|
4/3/2013
|
$22.77
|
PP = $23.75
|
|
MB = $24.94
|
Most Recent Note - 6/11/2013 12:51:41 PM
G - Up from earlier lows after a gap down today following an analyst downgrade, retreating from a new all-time high hit on the prior session. Fundamental concerns were raised by its sub par earnings increase in the Mar '13 quarter, below the +25% minimum guideline (C criteria).
>>> The latest Featured Stock Update with an annotated graph appeared on 6/4/2013. Click here.
View all notes |
Alert me of new notes |
CANSLIM.net Company Profile |
SEC |
Zacks Reports |
StockTalk |
News |
Chart |
Request a new note
C
A N
S L
I M
|
Symbol/Exchange
Company Name
Industry Group |
PRICE |
CHANGE
(%Change) |
Day High |
Volume
(% DAV)
(% 50 day avg vol) |
52 Wk Hi
% From Hi |
Featured
Date |
Price
Featured |
Pivot Featured |
|
Max Buy |
VRX
-
NYSE
Valeant Pharmaceuticals
DRUGS - Drug Manufacturers - Other
|
$83.36
|
-0.41
-0.49% |
$85.45
|
1,298,639
69.84% of 50 DAV
50 DAV is 1,859,500
|
$96.25
-13.39%
|
4/30/2013
|
$60.24
|
PP = $76.66
|
|
MB = $80.49
|
Most Recent Note - 6/7/2013 5:08:20 PM
G- Rallied since making recent acquisition plans. Support to watch is at prior highs coinciding with its 50 DMA near $76. See latest FSU analysis for more details and a new annotated graph.
>>> The latest Featured Stock Update with an annotated graph appeared on 6/7/2013. Click here.
View all notes |
Alert me of new notes |
CANSLIM.net Company Profile |
SEC |
Zacks Reports |
StockTalk |
News |
Chart |
Request a new note
C
A N
S L
I M
|
|
|
|
THESE ARE NOT BUY RECOMMENDATIONS!
Comments contained in the body of this report are technical
opinions only. The material herein has been obtained
from sources believed to be reliable and accurate, however,
its accuracy and completeness cannot be guaranteed.
This site is not an investment advisor, hence it does
not endorse or recommend any securities or other investments.
Any recommendation contained in this report may not
be suitable for all investors and it is not to be deemed
an offer or solicitation on our part with respect to
the purchase or sale of any securities. All trademarks,
service marks and trade names appearing in this report
are the property of their respective owners, and are
likewise used for identification purposes only.
This report is a service available
only to active Paid Premium Members.
You may opt-out of receiving report notifications
at any time. Questions or comments may be submitted
by writing to Premium Membership Services 665 S.E. 10 Street, Suite 201 Deerfield Beach, FL 33441-5634 or by calling 1-800-965-8307
or 954-785-1121.
|
|
|

