You are not logged in.
This means you
CAN ONLY VIEW reports that were published prior to Monday, April 14, 2025.
You
MUST UPGRADE YOUR MEMBERSHIP if you want to see any current reports.
AFTER MARKET UPDATE - TUESDAY, JUNE 12TH, 2012
Previous After Market Report Next After Market Report >>>
|
|
|
|
DOW |
+162.57 |
12,573.80 |
+1.31% |
|
Volume |
723,964,180 |
-2% |
|
Volume |
1,545,883,140 |
+7% |
|
NASDAQ |
+33.34 |
2,843.07 |
+1.19% |
|
Advancers |
2,383 |
76% |
|
Advancers |
1,729 |
67% |
|
S&P 500 |
+15.25 |
1,324.18 |
+1.17% |
|
Decliners |
660 |
21% |
|
Decliners |
761 |
29% |
|
Russell 2000 |
+10.52 |
761.53 |
+1.40% |
|
52 Wk Highs |
32 |
|
|
52 Wk Highs |
32 |
|
|
S&P 600 |
+5.40 |
425.89 |
+1.28% |
|
52 Wk Lows |
52 |
|
|
52 Wk Lows |
61 |
|
|
 |
Leadership Waned While Major Averages Rose on Mixed Volume Totals
Kenneth J. Gruneisen - Passed the CAN SLIM® Master's Exam
The major averages posted gains on Tuesday's session, however it was not a convincing follow-through day. Volume totals were reported mixed, higher on the Nasdaq exchange and lower on the NYSE versus the prior session. Breadth was positive as advancers led decliners by more than a 3-1 ratio on the NYSE and by more than 2-1 on the Nasdaq exchange. The total number of new 52-week highs outnumbered new 52-week lows on the Nasdaq exchange for a 5th consecutive session, however new lows outnumbered new highs on the NYSE. Only 13 high-ranked companies from the CANSLIM.net Leaders List made new 52-week highs and appeared on the CANSLIM.net BreakOuts Page, down from the prior session total of 41 stocks. At Tuesday's close there were gains for 13 of the 14 high-ranked companies currently included on the Featured Stocks Page.
Stocks were choppy in early morning trading after Fitch Ratings cut the long-term credit rating of 18 Spanish banks and warned that the country would fall short of their budget targets. Despite this, stocks regained their footing, paring most of Monday's losses.
All 10 sectors on the S&P ended in the green, led by a rally in material and industrial stocks. Shares of Alcoa Inc (AA +2.47%) and Caterpillar Inc (CAT +2.18%) gained ground. Financials also showed strength throughout the session with Bank of America Corp (BAC +2.88%) and Citigroup Inc (C +4.31%) rose. A rebound in crude oil prices helped lift the energy sector as Exxon Mobile Corp (XOM +1.23%) posted a gain. On the earnings front, Michael Kors Holdings Ltd (KORS +7.65%) closed higher after the company topped analysts' expectations in their quarterly profit tally.
In bondland, Treasuries were lower along the curve. The benchmark 10-year note gave up 11/16 to yield 1.67% and the 30-year bond fell over a point to yield 2.77%.
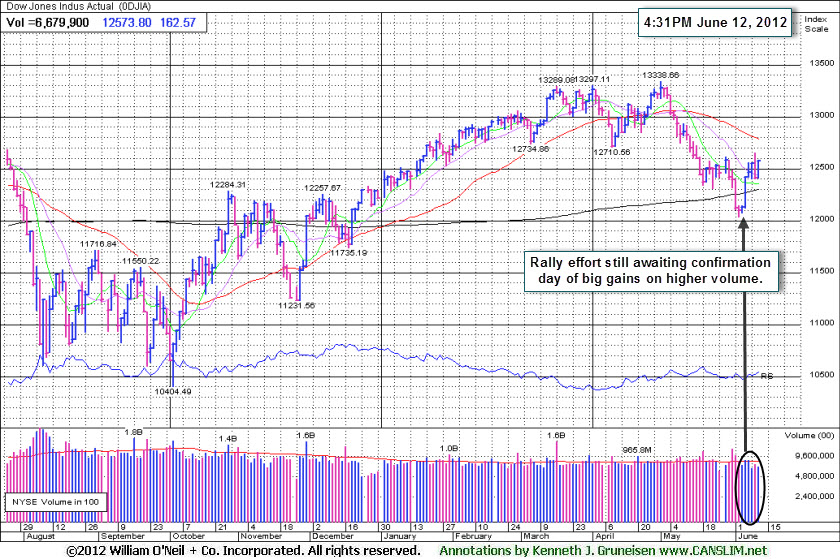
Technically, the gains by the major averages on Tuesday's session were not big enough percentage-wise, and lighter volume on the NYSE and below average volume totals on both major exchanges gave another key indication that the rally attempt remains suspect while it is also lacking the robust leadership (expansion in stocks hitting new 52-week highs) to be considered a valid follow-through day (FTD).
The major averages (M criteria) are technically still considered to be in a rally attempt within an ongoing correction, and stocks may still be vulnerable to greater downside. Historical studies suggest that the most constructive market rallies produced a solid follow-through day (FTD) between Days 4-7 of a new rally effort. Gains of +1.4% or greater by at least one of the major indexes should be backed by higher volume (preferably above average volume) coupled with an expansion in the number of stocks hitting new highs. Only fresh technical proof may give fact-based investors the clearance to begin with new buying efforts strictly in sound buy candidates. Meanwhile, investors should keep up a watchlist of worthy buy candidates while remaining protective of capital.
PICTURED: The Dow Jones Industrial Average is still awaiting confirming gains on higher volume after Day 6 of its rally attempt.
|
 Kenneth J. Gruneisen started out as a licensed stockbroker in August 1987, a couple of months prior to the historic stock market crash that took the Dow Jones Industrial Average down -22.6% in a single day. He has published daily fact-based fundamental and technical analysis on high-ranked stocks online for two decades. Through FACTBASEDINVESTING.COM, Kenneth provides educational articles, news, market commentary, and other information regarding proven investment systems that work in good times and bad.
Comments contained in the body of this report are technical opinions only and are not necessarily those of Gruneisen Growth Corp. The material herein has been obtained from sources believed to be reliable and accurate, however, its accuracy and completeness cannot be guaranteed. Our firm, employees, and customers may effect transactions, including transactions contrary to any recommendation herein, or have positions in the securities mentioned herein or options with respect thereto. Any recommendation contained in this report may not be suitable for all investors and it is not to be deemed an offer or solicitation on our part with respect to the purchase or sale of any securities. |
|
 |
Tech, Financial, Retail, Healthcare, Commodity-Linked Groups Rose
Kenneth J. Gruneisen - Passed the CAN SLIM® Master's Exam
The Semiconductor Index ($SOX +2.20%) led the tech sector higher while the Networking Index ($NWX +1.87%), Biotechnology Index ($BTK +1.34%), and Internet Index ($IIX +0.97%) also rose. The Healthcare Index ($HMO +0.83%) and Retail Index ($RLX +1.13%) posted gains, and financial shares were a positive influence as the Broker/Dealer Index ($XBD +0.84%) and Bank Index ($BKX +2.07%) helped underpin the major averages' gains. Commodity-linked groups posted gains as the Gold & Silver Index ($XAU +1.98%), Oil Services Index ($OSX +1.73%), and Integrated Oil Index ($XOI +1.17%) also rose.
Charts courtesy www.stockcharts.com
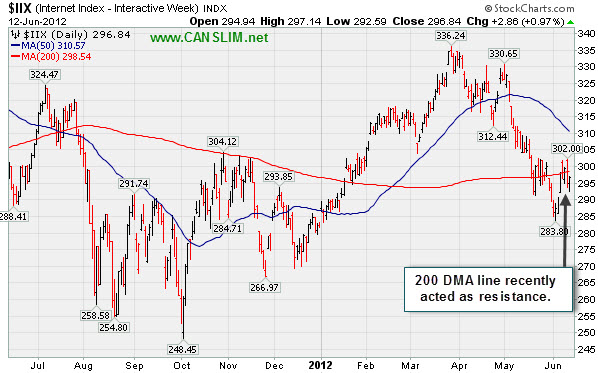
PICTURED: The Internet Index ($IIX +0.97%) recently encountered resistance when trying to rebound above its 200-day moving average (DMA) line.
| Oil Services |
$OSX |
201.40 |
+3.43 |
+1.73% |
-6.88% |
| Healthcare |
$HMO |
2,223.17 |
+18.20 |
+0.83% |
-2.56% |
| Integrated Oil |
$XOI |
1,126.19 |
+13.04 |
+1.17% |
-8.37% |
| Semiconductor |
$SOX |
373.74 |
+8.05 |
+2.20% |
+2.55% |
| Networking |
$NWX |
207.89 |
+3.81 |
+1.87% |
-3.38% |
| Internet |
$IIX |
296.83 |
+2.85 |
+0.97% |
+5.36% |
| Broker/Dealer |
$XBD |
85.22 |
+0.71 |
+0.84% |
+2.34% |
| Retail |
$RLX |
610.81 |
+6.85 |
+1.13% |
+16.75% |
| Gold & Silver |
$XAU |
162.55 |
+3.15 |
+1.98% |
-10.01% |
| Bank |
$BKX |
43.49 |
+0.88 |
+2.07% |
+10.44% |
| Biotech |
$BTK |
1,407.81 |
+18.62 |
+1.34% |
+28.99% |
|
|
|
 |
Four Secondary Offerings in Past Year for Discount Retailer
Kenneth J. Gruneisen - Passed the CAN SLIM® Master's Exam
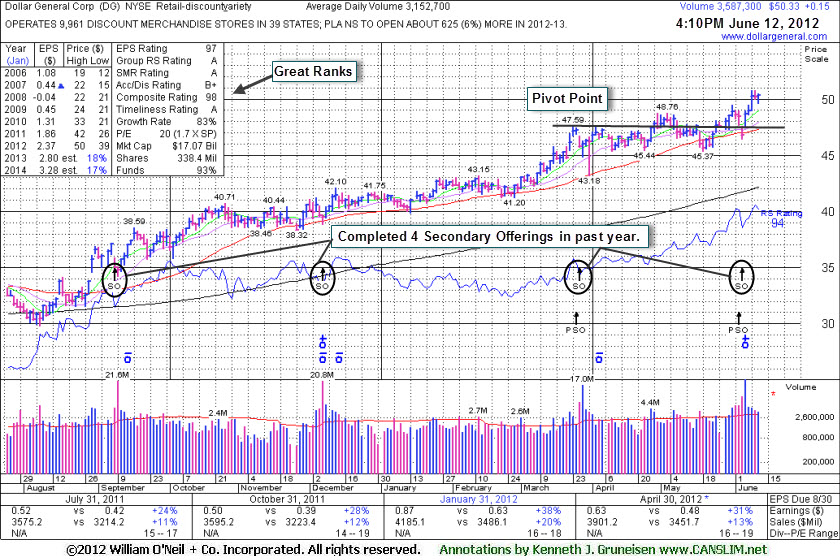
Dollar General Corp (DG +$0.15 or +0.30% to $50.33) finished the session at a best-ever close today. It found support near its 50-day moving average (DMA) line again during the last pullback. It completed another Secondary Offering on 6/05/12, its 4th Secondary Offering since September '11. It recently reported earnings +31% on +13% sales revenues for the quarter ended April 30, 2012 versus the year ago period.
Poor action in the major averages (M criteria) has been an overriding concern that argued against new buying efforts since its last appearance in this FSU section with an annotated graph on 5/09/12 under the headline, "Market Weakness is an Overriding Concern". That appearance came shortly after it was highlighted in yellow in the 5/07/12 mid-day report (read here) with pivot point based on its 3/23/12 high plus 10 cents. It found support near its 50-day moving average (DMA) line and continued higher.
The number of top-rated funds owning its shares rose from 377 in Jun '11 to 662 in Mar '12, a reassuring sign concerning the I criteria. Secondary Offerings were also completed on 9/08/11, 12/07/11, and 3/27/12. As previously noted, often times companies attract additional institutional interest with the help of underwriters when such offerings are completed.
It reported earnings +38% on +20% sales revenues for the quarter ended January 31, 2012 versus the year ago period, showing encouraging acceleration in sequential quarterly sales and earnings increases. Its fundamentals (C & A criteria) have been noted as resembling past great winners.
|
|
|
Color Codes Explained :
Y - Better candidates highlighted by our
staff of experts.
G - Previously featured
in past reports as yellow but may no longer be buyable under the
guidelines.
***Last / Change / Volume data in this table is the closing quote data***
Symbol/Exchange
Company Name
Industry Group |
PRICE |
CHANGE
(%Change) |
Day High |
Volume
(% DAV)
(% 50 day avg vol) |
52 Wk Hi
% From Hi |
Featured
Date |
Price
Featured |
Pivot Featured |
|
Max Buy |
ALXN
-
NASDAQ
Alexion Pharmaceuticals
DRUGS - Drug Manufacturers - Other
|
$93.72
|
+3.27
3.62% |
$93.75
|
1,916,973
95.67% of 50 DAV
50 DAV is 2,003,700
|
$95.01
-1.36%
|
5/1/2012
|
$91.73
|
PP = $95.11
|
|
MB = $99.87
|
 Most Recent Note - 6/12/2012 2:02:35 PM
Y - Faces near-term resistance in the $94-95 area, but little overhead supply remains to hinder its progress while perched within close striking distance of its 52-week high today.
>>> The latest Featured Stock Update with an annotated graph appeared on 5/31/2012. Click here.
View all notes |
Alert me of new notes |
CANSLIM.net Company Profile |
SEC |
Zacks Reports |
StockTalk |
News |
Chart |
Request a new note
C
A N
S L
I M


|
ASPS
-
NASDAQ
Altisource Ptf Sltns Sa
REAL ESTATE - Property Management/Developmen
|
$66.13
|
+0.64
0.98% |
$67.03
|
97,746
72.89% of 50 DAV
50 DAV is 134,100
|
$66.51
-0.57%
|
6/5/2012
|
$60.01
|
PP = $63.00
|
|
MB = $66.15
|
Most Recent Note - 6/12/2012 2:05:08 PM
Y - Touched a new 52-week high today and no resistance remains due to overhead supply. Technically it triggered a buy signal last week and it is approaching its "max buy" level, however the major averages (M criteria) also need to confirm a new rally with a solid follow-through day before any new buying efforts are justified under the fact-based investment system.
>>> The latest Featured Stock Update with an annotated graph appeared on 6/5/2012. Click here.
View all notes |
Alert me of new notes |
CANSLIM.net Company Profile |
SEC |
Zacks Reports |
StockTalk |
News |
Chart |
Request a new note
C
A N
S L
I M
|
CERN
-
NASDAQ
Cerner Corp
COMPUTER SOFTWARE and SERVICES - Healthcare Information Service
|
$80.35
|
+2.47
3.17% |
$80.35
|
1,254,778
100.09% of 50 DAV
50 DAV is 1,253,700
|
$84.10
-4.46%
|
6/7/2012
|
$78.36
|
PP = $84.20
|
|
MB = $88.41
|
Most Recent Note - 6/12/2012 2:06:44 PM
Y - The M criteria requires a FTD before any new buying efforts may be considered under the investment system's guidelines. Volume-driven gains above its pivot point are still needed to trigger a new (or add-on) technical buy signal.
>>> The latest Featured Stock Update with an annotated graph appeared on 6/7/2012. Click here.
View all notes |
Alert me of new notes |
CANSLIM.net Company Profile |
SEC |
Zacks Reports |
StockTalk |
News |
Chart |
Request a new note
C
A N
S L
I M
|
CMCSA
-
NASDAQ
Comcast Corp Cl A
MEDIA - CATV Systems
|
$30.45
|
+0.51
1.70% |
$30.47
|
24,753,063
188.41% of 50 DAV
50 DAV is 13,137,800
|
$30.88
-1.38%
|
6/11/2012
|
$29.94
|
PP = $30.98
|
|
MB = $32.53
|
Most Recent Note - 6/12/2012 12:05:34 PM
Y - Perched within close striking distance of its 52-week high today. New pivot point was cited based on its 5/01/12 high plus 10 cents. The prior low ($28.09 on 5/21/12) defines important near-term support to watch. See the latest FSU analysis for more details and a new annotated graph.
>>> The latest Featured Stock Update with an annotated graph appeared on 6/11/2012. Click here.
View all notes |
Alert me of new notes |
CANSLIM.net Company Profile |
SEC |
Zacks Reports |
StockTalk |
News |
Chart |
Request a new note
C
A N
S L
I M
|
DG
-
NYSE
Dollar General Corp
RETAIL - Discount, Variety Stores
|
$50.33
|
+0.15
0.30% |
$50.50
|
3,631,222
115.18% of 50 DAV
50 DAV is 3,152,700
|
$50.75
-0.83%
|
5/7/2012
|
$48.51
|
PP = $47.69
|
|
MB = $50.07
|
Most Recent Note - 6/12/2012 4:29:41 PM
G - Finished at a best-ever close today. Completed another Secondary Offering on 6/05/12, its 4th Secondary Offering since September '11. See the latest FSU analysis for more details and a new annotated graph.
>>> The latest Featured Stock Update with an annotated graph appeared on 6/12/2012. Click here.
View all notes |
Alert me of new notes |
CANSLIM.net Company Profile |
SEC |
Zacks Reports |
StockTalk |
News |
Chart |
Request a new note
C
A N
S L
I M
|
Symbol/Exchange
Company Name
Industry Group |
PRICE |
CHANGE
(%Change) |
Day High |
Volume
(% DAV)
(% 50 day avg vol) |
52 Wk Hi
% From Hi |
Featured
Date |
Price
Featured |
Pivot Featured |
|
Max Buy |
EXPE
-
NASDAQ
Expedia Inc
INTERNET - Internet Information Providers
|
$48.73
|
+0.71
1.48% |
$49.12
|
3,528,203
79.29% of 50 DAV
50 DAV is 4,449,600
|
$48.79
-0.12%
|
4/27/2012
|
$41.80
|
PP = $35.57
|
|
MB = $37.35
|
Most Recent Note - 6/8/2012 5:51:50 PM
G - Hit another new 52-week high today with a gain backed by below average volume, getting more extended from its prior highs in the $43 area. See the latest FSU analysis for more details and a new annotated graph.
>>> The latest Featured Stock Update with an annotated graph appeared on 6/8/2012. Click here.
View all notes |
Alert me of new notes |
CANSLIM.net Company Profile |
SEC |
Zacks Reports |
StockTalk |
News |
Chart |
Request a new note
C
A N
S L
I M
|
GNC
-
NYSE
G N C Holdings Inc
RETAIL - Drug Stores
|
$37.98
|
+0.41
1.09% |
$38.05
|
1,312,190
69.22% of 50 DAV
50 DAV is 1,895,600
|
$41.95
-9.46%
|
1/19/2012
|
$28.99
|
PP = $29.60
|
|
MB = $31.08
|
Most Recent Note - 6/8/2012 5:56:44 PM
G - Posted a gain today on below average volume, fighting to stay above its 50 DMA line. Recent lows define important near-term support while it could be forming a "double bottom" base.
>>> The latest Featured Stock Update with an annotated graph appeared on 6/6/2012. Click here.
View all notes |
Alert me of new notes |
CANSLIM.net Company Profile |
SEC |
Zacks Reports |
StockTalk |
News |
Chart |
Request a new note
C
A N
S L
I M
|
NTES
-
NASDAQ
Netease Inc Adr
INTERNET - Internet Information Providers
|
$60.75
|
-1.05
-1.70% |
$62.41
|
609,292
86.39% of 50 DAV
50 DAV is 705,300
|
$65.54
-7.31%
|
3/19/2012
|
$56.18
|
PP = $55.10
|
|
MB = $57.86
|
Most Recent Note - 6/12/2012 2:09:17 PM
G - Pulling back from its 52-week high with a 3rd consecutive loss today on lighter than average volume. Its 50 DMA line defines near-term support and prior lows near the $55 area define the next important chart support to watch where violations may trigger a worrisome technical sell signals.
>>> The latest Featured Stock Update with an annotated graph appeared on 5/24/2012. Click here.
View all notes |
Alert me of new notes |
CANSLIM.net Company Profile |
SEC |
Zacks Reports |
StockTalk |
News |
Chart |
Request a new note
C
A N
S L
I M
|
SWI
-
NYSE
Solarwinds Inc
COMPUTER SOFTWARE and SERVICES - Application Software
|
$43.90
|
+0.79
1.83% |
$44.05
|
605,270
57.64% of 50 DAV
50 DAV is 1,050,000
|
$48.64
-9.75%
|
4/26/2012
|
$45.15
|
PP = $42.32
|
|
MB = $44.44
|
Most Recent Note - 6/11/2012 4:50:47 PM
G - Slumped back toward its 50 DMA line and finished near the session low with a loss today on higher but below average volume. A damaging violation of that short-term average and the 6/04/11 low ($41.24) would trigger a more worrisome technical sell signals.
>>> The latest Featured Stock Update with an annotated graph appeared on 5/21/2012. Click here.
View all notes |
Alert me of new notes |
CANSLIM.net Company Profile |
SEC |
Zacks Reports |
StockTalk |
News |
Chart |
Request a new note
C
A N
S L
I M
|
SXCI
-
NASDAQ
S X C Health Solutions
COMPUTER SOFTWARE and SERVICES - Healthcare Information Service
|
$92.51
|
+1.86
2.05% |
$92.57
|
433,580
35.26% of 50 DAV
50 DAV is 1,229,600
|
$100.50
-7.95%
|
2/23/2012
|
$68.24
|
PP = $66.05
|
|
MB = $69.35
|
Most Recent Note - 6/11/2012 4:48:19 PM
G - Closed near the session low today with a loss on below average volume. Its 50 DMA line defines important support for chart readers. Completed a new Public Offering on 5/10/12. It may be forming a new base, however the M criteria argues against new buying efforts without a confirmed rally with a solid FTD from at least one of the major averages.
>>> The latest Featured Stock Update with an annotated graph appeared on 5/17/2012. Click here.
View all notes |
Alert me of new notes |
CANSLIM.net Company Profile |
SEC |
Zacks Reports |
StockTalk |
News |
Chart |
Request a new note
C
A N
S L
I M
|
Symbol/Exchange
Company Name
Industry Group |
PRICE |
CHANGE
(%Change) |
Day High |
Volume
(% DAV)
(% 50 day avg vol) |
52 Wk Hi
% From Hi |
Featured
Date |
Price
Featured |
Pivot Featured |
|
Max Buy |
TDG
-
NYSE
Transdigm Group Inc
AEROSPACE/DEFENSE - Aerospace/Defense Products and; Services
|
$126.84
|
+0.76
0.60% |
$127.02
|
416,007
77.76% of 50 DAV
50 DAV is 535,000
|
$132.69
-4.41%
|
2/29/2012
|
$120.10
|
PP = $118.93
|
|
MB = $124.88
|
Most Recent Note - 6/6/2012 6:00:26 PM
G - Considerable gain today on near average volume, rallying from important support at its 50 DMA line. Its prior low ($118.43 on 5/18/12) defines the next important near-term chart support level to watch.
>>> The latest Featured Stock Update with an annotated graph appeared on 5/23/2012. Click here.
View all notes |
Alert me of new notes |
CANSLIM.net Company Profile |
SEC |
Zacks Reports |
StockTalk |
News |
Chart |
Request a new note
C
A N
S L
I M
|
UA
-
NYSE
Under Armour Inc Cl A
CONSUMER NON-DURABLES - Textile - Apparel Clothing
|
$105.83
|
+3.09
3.01% |
$106.24
|
1,366,941
141.68% of 50 DAV
50 DAV is 964,800
|
$107.15
-1.23%
|
2/15/2012
|
$85.77
|
PP = $84.86
|
|
MB = $89.10
|
Most Recent Note - 6/12/2012 12:39:42 PM
G - Hovering near its 52-week and all-time highs today after a negative reversal on the prior session. It was previously noted - "No resistance remains due to overhead supply. Fundamental concerns remain after a slightly sub par earnings increase in the Dec '11 quarter."
>>> The latest Featured Stock Update with an annotated graph appeared on 5/29/2012. Click here.
View all notes |
Alert me of new notes |
CANSLIM.net Company Profile |
SEC |
Zacks Reports |
StockTalk |
News |
Chart |
Request a new note
C
A N
S L
I M
|
VSI
-
NYSE
Vitamin Shoppe Inc
SPECIALTY RETAIL - Specialty Retail, Other
|
$50.67
|
+0.96
1.93% |
$50.72
|
206,368
45.30% of 50 DAV
50 DAV is 455,600
|
$55.29
-8.36%
|
4/25/2012
|
$47.77
|
PP = $48.46
|
|
MB = $50.88
|
Most Recent Note - 6/12/2012 2:35:09 PM
Y - Still quietly consolidating above prior highs in the $48 area and above its 50 DMA line which coincide defining important chart support. Market conditions argue against new buying efforts until a FTD from at least one of the major averages confirms a new rally. Color code was changed to yellow while one may consider a secondary buy point from its successful test of the 10 week average up to +5% above the recent high. Disciplined investors always limit losses by selling if a stock falls more than -7% from their buy price.
>>> The latest Featured Stock Update with an annotated graph appeared on 6/4/2012. Click here.
View all notes |
Alert me of new notes |
CANSLIM.net Company Profile |
SEC |
Zacks Reports |
StockTalk |
News |
Chart |
Request a new note
C
A N
S L
I M
|
WFM
-
NASDAQ
Whole Foods Market Inc
RETAIL - Grocery Stores
|
$91.31
|
+1.55
1.73% |
$91.40
|
1,152,434
65.35% of 50 DAV
50 DAV is 1,763,600
|
$92.00
-0.75%
|
5/3/2012
|
$90.28
|
PP = $86.45
|
|
MB = $90.77
|
Most Recent Note - 6/12/2012 2:37:35 PM
Y - Quietly perched near its 52-week high with no resistance remaining due to overhead supply. Its 50 DMA line defines important near-term support. Confirming gains backed by higher volume, and a FTD from at least one of the major averages would be important and reassuring signs worth watching for.
>>> The latest Featured Stock Update with an annotated graph appeared on 5/11/2012. Click here.
View all notes |
Alert me of new notes |
CANSLIM.net Company Profile |
SEC |
Zacks Reports |
StockTalk |
News |
Chart |
Request a new note
C
A N
S L
I M
|
|
|
|
THESE ARE NOT BUY RECOMMENDATIONS!
Comments contained in the body of this report are technical
opinions only. The material herein has been obtained
from sources believed to be reliable and accurate, however,
its accuracy and completeness cannot be guaranteed.
This site is not an investment advisor, hence it does
not endorse or recommend any securities or other investments.
Any recommendation contained in this report may not
be suitable for all investors and it is not to be deemed
an offer or solicitation on our part with respect to
the purchase or sale of any securities. All trademarks,
service marks and trade names appearing in this report
are the property of their respective owners, and are
likewise used for identification purposes only.
This report is a service available
only to active Paid Premium Members.
You may opt-out of receiving report notifications
at any time. Questions or comments may be submitted
by writing to Premium Membership Services 665 S.E. 10 Street, Suite 201 Deerfield Beach, FL 33441-5634 or by calling 1-800-965-8307
or 954-785-1121.
|
|
|

