You are not logged in.
This means you
CAN ONLY VIEW reports that were published prior to Monday, April 14, 2025.
You
MUST UPGRADE YOUR MEMBERSHIP if you want to see any current reports.
AFTER MARKET UPDATE - TUESDAY, JUNE 11TH, 2013
Previous After Market Report Next After Market Report >>>
|
|
|
|
DOW |
-116.57 |
15,122.02 |
-0.76% |
|
Volume |
689,178,910 |
+16% |
|
Volume |
1,508,502,530 |
+0% |
|
NASDAQ |
-36.82 |
3,436.95 |
-1.06% |
|
Advancers |
399 |
13% |
|
Advancers |
655 |
25% |
|
S&P 500 |
-16.68 |
1,626.13 |
-1.02% |
|
Decliners |
2,696 |
85% |
|
Decliners |
1,837 |
71% |
|
Russell 2000 |
-11.22 |
981.45 |
-1.13% |
|
52 Wk Highs |
38 |
|
|
52 Wk Highs |
93 |
|
|
S&P 600 |
-6.01 |
551.26 |
-1.08% |
|
52 Wk Lows |
267 |
|
|
52 Wk Lows |
41 |
|
|
 |
Indices Fell With Negative Breadth and Expansion in New Lows on NYSE
Kenneth J. Gruneisen - Passed the CAN SLIM® Master's Exam
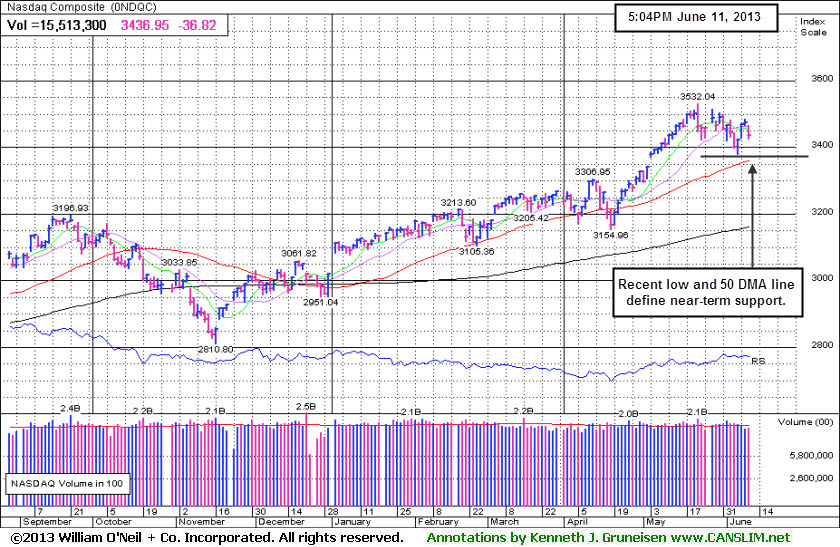
The major averages lost ground on Tuesday's trading session but ended well above the session lows. The volume total was reported higher than the prior session total on the NYSE and volume was very near the prior session total on the Nasdaq exchange. Breadth was negative as decliners led advancers by more than a 6-1 margin on the NYSE and by nearly 3-1 on the Nasdaq exchange. There were 24 high-ranked companies from the CANSLIM.net Leaders List making new 52-week highs and appearing on the CANSLIM.net BreakOuts Page, down from the prior session total of 57 stocks. The number of stocks hitting new 52-week lows swelled and solidly outnumbered new 52-week highs on the NYSE, meanwhile new highs still outnumbered new lows on the Nasdaq exchange. There were losses for 10 of the 11 high-ranked companies currently included on the Featured Stocks Page.
Equities faced pressure from the opening bell as investors responded with caution to the Bank of Japan's uneventful monetary policy meeting. In the US fixed income markets, Treasuries were higher along the curve. The benchmark 10-year note was up 9/32 to yield 2.18% and the 30-year bond added over a full point to yield 3.31%.
All 10 sectors on the S&P finished lower, led by declines in financial stocks including Citigroup Inc (C -3.81%). On the earnings front, Diamond Foods Inc (DMND +9.35%) rallied after the company posted a better-than-expected quarterly profit tally. Shares of Sony Corp (SNE +0.94%) rose as the company released details of their new video game console at the Electronic Entertainment Expo. In other news, athletic apparel maker Lululemon Athletica Inc (LULU -17.5%) fell hard after announcing that the CEO was stepping down following the company's quality control issues earlier in the year.
The market (M criteria) uptrend clearly came under pressure as May drew to a close, and the ongoing weakness is threatening to become a full blown "correction". More damaging losses in the broader market may serve as a reminder for investors to be protective of any gains and to limit losses by being especially watchful for any individual issues flashing technical sell signals. It is vitally important to your success with the fact-based investment system to reduce exposure and preserve cash during market downdrafts.
As always, watch upcoming CANSLIM.net reports for new action-worthy leaders best matching the winning models to be covered as they emerge and then included on the Featured Stocks Page - with our Certified experts' latest notes and links to additional resources including detailed analysis with annotated graphs. The Premium Member Homepage - includes "dynamic archives" to all prior pay reports published. Watch for an announcement via email concerning the next WEBCAST.
PICTURED: The Nasdaq Composite Index's recent low and its 50-day moving average (DMA) line nearly coincide and they now define an important near-term chart support area to watch where any more damaging losses would raise serious concerns.
|
 Kenneth J. Gruneisen started out as a licensed stockbroker in August 1987, a couple of months prior to the historic stock market crash that took the Dow Jones Industrial Average down -22.6% in a single day. He has published daily fact-based fundamental and technical analysis on high-ranked stocks online for two decades. Through FACTBASEDINVESTING.COM, Kenneth provides educational articles, news, market commentary, and other information regarding proven investment systems that work in good times and bad.
Comments contained in the body of this report are technical opinions only and are not necessarily those of Gruneisen Growth Corp. The material herein has been obtained from sources believed to be reliable and accurate, however, its accuracy and completeness cannot be guaranteed. Our firm, employees, and customers may effect transactions, including transactions contrary to any recommendation herein, or have positions in the securities mentioned herein or options with respect thereto. Any recommendation contained in this report may not be suitable for all investors and it is not to be deemed an offer or solicitation on our part with respect to the purchase or sale of any securities. |
|
 |
Gold & Silver, Energy, Tech, and Financial Groups Fell
Kenneth J. Gruneisen - Passed the CAN SLIM® Master's Exam
On Tuesday the Gold & Silver Index ($XAU -3.18%) was a standout decliner and the Oil Services Index ($OSX -1.70%) and the Integrated Oil Index ($XOI -1.17%) both fell on a tough day for commodity-linked groups. Financial related shares also backpedaled as the Bank Index ($BKX -1.65%) and the Broker/Dealer Index ($XBD -1.65%) ended with losses.The Semiconductor Index ($SOX -2.22%), Internet Index ($IIX -1.55%), and Networking Index ($NWX -1.33%) led the tech sector's losses while the Biotechnology Index ($BTK -0.67%) edged lower and the Healthcare Index ($HMO -0.16%) finished the session just slightly in the red.
Charts courtesy www.stockcharts.com
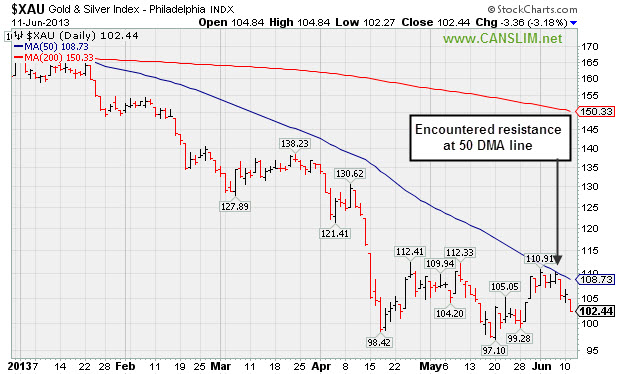
PICTURED: The Gold & Silver Index ($XAU -3.18%) recently encountered resistance at its 50-day moving average (DMA) line when rebounding from its latest lows.
| Oil Services |
$OSX |
252.55 |
-4.38 |
-1.70% |
+14.71% |
| Healthcare |
$HMO |
3,111.48 |
-5.00 |
-0.16% |
+23.76% |
| Integrated Oil |
$XOI |
1,368.33 |
-16.20 |
-1.17% |
+10.19% |
| Semiconductor |
$SOX |
463.43 |
-10.54 |
-2.22% |
+20.67% |
| Networking |
$NWX |
260.74 |
-3.52 |
-1.33% |
+15.09% |
| Internet |
$IIX |
378.49 |
-5.94 |
-1.55% |
+15.75% |
| Broker/Dealer |
$XBD |
124.46 |
-2.08 |
-1.65% |
+31.94% |
| Retail |
$RLX |
787.51 |
-6.12 |
-0.77% |
+20.59% |
| Gold & Silver |
$XAU |
102.44 |
-3.36 |
-3.18% |
-38.14% |
| Bank |
$BKX |
60.91 |
-1.02 |
-1.65% |
+18.78% |
| Biotech |
$BTK |
1,939.53 |
-13.17 |
-0.67% |
+25.37% |
|
|
|
 |
Found Support After Undercutting 50-Day Moving Average
Kenneth J. Gruneisen - Passed the CAN SLIM® Master's Exam
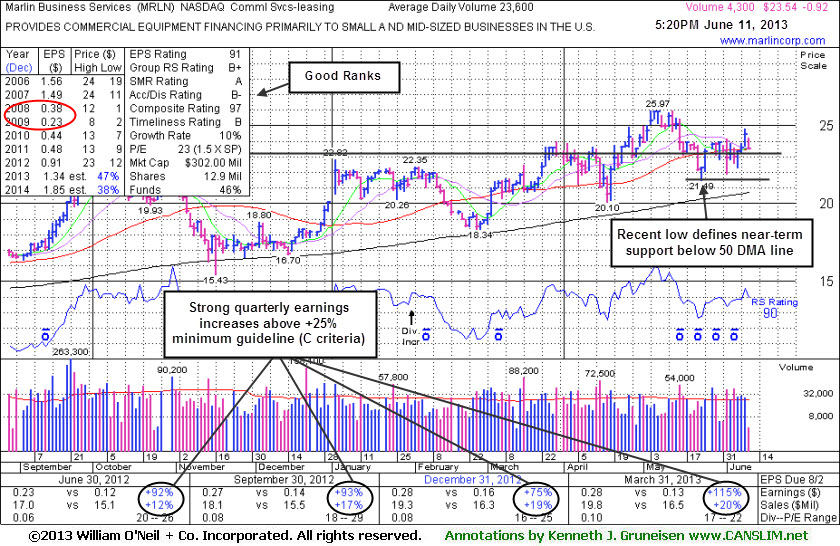
Marlin Business Services (MRLN -$0.92 or -3.76% to $23.54) slumped near its 50-day moving average (DMA) line with a loss today on light volume following 3 consecutive gains. The recent low ($21.49 on 5/23/13) defines important near-term support below that short-term average where a violation would raise more serious concerns. It may be forming a new base pattern, and a subsequent rally above its recent high with great volume conviction could signal the beginning of a more meaningful and sustained rally in price.
MRLN was last seen in this FSU section on 5/23/13 with an annotated graph under the headline, "Shares Did Not Flash Signs of Sufficient Buying Demand for Action Before Latest Slump". Its current Up/Down Volume Ratio of 0.8 is still unbiased bullish indication that its shares have been under distributional pressure over the past 50 days. Recent quarterly comparisons through Mar '13 show strong earnings increases above the +25% minimum guideline satisfying the C criteria. Annual earnings (A criteria) growth has improved following the downturn in FY '08 and '09 (see red circle). The Commercial Services - Leasing group has a B+ Group Relative Strength Rating, a good sign concerning the L criteria. With only 9.26 million shares (S criteria) in the publicly traded float it may be particularly volatile in the event of any institutional buying or selling. The number of top-rated funds owning its shares rose from 111 in Mar '12 to 136 in Mar '13, a reassuring sign concerning the I criteria.
Regardless of any stock's favorable characteristics, disciplined investors always limit losses by selling if the stock falls more than -7% from their purchase price. In this case, taking a small loss might not be necessary if investors heeded the cautionary notes warning that a proper technical buy signal had not occurred in this ideal-looking leader.
|
|
|
Color Codes Explained :
Y - Better candidates highlighted by our
staff of experts.
G - Previously featured
in past reports as yellow but may no longer be buyable under the
guidelines.
***Last / Change / Volume data in this table is the closing quote data***
Symbol/Exchange
Company Name
Industry Group |
PRICE |
CHANGE
(%Change) |
Day High |
Volume
(% DAV)
(% 50 day avg vol) |
52 Wk Hi
% From Hi |
Featured
Date |
Price
Featured |
Pivot Featured |
|
Max Buy |
AL
-
NYSE
Air Lease Corp Cl A
DIVERSIFIED SERVICES - Rental and Leasing Services
|
$27.36
|
-0.24
-0.87% |
$27.60
|
295,064
51.39% of 50 DAV
50 DAV is 574,200
|
$31.00
-11.74%
|
5/9/2013
|
$30.95
|
PP = $29.38
|
|
MB = $30.85
|
Most Recent Note - 6/10/2013 5:45:32 PM
G - Posted a gain today with below average volume and it remains below its 50 DMA line which may now act as resistance. Completed a Secondary Offering on 5/31/13.
>>> The latest Featured Stock Update with an annotated graph appeared on 5/30/2013. Click here.
View all notes |
Alert me of new notes |
CANSLIM.net Company Profile |
SEC |
Zacks Reports |
StockTalk |
News |
Chart |
Request a new note
C
A N
S L
I M


|
AMBA
-
NASDAQ
Ambarella Inc
ELECTRONICS - Semiconductor - Specialized
|
$17.44
|
+0.04
0.23% |
$18.21
|
2,011,606
212.53% of 50 DAV
50 DAV is 946,500
|
$17.90
-2.57%
|
5/6/2013
|
$15.31
|
PP = $16.10
|
|
MB = $16.91
|
 Most Recent Note - 6/11/2013 12:07:34 PM
G - Trading above average volume behind today's 3rd consecutive gain and hitting a new 52-week high. Reported strong earnings and revenues increases for the April '13 quarter. Recent lows and its 50 DMA line ($14.69 now) define important chart support to watch on pullbacks.
>>> The latest Featured Stock Update with an annotated graph appeared on 5/29/2013. Click here.
View all notes |
Alert me of new notes |
CANSLIM.net Company Profile |
SEC |
Zacks Reports |
StockTalk |
News |
Chart |
Request a new note
C
A N
S L
I M
|
EQM
-
NYSE
E Q T Midstream Partners
ENERGY - Oil and Gas Pipelines
|
$46.20
|
-0.77
-1.64% |
$46.76
|
102,395
94.29% of 50 DAV
50 DAV is 108,600
|
$51.72
-10.67%
|
4/25/2013
|
$40.16
|
PP = $40.84
|
|
MB = $42.88
|
Most Recent Note - 6/10/2013 5:41:04 PM
G - Posted its 3rd consecutive gain on light volume since halting its slide well above its 50 DMA line defining important near-term chart support.
>>> The latest Featured Stock Update with an annotated graph appeared on 6/6/2013. Click here.
View all notes |
Alert me of new notes |
CANSLIM.net Company Profile |
SEC |
Zacks Reports |
StockTalk |
News |
Chart |
Request a new note
C
A N
S L
I M
|
FLT
-
NYSE
Fleetcor Technologies
DIVERSIFIED SERVICES - Business/Management Services
|
$87.58
|
-0.52
-0.59% |
$88.22
|
448,825
50.64% of 50 DAV
50 DAV is 886,300
|
$88.83
-1.41%
|
5/29/2013
|
$86.02
|
PP = $85.66
|
|
MB = $89.94
|
Most Recent Note - 6/11/2013 3:50:28 PM
Y- Hovering near its all-time high with volume totals recently cooling. Rose from an advanced "3-weeks tight" base with its 5/29/13 gain on +56% above average volume. It may go on to produce more climactic gains, however this was a riskier "late-stage" base.
>>> The latest Featured Stock Update with an annotated graph appeared on 5/31/2013. Click here.
View all notes |
Alert me of new notes |
CANSLIM.net Company Profile |
SEC |
Zacks Reports |
StockTalk |
News |
Chart |
Request a new note
C
A N
S L
I M
|
LOPE
-
NASDAQ
Grand Canyon Education
DIVERSIFIED SERVICES - Education and; Training Services
|
$32.49
|
-0.13
-0.40% |
$33.10
|
238,656
60.31% of 50 DAV
50 DAV is 395,700
|
$34.07
-4.64%
|
5/10/2013
|
$29.03
|
PP = $27.28
|
|
MB = $28.64
|
Most Recent Note - 6/7/2013 4:11:23 PM
G - Volume totals have been cooling while still holding its ground stubbornly perched at its 52-week high, very extended from its previous base. Prior highs in the $27 area define support to watch on pullbacks. Gains of greater than +20% in the first 2-3 weeks following its "breakaway gap" suggest holding for a minimum of 8 week under the fact-based investment system's rules.
>>> The latest Featured Stock Update with an annotated graph appeared on 6/3/2013. Click here.
View all notes |
Alert me of new notes |
CANSLIM.net Company Profile |
SEC |
Zacks Reports |
StockTalk |
News |
Chart |
Request a new note
C
A N
S L
I M
|
Symbol/Exchange
Company Name
Industry Group |
PRICE |
CHANGE
(%Change) |
Day High |
Volume
(% DAV)
(% 50 day avg vol) |
52 Wk Hi
% From Hi |
Featured
Date |
Price
Featured |
Pivot Featured |
|
Max Buy |
MRLN
-
NASDAQ
Marlin Business Services
DIVERSIFIED SERVICES - Rental and Leasing Services
|
$23.54
|
-0.92
-3.76% |
$24.22
|
4,320
18.31% of 50 DAV
50 DAV is 23,600
|
$25.97
-9.36%
|
3/15/2013
|
$22.29
|
PP = $23.18
|
|
MB = $24.34
|
Most Recent Note - 6/11/2013 3:46:11 PM
Y - Slumping back near its 50 DMA line with a loss today on light volume. The recent low ($21.49 on 5/23/13) defines important near-term support below that short-term average where a violation would raise more serious concerns.
>>> The latest Featured Stock Update with an annotated graph appeared on 6/11/2013. Click here.
View all notes |
Alert me of new notes |
CANSLIM.net Company Profile |
SEC |
Zacks Reports |
StockTalk |
News |
Chart |
Request a new note
C
A N
S L
I M
|
NSM
-
NYSE
Nationstar Mtg Hldgs Inc
FINANCIAL SERVICES - Credit Services
|
$41.79
|
-0.42
-1.00% |
$42.43
|
703,202
59.68% of 50 DAV
50 DAV is 1,178,200
|
$46.91
-10.91%
|
5/7/2013
|
$39.71
|
PP = $42.34
|
|
MB = $44.46
|
Most Recent Note - 6/10/2013 5:43:20 PM
Y - Posted a 3rd consecutive small gain on light volume. Disciplined investors always limit losses if any stock falls more than -7% from their purchase price.
>>> The latest Featured Stock Update with an annotated graph appeared on 5/28/2013. Click here.
View all notes |
Alert me of new notes |
CANSLIM.net Company Profile |
SEC |
Zacks Reports |
StockTalk |
News |
Chart |
Request a new note
C
A N
S L
I M
|
PRAA
-
NASDAQ
Portfolio Recovery Assoc
DIVERSIFIED SERVICES - Business/Management Services
|
$151.90
|
-0.42
-0.28% |
$153.59
|
45,467
63.95% of 50 DAV
50 DAV is 71,100
|
$153.88
-1.29%
|
5/1/2013
|
$130.77
|
PP = $127.88
|
|
MB = $134.27
|
Most Recent Note - 6/10/2013 5:36:19 PM
G - Endured mild distributional pressure last week yet it remains perched near its high holding its ground with no resistance due to overhead supply. Its 50 DMA line defines important chart support. See the latest FSU analysis for more details and a new annotated graph.
>>> The latest Featured Stock Update with an annotated graph appeared on 6/10/2013. Click here.
View all notes |
Alert me of new notes |
CANSLIM.net Company Profile |
SEC |
Zacks Reports |
StockTalk |
News |
Chart |
Request a new note
C
A N
S L
I M
|
PRLB
-
NYSE
Proto Labs Inc
MANUFACTURING - Small Tools and Accessories
|
$54.82
|
-1.33
-2.37% |
$55.64
|
275,646
52.15% of 50 DAV
50 DAV is 528,600
|
$59.84
-8.39%
|
5/3/2013
|
$54.77
|
PP = $54.01
|
|
MB = $56.71
|
Most Recent Note - 6/11/2013 3:44:56 PM
Y - Consolidating above important support at its 50 DMA line with volume totals cooling in recent weeks. A subsequent violation may trigger a technical sell signal.
>>> The latest Featured Stock Update with an annotated graph appeared on 5/24/2013. Click here.
View all notes |
Alert me of new notes |
CANSLIM.net Company Profile |
SEC |
Zacks Reports |
StockTalk |
News |
Chart |
Request a new note
C
A N
S L
I M
|
RRTS
-
NYSE
Roadrunner Trans Systems
TRANSPORTATION - Air Delivery and Freight Service
|
$27.37
|
-1.21
-4.23% |
$27.83
|
462,595
211.52% of 50 DAV
50 DAV is 218,700
|
$28.62
-4.37%
|
4/3/2013
|
$22.77
|
PP = $23.75
|
|
MB = $24.94
|
Most Recent Note - 6/11/2013 12:51:41 PM
G - Up from earlier lows after a gap down today following an analyst downgrade, retreating from a new all-time high hit on the prior session. Fundamental concerns were raised by its sub par earnings increase in the Mar '13 quarter, below the +25% minimum guideline (C criteria).
>>> The latest Featured Stock Update with an annotated graph appeared on 6/4/2013. Click here.
View all notes |
Alert me of new notes |
CANSLIM.net Company Profile |
SEC |
Zacks Reports |
StockTalk |
News |
Chart |
Request a new note
C
A N
S L
I M
|
Symbol/Exchange
Company Name
Industry Group |
PRICE |
CHANGE
(%Change) |
Day High |
Volume
(% DAV)
(% 50 day avg vol) |
52 Wk Hi
% From Hi |
Featured
Date |
Price
Featured |
Pivot Featured |
|
Max Buy |
VRX
-
NYSE
Valeant Pharmaceuticals
DRUGS - Drug Manufacturers - Other
|
$83.77
|
-1.34
-1.57% |
$85.56
|
1,141,127
61.26% of 50 DAV
50 DAV is 1,862,700
|
$96.25
-12.97%
|
4/30/2013
|
$60.24
|
PP = $76.66
|
|
MB = $80.49
|
Most Recent Note - 6/7/2013 5:08:20 PM
G- Rallied since making recent acquisition plans. Support to watch is at prior highs coinciding with its 50 DMA near $76. See latest FSU analysis for more details and a new annotated graph.
>>> The latest Featured Stock Update with an annotated graph appeared on 6/7/2013. Click here.
View all notes |
Alert me of new notes |
CANSLIM.net Company Profile |
SEC |
Zacks Reports |
StockTalk |
News |
Chart |
Request a new note
C
A N
S L
I M
|
|
|
|
THESE ARE NOT BUY RECOMMENDATIONS!
Comments contained in the body of this report are technical
opinions only. The material herein has been obtained
from sources believed to be reliable and accurate, however,
its accuracy and completeness cannot be guaranteed.
This site is not an investment advisor, hence it does
not endorse or recommend any securities or other investments.
Any recommendation contained in this report may not
be suitable for all investors and it is not to be deemed
an offer or solicitation on our part with respect to
the purchase or sale of any securities. All trademarks,
service marks and trade names appearing in this report
are the property of their respective owners, and are
likewise used for identification purposes only.
This report is a service available
only to active Paid Premium Members.
You may opt-out of receiving report notifications
at any time. Questions or comments may be submitted
by writing to Premium Membership Services 665 S.E. 10 Street, Suite 201 Deerfield Beach, FL 33441-5634 or by calling 1-800-965-8307
or 954-785-1121.
|
|
|

