You are not logged in.
This means you
CAN ONLY VIEW reports that were published prior to Monday, April 14, 2025.
You
MUST UPGRADE YOUR MEMBERSHIP if you want to see any current reports.
AFTER MARKET UPDATE - MONDAY, JUNE 11TH, 2012
Previous After Market Report Next After Market Report >>>
|
|
|
|
DOW |
-142.97 |
12,411.23 |
-1.14% |
|
Volume |
740,483,250 |
+8% |
|
Volume |
1,442,812,410 |
+10% |
|
NASDAQ |
-48.69 |
2,809.73 |
-1.70% |
|
Advancers |
619 |
20% |
|
Advancers |
566 |
22% |
|
S&P 500 |
-16.73 |
1,308.93 |
-1.26% |
|
Decliners |
2,457 |
77% |
|
Decliners |
1,931 |
74% |
|
Russell 2000 |
-18.18 |
751.01 |
-2.36% |
|
52 Wk Highs |
80 |
|
|
52 Wk Highs |
64 |
|
|
S&P 600 |
-10.53 |
420.49 |
-2.44% |
|
52 Wk Lows |
49 |
|
|
52 Wk Lows |
45 |
|
|
 |
Major Average Reversed Early Gains For Losses on Higher Volume
Kenneth J. Gruneisen - Passed the CAN SLIM® Master's Exam
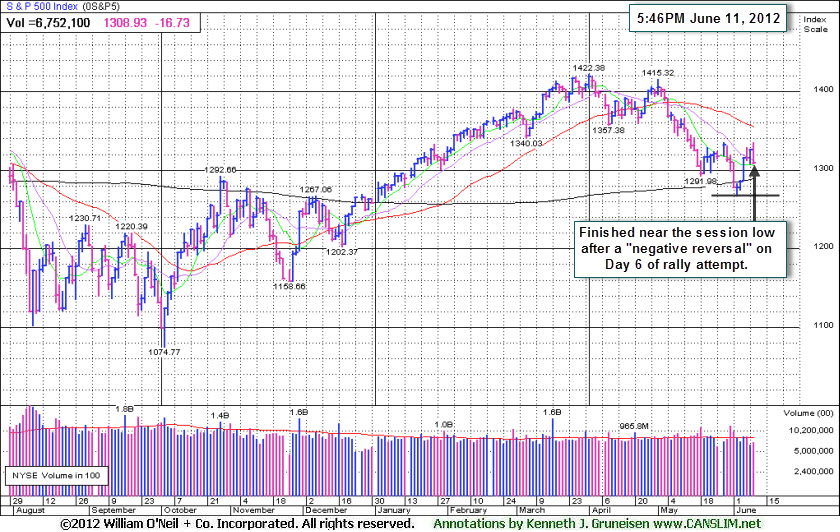
The major averages erased early gains and finished with losses after negative reversals on Monday's session. Higher volume totals were reported on the Nasdaq exchange and on the NYSE, an indication that the institutional crowd was selling shares. Breadth was negative as decliners led advancers by nearly a 4-1 ratio on the NYSE and on the Nasdaq exchange. The total number of new 52-week highs still outnumbered new 52-week lows on the NYSE and on the Nasdaq exchange for a 4th consecutive session. There were 41 high-ranked companies from the CANSLIM.net Leaders List made new 52-week highs and appeared on the CANSLIM.net BreakOuts Page, up from the prior session total of 33 stocks. At Monday's close there were gains for only 2 of the 15 high-ranked companies currently included on the Featured Stocks Page.
Stocks retreated from their opening highs as investors turned their attention from Spain's bailout and looked toward the upcoming Greek elections. Next week's voting will set the stage for the fate of Greece as a member of the common currency region.
Nine of the 10 sectors on the S&P finished in the red, led by steep declines in financials. Bank of America Corp (BAC -3.70%) and Citigroup Inc (C -4.75%) fell. Tech stocks were also under pressure. Shares of Apple Inc (AAPL -1.58%) reversed an early gain and fell after new details surrounding the company's revamped Macbook failed to excite investors at the Worldwide Developers Conference. In other news, AK Steel Holding Corp (AKS -13.97%) sank following an analyst downgrade that cited gloomy industry fundamentals. Also in the space, U.S. Steel Corp (X -6.48%) shed in the sympathy trade.
Turning to bondland, Treasuries were higher along the curve. The benchmark 10-year note added 3/8 of a point to yield 1.60% and the 30-year bond rose 1/2 of a point to yield 2.72%.
Technically, the big gains by the major averages on Wednesday's session were too soon (Day 3) in the nascent rally attempt to be considered a valid follow-through day (FTD). The expansion in leadership (new highs) and the major indices' rebounds above their respective 200-day moving average (DMA) lines with gains on higher volume were encouraging signs.
The major averages (M criteria) are technically still considered to be in a rally attempt within an ongoing correction, and stocks may still be vulnerable to greater downside. Historical studies suggest that the most constructive market rallies produced a solid follow-through day (FTD) between Days 4-7 of a new rally effort. Gains of +1.4% or greater by at least one of the major indexes should be backed by higher volume (preferably above average volume) coupled with an expansion in the number of stocks hitting new highs. Only fresh technical proof may give fact-based investors the clearance to begin with new buying efforts strictly in sound buy candidates. Meanwhile, investors should keep up a watchlist of worthy buy candidates while remaining protective of capital.
PICTURED: The S&P 500 Index reversed early gains and ended lower on Monday's session, marking Day 6 of its latest rally attempt without a confirming FTD of solid gains on higher volume. Unless the "Day 1" lows are violated the rally attempt still remains valid. Notice that the benchmark index also has a downward sloping 50-day moving average (DMA) line. When that short-term average has a downward slope it is fair to say the market has been struggling for a while, and disciplined investors following the fact-based investment system have likely moved much of their cash to the sidelines. This tactical approach reduces stress and protects precious capital during bearish market environments. This also helps to preserve investors' confidence so they are ready to act when a new confirmed rally eventually presents itself while less experienced investors might still be nursing their wounds.
|
 Kenneth J. Gruneisen started out as a licensed stockbroker in August 1987, a couple of months prior to the historic stock market crash that took the Dow Jones Industrial Average down -22.6% in a single day. He has published daily fact-based fundamental and technical analysis on high-ranked stocks online for two decades. Through FACTBASEDINVESTING.COM, Kenneth provides educational articles, news, market commentary, and other information regarding proven investment systems that work in good times and bad.
Comments contained in the body of this report are technical opinions only and are not necessarily those of Gruneisen Growth Corp. The material herein has been obtained from sources believed to be reliable and accurate, however, its accuracy and completeness cannot be guaranteed. Our firm, employees, and customers may effect transactions, including transactions contrary to any recommendation herein, or have positions in the securities mentioned herein or options with respect thereto. Any recommendation contained in this report may not be suitable for all investors and it is not to be deemed an offer or solicitation on our part with respect to the purchase or sale of any securities. |
|
 |
Healthcare, Financial, Tech, Retail, and Commodity-Linked Indexes Fell
Kenneth J. Gruneisen - Passed the CAN SLIM® Master's Exam
The Healthcare Index ($HMO -4.35%) was a standout decliner on Monday. The Retail Index ($RLX -1.54%) fell, and weakness in financial stocks was a negative influence on the major averages as the Bank Index ($BKX -2.29%) and Broker/Dealer Index ($XBD -1.58%) fell. The tech sector saw unanimous losses from the Networking Index ($NWX -2.67%), Biotechnology Index ($BTK -1.91%), Semiconductor Index ($SOX -1.89%), and the Internet Index ($IIX -1.83%). Commodity-linked groups also slumped as the Gold & Silver Index ($XAU -1.67%), Oil Services Index ($OSX -1.86%), and Integrated Oil Index ($XOI -1.07%) ended with losses.
Charts courtesy www.stockcharts.com
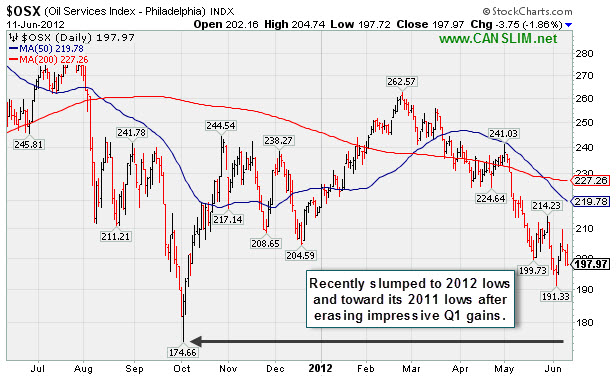
PICTURED: The Oil Services Index ($OSX -1.86%) recently slumped to new 2012 lows and toward its 2011 lows after erasing impressive Q1 gains.
| Oil Services |
$OSX |
197.97 |
-3.75 |
-1.86% |
-8.47% |
| Healthcare |
$HMO |
2,204.97 |
-100.19 |
-4.35% |
-3.36% |
| Integrated Oil |
$XOI |
1,113.14 |
-12.09 |
-1.07% |
-9.43% |
| Semiconductor |
$SOX |
365.69 |
-7.04 |
-1.89% |
+0.34% |
| Networking |
$NWX |
204.07 |
-5.60 |
-2.67% |
-5.15% |
| Internet |
$IIX |
293.98 |
-5.50 |
-1.83% |
+4.35% |
| Broker/Dealer |
$XBD |
84.51 |
-1.36 |
-1.58% |
+1.49% |
| Retail |
$RLX |
603.96 |
-9.43 |
-1.54% |
+15.44% |
| Gold & Silver |
$XAU |
159.40 |
-2.70 |
-1.67% |
-11.76% |
| Bank |
$BKX |
42.61 |
-1.00 |
-2.29% |
+8.20% |
| Biotech |
$BTK |
1,389.19 |
-27.00 |
-1.91% |
+27.28% |
|
|
|
 |
New Pivot Point Cited as Resilient Leader Challenges Highs
Kenneth J. Gruneisen - Passed the CAN SLIM® Master's Exam
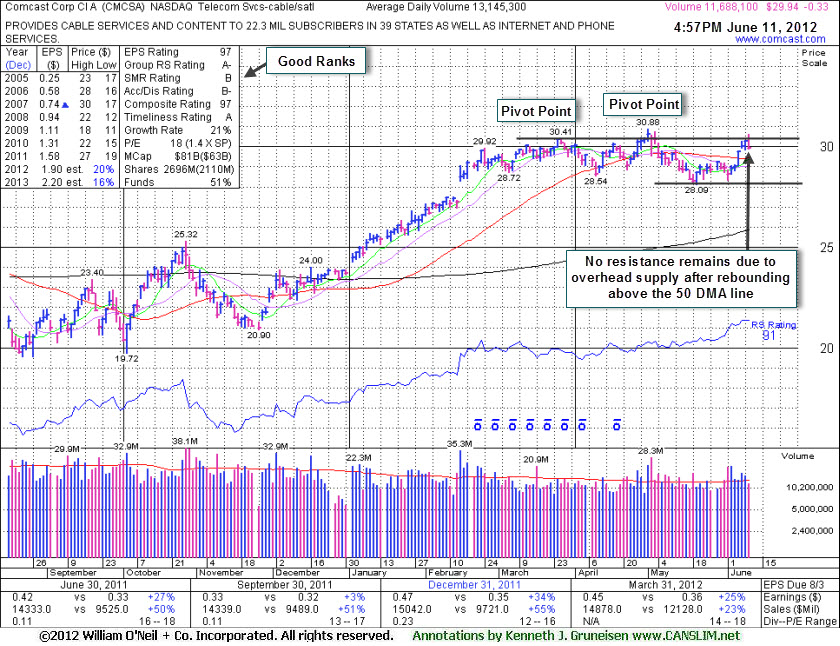
Comcast Corp Cl A (CMCSA -$0.33 or -1.09% to $29.94) ended lower today on lighter volume following a streak of 5 consecutive gains that helped it rally above its 50-day moving average (DMA) line and improved its technical stance. A new pivot point is being cited based on its 5/01/12 high plus 10 cents. New buying efforts may only be justified under the fact-based system if the stock triggers a new technical buy signal and a confirmation day (follow-through day) also signals that the broader market has resumed an upward trend. The prior low ($28.09 on 5/21/12) defines important near-term support to watch where further deterioration would raise more serious concerns.
Its last appearance in this FSU section with an annotated daily graph was on 5/07/12 under the headline, "Hovering Near 52-week High After Another Good Earnings Report", while holding its ground near its 50-day moving average (DMA) line. Subsequent losses below its prior low ($28.54 on 4/10/12) raised additional concerns and triggered a technical sell signal. Healthy stocks do not usually slump more than -7% below their pivot point in a bullish market environment. In this case the market slumped into a correction, and the stock slumped more than -7% below the pivot point. Keep in mind that 3 out of 4 stocks follow along in the direction of the major averages (M criteria). It recently reported earnings +25% on +23% sales for the quarter ended March 31, 2012 versus the year ago period. The 3 prior quarterly comparisons (through Dec '11) showed sales revenues increases above the year ago periods by +50%, and earnings increases were above the +25% guideline (C criteria) in 3 of the past 4 comparisons. Its annual earnings (A criteria) history has been strong.
The number of top-rated funds owning its shares rose from 1,916 in Jun '11 to 2,031 in Mar '12, a reassuring sign concerning the I criteria. Leadership from other firms in the Telecom Services - Cable/Satellite industry group is a reassuring sign concerning the L criteria. Its huge supply of 2.088 billion shares in the float could make it less likely to be a great sprinter, meanwhile, the S criteria calls for investors to usually look at small-cap or mid-cap companies.
|
|
|
Color Codes Explained :
Y - Better candidates highlighted by our
staff of experts.
G - Previously featured
in past reports as yellow but may no longer be buyable under the
guidelines.
***Last / Change / Volume data in this table is the closing quote data***
Symbol/Exchange
Company Name
Industry Group |
PRICE |
CHANGE
(%Change) |
Day High |
Volume
(% DAV)
(% 50 day avg vol) |
52 Wk Hi
% From Hi |
Featured
Date |
Price
Featured |
Pivot Featured |
|
Max Buy |
ALXN
-
NASDAQ
Alexion Pharmaceuticals
DRUGS - Drug Manufacturers - Other
|
$90.45
|
-1.98
-2.14% |
$92.98
|
1,356,465
67.59% of 50 DAV
50 DAV is 2,006,800
|
$95.01
-4.80%
|
5/1/2012
|
$91.73
|
PP = $95.11
|
|
MB = $99.87
|
Most Recent Note - 6/6/2012 6:18:47 PM
Y - Color code is changed to yellow after a 3rd consecutive gain today backed by light volume helped it rebound above its 50 DMA line. No new pivot point is being cited, and it faces near-term resistance in the $94-95 area.
>>> The latest Featured Stock Update with an annotated graph appeared on 5/31/2012. Click here.
View all notes |
Alert me of new notes |
CANSLIM.net Company Profile |
SEC |
Zacks Reports |
StockTalk |
News |
Chart |
Request a new note
C
A N
S L
I M


|
ASPS
-
NASDAQ
Altisource Ptf Sltns Sa
REAL ESTATE - Property Management/Developmen
|
$65.49
|
+0.55
0.85% |
$66.37
|
115,647
86.11% of 50 DAV
50 DAV is 134,300
|
$66.51
-1.53%
|
6/5/2012
|
$60.01
|
PP = $63.00
|
|
MB = $66.15
|
Most Recent Note - 6/6/2012 6:11:51 PM
Y - Today's 3rd consecutive gain backed by +55% above average volume helped it rally above the pivot point cited based on its 4/26/12 high. Technically it triggered a buy signal, however the major averages (M criteria) also need to confirm a new rally with a solid follow-through day before any new buying efforts are justified under the fact-based investment system.
>>> The latest Featured Stock Update with an annotated graph appeared on 6/5/2012. Click here.
View all notes |
Alert me of new notes |
CANSLIM.net Company Profile |
SEC |
Zacks Reports |
StockTalk |
News |
Chart |
Request a new note
C
A N
S L
I M
|
CERN
-
NASDAQ
Cerner Corp
COMPUTER SOFTWARE and SERVICES - Healthcare Information Service
|
$77.88
|
-1.07
-1.36% |
$79.85
|
1,102,951
88.00% of 50 DAV
50 DAV is 1,253,300
|
$84.10
-7.40%
|
6/7/2012
|
$78.36
|
PP = $84.20
|
|
MB = $88.41
|
Most Recent Note - 6/7/2012 6:17:43 PM
Y - It has been encountering distributional pressure and the M criteria requires a FTD before any new buying efforts may be considered under the investment system's guidelines. Color code was changed to yellow and a new pivot point has been cited based on its 5/01/12 high plus 10 cents. Volume-driven gains are needed to trigger a new (or add-on) technical buy signal. See the latest FSU analysis for more details and a new annotated weekly graph.
>>> The latest Featured Stock Update with an annotated graph appeared on 6/7/2012. Click here.
View all notes |
Alert me of new notes |
CANSLIM.net Company Profile |
SEC |
Zacks Reports |
StockTalk |
News |
Chart |
Request a new note
C
A N
S L
I M
|
CMCSA
-
NASDAQ
Comcast Corp Cl A
MEDIA - CATV Systems
|
$29.94
|
-0.33
-1.09% |
$30.60
|
11,870,119
90.30% of 50 DAV
50 DAV is 13,145,300
|
$30.88
-3.03%
|
6/11/2012
|
$29.94
|
PP = $30.98
|
|
MB = $32.53
|
 Most Recent Note - 6/11/2012 5:18:56 PM
Y - Challenged its 52-week high today then ended lower after 5 consecutive gains. New pivot point is cited based on its 5/01/12 high plus 10 cents. The prior low ($28.09 on 5/21/12) defines important near-term support to watch. See the latest FSU analysis for more details and a new annotated graph.
>>> The latest Featured Stock Update with an annotated graph appeared on 6/11/2012. Click here.
View all notes |
Alert me of new notes |
CANSLIM.net Company Profile |
SEC |
Zacks Reports |
StockTalk |
News |
Chart |
Request a new note
C
A N
S L
I M
|
COO
-
NYSE
Cooper Companies Inc
HEALTH SERVICES - Medical Instruments and Supplies
|
$78.03
|
-0.79
-1.00% |
$79.36
|
1,065,551
203.78% of 50 DAV
50 DAV is 522,900
|
$89.31
-12.63%
|
3/9/2012
|
$83.05
|
PP = $81.02
|
|
MB = $85.07
|
Most Recent Note - 6/11/2012 4:54:20 PM
Reported earnings +10% on +6% sales revenues for the quarter ended April 30, 2012, below the +25% minimum earnings guideline. Found support at its 200 DMA line. Faces resistance due to overhead supply up through the $89 area after a damaging streak of losses recently triggered sell signals. It will be dropped from the Featured Stocks list tonight based on recent fundamental and technical deterioration.
>>> The latest Featured Stock Update with an annotated graph appeared on 5/18/2012. Click here.
View all notes |
Alert me of new notes |
CANSLIM.net Company Profile |
SEC |
Zacks Reports |
StockTalk |
News |
Chart |
Request a new note
C
A N
S L
I M
|
Symbol/Exchange
Company Name
Industry Group |
PRICE |
CHANGE
(%Change) |
Day High |
Volume
(% DAV)
(% 50 day avg vol) |
52 Wk Hi
% From Hi |
Featured
Date |
Price
Featured |
Pivot Featured |
|
Max Buy |
DG
-
NYSE
Dollar General Corp
RETAIL - Discount, Variety Stores
|
$50.18
|
-0.11
-0.22% |
$50.75
|
3,886,158
123.02% of 50 DAV
50 DAV is 3,158,900
|
$50.75
-1.12%
|
5/7/2012
|
$48.51
|
PP = $47.69
|
|
MB = $50.07
|
Most Recent Note - 6/7/2012 12:06:45 PM
G - Found support near its 50 DMA line and today it is perched at its 52-week and all-time highs. Completed another Secondary Offering on 6/05/12, its 4th Secondary Offering since September '11. Reported earnings +31% on +13% sales revenues for the quarter ended April 30, 2012 versus the year ago period. The broader market (M criteria) has yet to confirm a new rally, however, and without a solid follow-through day from at least one of the major averages all new buying efforts are discouraged under the fact-based investment system.
>>> The latest Featured Stock Update with an annotated graph appeared on 5/9/2012. Click here.
View all notes |
Alert me of new notes |
CANSLIM.net Company Profile |
SEC |
Zacks Reports |
StockTalk |
News |
Chart |
Request a new note
C
A N
S L
I M
|
EXPE
-
NASDAQ
Expedia Inc
INTERNET - Internet Information Providers
|
$48.02
|
+0.17
0.36% |
$48.79
|
3,978,941
88.42% of 50 DAV
50 DAV is 4,500,200
|
$48.06
-0.08%
|
4/27/2012
|
$41.80
|
PP = $35.57
|
|
MB = $37.35
|
Most Recent Note - 6/8/2012 5:51:50 PM
G - Hit another new 52-week high today with a gain backed by below average volume, getting more extended from its prior highs in the $43 area. See the latest FSU analysis for more details and a new annotated graph.
>>> The latest Featured Stock Update with an annotated graph appeared on 6/8/2012. Click here.
View all notes |
Alert me of new notes |
CANSLIM.net Company Profile |
SEC |
Zacks Reports |
StockTalk |
News |
Chart |
Request a new note
C
A N
S L
I M
|
GNC
-
NYSE
G N C Holdings Inc
RETAIL - Drug Stores
|
$37.57
|
-0.52
-1.37% |
$38.95
|
1,008,107
53.27% of 50 DAV
50 DAV is 1,892,600
|
$41.95
-10.44%
|
1/19/2012
|
$28.99
|
PP = $29.60
|
|
MB = $31.08
|
Most Recent Note - 6/8/2012 5:56:44 PM
G - Posted a gain today on below average volume, fighting to stay above its 50 DMA line. Recent lows define important near-term support while it could be forming a "double bottom" base.
>>> The latest Featured Stock Update with an annotated graph appeared on 6/6/2012. Click here.
View all notes |
Alert me of new notes |
CANSLIM.net Company Profile |
SEC |
Zacks Reports |
StockTalk |
News |
Chart |
Request a new note
C
A N
S L
I M
|
NTES
-
NASDAQ
Netease Inc Adr
INTERNET - Internet Information Providers
|
$61.80
|
-0.82
-1.31% |
$64.00
|
403,946
55.92% of 50 DAV
50 DAV is 722,400
|
$65.54
-5.71%
|
3/19/2012
|
$56.18
|
PP = $55.10
|
|
MB = $57.86
|
Most Recent Note - 6/6/2012 5:03:49 PM
G - Rallied with above average volume to a new 52-week high today. It had not formed a sound base pattern. Recent lows near the $55 area define important chart support to watch where a violation may trigger a worrisome technical sell signal.
>>> The latest Featured Stock Update with an annotated graph appeared on 5/24/2012. Click here.
View all notes |
Alert me of new notes |
CANSLIM.net Company Profile |
SEC |
Zacks Reports |
StockTalk |
News |
Chart |
Request a new note
C
A N
S L
I M
|
SWI
-
NYSE
Solarwinds Inc
COMPUTER SOFTWARE and SERVICES - Application Software
|
$43.11
|
-1.39
-3.12% |
$45.05
|
853,165
80.69% of 50 DAV
50 DAV is 1,057,400
|
$48.64
-11.37%
|
4/26/2012
|
$45.15
|
PP = $42.32
|
|
MB = $44.44
|
Most Recent Note - 6/11/2012 4:50:47 PM
G - Slumped back toward its 50 DMA line and finished near the session low with a loss today on higher but below average volume. A damaging violation of that short-term average and the 6/04/11 low ($41.24) would trigger a more worrisome technical sell signals.
>>> The latest Featured Stock Update with an annotated graph appeared on 5/21/2012. Click here.
View all notes |
Alert me of new notes |
CANSLIM.net Company Profile |
SEC |
Zacks Reports |
StockTalk |
News |
Chart |
Request a new note
C
A N
S L
I M
|
Symbol/Exchange
Company Name
Industry Group |
PRICE |
CHANGE
(%Change) |
Day High |
Volume
(% DAV)
(% 50 day avg vol) |
52 Wk Hi
% From Hi |
Featured
Date |
Price
Featured |
Pivot Featured |
|
Max Buy |
SXCI
-
NASDAQ
S X C Health Solutions
COMPUTER SOFTWARE and SERVICES - Healthcare Information Service
|
$90.65
|
-3.19
-3.40% |
$95.00
|
694,823
56.79% of 50 DAV
50 DAV is 1,223,400
|
$100.50
-9.80%
|
2/23/2012
|
$68.24
|
PP = $66.05
|
|
MB = $69.35
|
Most Recent Note - 6/11/2012 4:48:19 PM
G - Closed near the session low today with a loss on below average volume. Its 50 DMA line defines important support for chart readers. Completed a new Public Offering on 5/10/12. It may be forming a new base, however the M criteria argues against new buying efforts without a confirmed rally with a solid FTD from at least one of the major averages.
>>> The latest Featured Stock Update with an annotated graph appeared on 5/17/2012. Click here.
View all notes |
Alert me of new notes |
CANSLIM.net Company Profile |
SEC |
Zacks Reports |
StockTalk |
News |
Chart |
Request a new note
C
A N
S L
I M
|
TDG
-
NYSE
Transdigm Group Inc
AEROSPACE/DEFENSE - Aerospace/Defense Products and; Services
|
$126.08
|
-1.06
-0.83% |
$128.86
|
495,484
92.89% of 50 DAV
50 DAV is 533,400
|
$132.69
-4.98%
|
2/29/2012
|
$120.10
|
PP = $118.93
|
|
MB = $124.88
|
Most Recent Note - 6/6/2012 6:00:26 PM
G - Considerable gain today on near average volume, rallying from important support at its 50 DMA line. Its prior low ($118.43 on 5/18/12) defines the next important near-term chart support level to watch.
>>> The latest Featured Stock Update with an annotated graph appeared on 5/23/2012. Click here.
View all notes |
Alert me of new notes |
CANSLIM.net Company Profile |
SEC |
Zacks Reports |
StockTalk |
News |
Chart |
Request a new note
C
A N
S L
I M
|
UA
-
NYSE
Under Armour Inc Cl A
CONSUMER NON-DURABLES - Textile - Apparel Clothing
|
$102.74
|
-0.57
-0.55% |
$107.15
|
1,744,005
182.56% of 50 DAV
50 DAV is 955,300
|
$103.32
-0.56%
|
2/15/2012
|
$85.77
|
PP = $84.86
|
|
MB = $89.10
|
Most Recent Note - 6/11/2012 4:57:24 PM
G - Started with gains for new 52-week and all-time highs today then finished with a small loss on above average volume after a negative reversal. Following a strong finish on the prior session it was previously noted - "No resistance remains due to overhead supply. Fundamental concerns remain after a slightly sub par earnings increase in the Dec '11 quarter."
>>> The latest Featured Stock Update with an annotated graph appeared on 5/29/2012. Click here.
View all notes |
Alert me of new notes |
CANSLIM.net Company Profile |
SEC |
Zacks Reports |
StockTalk |
News |
Chart |
Request a new note
C
A N
S L
I M
|
VSI
-
NYSE
Vitamin Shoppe Inc
SPECIALTY RETAIL - Specialty Retail, Other
|
$49.71
|
-0.94
-1.86% |
$51.33
|
175,616
38.48% of 50 DAV
50 DAV is 456,400
|
$55.29
-10.09%
|
4/25/2012
|
$47.77
|
PP = $48.46
|
|
MB = $50.88
|
Most Recent Note - 6/7/2012 3:41:43 PM
Y - Quietly consolidating above prior highs in the $48 area which define important chart support. Market conditions argue against new buying efforts until a FTD from at least one of the major averages confirms a new rally. Color code is changed to yellow while one may consider a secondary buy point from its successful test of the 10 week average up to +5% above the recent high. Disciplined investors always limit losses by selling if a stock falls more than -7% from their buy price.
>>> The latest Featured Stock Update with an annotated graph appeared on 6/4/2012. Click here.
View all notes |
Alert me of new notes |
CANSLIM.net Company Profile |
SEC |
Zacks Reports |
StockTalk |
News |
Chart |
Request a new note
C
A N
S L
I M
|
WFM
-
NASDAQ
Whole Foods Market Inc
RETAIL - Grocery Stores
|
$89.76
|
-1.17
-1.29% |
$92.00
|
1,515,423
84.34% of 50 DAV
50 DAV is 1,796,900
|
$91.50
-1.90%
|
5/3/2012
|
$90.28
|
PP = $86.45
|
|
MB = $90.77
|
Most Recent Note - 6/6/2012 6:14:17 PM
Y - Today's gain on average volume led to a best-ever close near its 52-week high. Color code was changed to yellow based on recent resilience while no new pivot point was cited. The high-ranked Retail - Super/Mini Markets firm found prompt support near its 50 DMA line after damaging losses negated the latest technical breakout. Confirming gains backed by higher volume, and a FTD from at least one of the major averages would be important and reassuring signs worth watching for.
>>> The latest Featured Stock Update with an annotated graph appeared on 5/11/2012. Click here.
View all notes |
Alert me of new notes |
CANSLIM.net Company Profile |
SEC |
Zacks Reports |
StockTalk |
News |
Chart |
Request a new note
C
A N
S L
I M
|
Symbol/Exchange
Company Name
Industry Group |
PRICE |
CHANGE
(%Change) |
Day High |
Volume
(% DAV)
(% 50 day avg vol) |
52 Wk Hi
% From Hi |
Featured
Date |
Price
Featured |
Pivot Featured |
|
Max Buy |
|
|
|
THESE ARE NOT BUY RECOMMENDATIONS!
Comments contained in the body of this report are technical
opinions only. The material herein has been obtained
from sources believed to be reliable and accurate, however,
its accuracy and completeness cannot be guaranteed.
This site is not an investment advisor, hence it does
not endorse or recommend any securities or other investments.
Any recommendation contained in this report may not
be suitable for all investors and it is not to be deemed
an offer or solicitation on our part with respect to
the purchase or sale of any securities. All trademarks,
service marks and trade names appearing in this report
are the property of their respective owners, and are
likewise used for identification purposes only.
This report is a service available
only to active Paid Premium Members.
You may opt-out of receiving report notifications
at any time. Questions or comments may be submitted
by writing to Premium Membership Services 665 S.E. 10 Street, Suite 201 Deerfield Beach, FL 33441-5634 or by calling 1-800-965-8307
or 954-785-1121.
|
|
|

