You are not logged in.
This means you
CAN ONLY VIEW reports that were published prior to Monday, April 14, 2025.
You
MUST UPGRADE YOUR MEMBERSHIP if you want to see any current reports.
AFTER MARKET UPDATE - FRIDAY, JUNE 11TH, 2010
Previous After Market Report Next After Market Report >>>
|
|
|
|
DOW |
+38.54 |
10,211.07 |
+0.38% |
|
Volume |
1,042,183,410 |
-22% |
|
Volume |
1,776,019,010 |
-15% |
|
NASDAQ |
+24.58 |
2,243.29 |
+1.11% |
|
Advancers |
2,075 |
66% |
|
Advancers |
1,901 |
69% |
|
S&P 500 |
+4.76 |
1,091.60 |
+0.44% |
|
Decliners |
961 |
30% |
|
Decliners |
758 |
27% |
|
Russell 2000 |
+9.21 |
649.00 |
+1.44% |
|
52 Wk Highs |
43 |
|
|
52 Wk Highs |
40 |
|
|
S&P 600 |
+4.59 |
346.87 |
+1.34% |
|
52 Wk Lows |
13 |
|
|
52 Wk Lows |
38 |
|
|
 |
Major Averages Lack Volume Conviction Behind Latest Gains
Adam Sarhan, Contributing Writer,
It was another volatile week on Wall Street as investors digested a slew of economic data. Stocks edged higher on Friday as volume totals cooled compared to Thursday's levels on both major exchanges. Advancers led decliners by over a 2-to-1 ratio on the NYSE and the Nasdaq exchange. There were 19 high-ranked companies from the CANSLIM.net Leaders List that made a new 52-week high and appeared on the CANSLIM.net BreakOuts Page, higher than the 12 issues that appeared on the prior session. New 52-week highs outnumbered new 52-week lows on the NYSE and on the Nasdaq exchange.

Stocks negatively reversed on Monday (opened higher but closed lower) as the euro slid to a fresh 4-year low. The selling continued in the aftermath of Friday's dismal jobs report. Goldman Sachs (GS +1.40%) got smacked after it received a subpoena from the Financial Crisis Inquiry Commission (FCIS) due to its failure to comply with requests for documents. Stocks finished mixed on Tuesday after Fed Chairman Ben Bernanke said he does not expect a "double dip" recession in the US.The Dow Jones Industrial Average, Nasdaq Composite, and small-cap Russell 2000 indexes all traded below their May 25, 2010 lows while the benchmark S&P 500 Index came within 2 points of last month's low. So far, support near prior chart lows has been tested and appears to have held, but any further deterioration would suggest that another leg lower may follow.
On Wednesday, stocks negatively reversed after the Federal Reserve released its Beige Book. The Fed survey said economic growth was "modest" which worried investors. The Beige Book which is published two weeks before a Fed meeting said, "Economic activity continued to improve since the last report across all 12 Federal Reserve Districts, although many Districts described the pace of growth as ‘modest.’” The bulls showed up and stocks soaring on Thursday as the euro bounced from a 4 year low. However, volume, an important indicator of institutional sponsorship, was reported lighter than Wednesday's levels on both major exchanges which prevented the S&P 500 from scoring a follow-through day (FTD) and suggested large institutions were not aggressively buying stocks.
Overnight, stocks in Asia rose after a slew of healthy economic reports were released from China, Japan and Australia. The latest data showed accelerating economic growth which was a welcoming sign from that region. Chinese exports surged to a six year high which helped reaffirm the notion that the world's fastest-growing major economy will continue to fuel the global recovery. Japan's GDP rose at an annualized +5% rate in the first quarter and Australia's non-farm payrolls report rose for a third consecutive month. In the US, weekly jobless claims fell while the trade deficit widened to the highest level in a year as exports fell. All this, sent the US dollar lower and a host of dollar denominated assets higher (mainly stocks and commodities) as these markets work off their deeply oversold levels. Stocks ended higher on Friday as the major averages consolidated a very volatile week and a lackluster read on retail sales.
The benchmark S&P 500 Index marked Day 13 of its current rally attempt while narrowly avoiding undercutting its 5/25/10 low thus far but failed to score a proper FTD due to the light volume that accompanied Thursday’s strong move. The Dow Jones Industrial Average marked Day 4 of its latest rally attempt while the Nasdaq Composite marked Day 2. It is well known that a market should not be considered "healthy" unless it trades above its rising 200-day moving average (DMA) line. The fact that all the major averages are below both their 50 & 200 DMA lines bodes poorly for the near term. That said, the bears will likely remain in control until the popular averages close above their important moving averages. Remember, we have often seen these light volume rallies in the past fail a few days later. Trade accordingly.
Are You Frustrated With The Market?
Inquire Today About Our Professional Money Management Services:
If your portfolio is greater than $100,000 and you would like a free portfolio review, click here to get connected with one of our portfolio managers. ** Serious inquires only, please.
PICTURED: The Dow Jones Industrial Average remains below its 200 DMA line after Day 4 of a new rally attempt.
|
|
|
 |
Financial Indexes Giving Mixed Indications On Outlook
Kenneth J. Gruneisen - Passed the CAN SLIM® Master's Exam
Strength in the tech sector helped the Nasdaq Composite Index outpace its peers on Friday as the Networking Index ($NWX +1.34%), Semiconductor Index ($SOX +1.40%), Biotechnology Index ($BTK +1.76%), and Internet Index ($IIX +1.05%) set a positive pace. Strength in energy-related shares gave the Integrated Oil Index ($XOI +1.26%) and Oil Services Index ($OSX +0.76%) a boost. Defensive groups provided smaller gains as the Gold & Silver Index ($XAU +0.18%) and Healthcare Index ($HMO +0.28%) edged higher. The Broker/Dealer Index ($XBD +0.84%) posted a modest gain while the Bank Index ($BKX +0.02%) held its ground and the Retail Index ($RLX -0.23%) edged lower.
Charts courtesy www.stockcharts.com
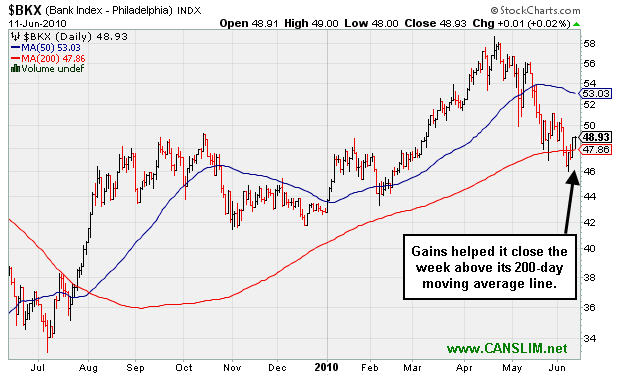
PICTURED 1: The Bank Index ($BKX +0.02%) gains helped it close the week above its 200-day moving average (DMA) line. The action in the group will continue to play a key role as a forward looking indicator. Subsequent deterioration would bode poorly for the market outlook, with respect to the M criteria. For now, the BKX finding support at its 200 DMA is an encouraging sign.
Charts courtesy www.stockcharts.com
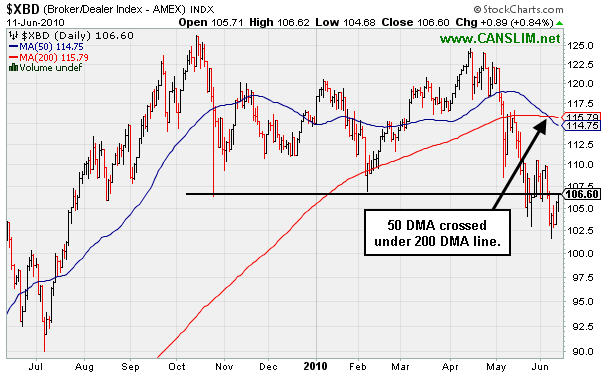
PICTURED 2: The Broker/Dealer Index ($XBD +0.84%) is weak and faces a lot of resistance. After undercutting prior chart lows, its 50-day moving average (DMA) line undercut the longer-term 200 DMA line.
| Oil Services |
$OSX |
174.05 |
+1.32 |
+0.76% |
-10.71% |
| Healthcare |
$HMO |
1,505.86 |
+4.22 |
+0.28% |
+2.24% |
| Integrated Oil |
$XOI |
944.58 |
+11.76 |
+1.26% |
-11.57% |
| Semiconductor |
$SOX |
349.53 |
+4.84 |
+1.40% |
-2.88% |
| Networking |
$NWX |
231.52 |
+3.06 |
+1.34% |
+0.20% |
| Internet |
$IIX |
238.29 |
+2.48 |
+1.05% |
+1.89% |
| Broker/Dealer |
$XBD |
106.60 |
+0.89 |
+0.84% |
-7.34% |
| Retail |
$RLX |
434.03 |
-0.99 |
-0.23% |
+5.57% |
| Gold & Silver |
$XAU |
175.31 |
+0.31 |
+0.18% |
+4.20% |
| Bank |
$BKX |
48.93 |
+0.01 |
+0.02% |
+14.56% |
| Biotech |
$BTK |
1,067.64 |
+18.47 |
+1.76% |
+13.32% |
|
|
|
 |
Strong Close Backed By Big Volume
Kenneth J. Gruneisen - Passed the CAN SLIM® Master's Exam
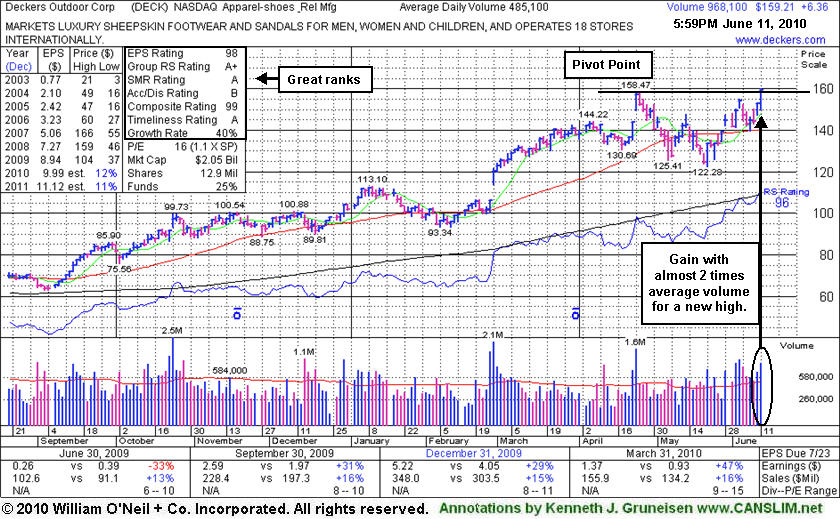
Deckers Outdoor Corp (DECK +6.36 or +4.16% to $159.21) was noted earlier today as it appeared in yellow in the mid-day report (read here). It finished strong and rallied to a new 52-week high with volume nearly 2 times average. Having cleared a choppy 7-week consolidation, it may be on course to challenge its 2007 all-time high ($166) and perhaps go even higher, unhindered by resistance due to overhead supply. Quarterly sales revenues increases have been in the +16% range while earnings increases were above the +25% minimum guideline in the 3 latest comparisons. The previously noted 2/26/10 "breakaway gap" was followed by meaningful gains. This apparel firm has a great annual earnings history (A criteria). Earnings estimates are in the 11-12% range for FY '10 and '11, and its rather lackluster sales revenues growth rate also leaves some concerns, fundamentally. For disciplined investors, a major concern remains that the major averages have not yet produced a confirmed rally with a solid follow-through day. That leaves the M criteria an overriding concern that argues against new buying efforts, since 3 out of 4 stocks typically follow the direction of the major averages.
|
|
|
Color Codes Explained :
Y - Better candidates highlighted by our
staff of experts.
G - Previously featured
in past reports as yellow but may no longer be buyable under the
guidelines.
***Last / Change / Volume data in this table is the closing quote data***
Symbol/Exchange
Company Name
Industry Group |
PRICE |
CHANGE
(%Change) |
Day High |
Volume
(% DAV)
(% 50 day avg vol) |
52 Wk Hi
% From Hi |
Featured
Date |
Price
Featured |
Pivot Featured |
|
Max Buy |
APEI
-
NASDAQ
American Public Educ Inc
DIVERSIFIED SERVICES - Education and Training Services
|
$47.48
|
+1.32
2.86% |
$48.26
|
178,912
115.28% of 50 DAV
50 DAV is 155,200
|
$48.17
-1.43%
|
6/7/2010
|
$46.60
|
PP = $46.29
|
|
MB = $48.60
|
 Most Recent Note - 6/11/2010 4:13:19 PM
Y - Gain today on average volume, finishing the week strong. Its 6/07/10 gain and close above its pivot point with above average volume triggered a technical buy signal.
>>> The latest Featured Stock Update with an annotated graph appeared on 9/17/2008. Click here.
View all notes |
Alert me of new notes |
CANSLIM.net Company Profile |
SEC |
Zacks Reports |
StockTalk |
News |
Chart |
Request a new note
C
A N
S L
I M


|
BIDU
-
NASDAQ
Baidu Inc Ads
INTERNET - Internet Information Providers
|
$72.85
|
+0.22
0.30% |
$73.33
|
8,567,509
57.46% of 50 DAV
50 DAV is 14,910,300
|
$82.29
-11.47%
|
1/13/2010
|
$43.13
|
PP = $42.68
|
|
MB = $44.81
|
Most Recent Note - 6/11/2010 4:16:11 PM
G - Held its ground today after a gap up on 6/10/10, rallying from support at its 50 DMA line. A worrisome negative reversal from its all-time high on 5/13/10 followed a 10:1 stock split.
>>> The latest Featured Stock Update with an annotated graph appeared on 6/1/2010. Click here.
View all notes |
Alert me of new notes |
CANSLIM.net Company Profile |
SEC |
Zacks Reports |
StockTalk |
News |
Chart |
Request a new note
C
A N
S L
I M
|
BRLI
-
NASDAQ
Bio Reference Labs Inc
HEALTH SERVICES - Medical Laboratories and Researc
|
$23.19
|
+0.19
0.83% |
$23.25
|
68,402
35.59% of 50 DAV
50 DAV is 192,200
|
$24.67
-6.01%
|
2/12/2010
|
$39.02
|
PP = $20.49
|
|
MB = $21.51
|
Most Recent Note - 6/11/2010 4:17:37 PM
G - Small gains on light volume helped it close the week above its 50 DMA line. Consolidating for about 7 weeks since a 2:1 stock split effective on 4/22/10.
>>> The latest Featured Stock Update with an annotated graph appeared on 5/26/2010. Click here.
View all notes |
Alert me of new notes |
CANSLIM.net Company Profile |
SEC |
Zacks Reports |
StockTalk |
News |
Chart |
Request a new note
C
A N
S L
I M
|
CRM
-
NYSE
Salesforce.Com Inc
INTERNET - Internet Software and Services
|
$96.64
|
+4.22
4.57% |
$96.85
|
3,546,392
145.93% of 50 DAV
50 DAV is 2,430,200
|
$96.35
0.30%
|
6/2/2010
|
$88.44
|
PP = $89.60
|
|
MB = $94.08
|
Most Recent Note - 6/11/2010 4:19:56 PM
G - Gain today with above average volume helped it rally for a new all-time high above its "max buy" level. Color code is changed to green. Prior highs in the $89 area are an important support level to watch above its 50 DMA line.
>>> The latest Featured Stock Update with an annotated graph appeared on 6/2/2010. Click here.
View all notes |
Alert me of new notes |
CANSLIM.net Company Profile |
SEC |
Zacks Reports |
StockTalk |
News |
Chart |
Request a new note
C
A N
S L
I M
|
DECK
-
NASDAQ
Deckers Outdoor Corp
CONSUMER NON-DURABLES - Textile - Apparel Footwear
|
$159.21
|
+6.36
4.16% |
$160.00
|
974,397
204.83% of 50 DAV
50 DAV is 475,700
|
$158.47
0.47%
|
6/11/2010
|
$157.34
|
PP = $158.57
|
|
MB = $166.50
|
Most Recent Note - 6/11/2010 4:24:34 PM
Y - Gain today with 2 times average volume for a new 52-week high helped it clear a choppy 7-week consolidation and trigger a technical buy signal. Featured earlier in the mid-day report (read here). Possibly on course to challenge its 2007 all-time high ($166). Quarterly sales revenues increases have been in the +16% range while earnings increases were above the +25% minimum guideline in the 3 latest comparisons. The previously noted 2/26/10 "breakaway gap" was followed by meaningful gains. This apparel firm has a great annual earnings history (A criteria).
>>> The latest Featured Stock Update with an annotated graph appeared on 6/11/2010. Click here.
View all notes |
Alert me of new notes |
CANSLIM.net Company Profile |
SEC |
Zacks Reports |
StockTalk |
News |
Chart |
Request a new note
C
A N
S L
I M
|
Symbol/Exchange
Company Name
Industry Group |
PRICE |
CHANGE
(%Change) |
Day High |
Volume
(% DAV)
(% 50 day avg vol) |
52 Wk Hi
% From Hi |
Featured
Date |
Price
Featured |
Pivot Featured |
|
Max Buy |
LOPE
-
NASDAQ
Grand Canyon Education
DIVERSIFIED SERVICES - Education and; Training Services
|
$23.63
|
+0.05
0.21% |
$23.96
|
255,067
59.65% of 50 DAV
50 DAV is 427,600
|
$28.46
-16.97%
|
4/13/2010
|
$27.71
|
PP = $27.33
|
|
MB = $28.70
|
Most Recent Note - 6/10/2010 5:02:50 PM
G - Still holding its ground quietly, sitting -17% off its 52-week high today. The violation or prior chart lows on 6/07/10 raised concerns.
>>> The latest Featured Stock Update with an annotated graph appeared on 5/27/2010. Click here.
View all notes |
Alert me of new notes |
CANSLIM.net Company Profile |
SEC |
Zacks Reports |
StockTalk |
News |
Chart |
Request a new note
C
A N
S L
I M
|
MELI
-
NASDAQ
Mercadolibre Inc
INTERNET - Internet Software and; Services
|
$57.80
|
+0.50
0.87% |
$58.81
|
1,364,922
200.69% of 50 DAV
50 DAV is 680,100
|
$57.35
0.78%
|
5/13/2010
|
$54.21
|
PP = $55.85
|
|
MB = $58.64
|
Most Recent Note - 6/11/2010 4:36:15 PM
Y - Gain today for a new 52-week high. Surged in the final hour on 6/10/10 and its considerable gain above its pivot point on volume +79% above average triggered a technical buy signal.
>>> The latest Featured Stock Update with an annotated graph appeared on 6/10/2010. Click here.
View all notes |
Alert me of new notes |
CANSLIM.net Company Profile |
SEC |
Zacks Reports |
StockTalk |
News |
Chart |
Request a new note
C
A N
S L
I M
|
ROVI
-
NASDAQ
Rovi Corp
COMPUTER SOFTWARE andamp; SERVICES - Security Software andamp; Services
|
$37.99
|
+0.75
2.01% |
$38.12
|
567,671
42.63% of 50 DAV
50 DAV is 1,331,600
|
$40.06
-5.17%
|
6/3/2010
|
$38.70
|
PP = $40.16
|
|
MB = $42.17
|
Most Recent Note - 6/11/2010 4:39:21 PM
G - Gain today on light volume helped it rally above its 50 DMA line. Recently found support near prior lows in the $35 area, and stayed above its October 2009 chart high.
>>> The latest Featured Stock Update with an annotated graph appeared on 6/9/2010. Click here.
View all notes |
Alert me of new notes |
CANSLIM.net Company Profile |
SEC |
Zacks Reports |
StockTalk |
News |
Chart |
Request a new note
C
A N
S L
I M
|
SUMR
-
NASDAQ
Summer Infant Inc
CONSUMER NON-DURABLES - Personal Products
|
$6.69
|
+0.14
2.14% |
$6.83
|
45,790
60.89% of 50 DAV
50 DAV is 75,200
|
$8.42
-20.55%
|
5/4/2010
|
$6.85
|
PP = $7.09
|
|
MB = $7.44
|
Most Recent Note - 6/11/2010 4:41:06 PM
G - Halted its slide this week near prior chart lows in the $6.25 area following 6/08/10 violations of prior chart highs and its 50 DMA line which triggered technical sell signals. Only a prompt rebound back above its short-term average would help its outlook.
>>> The latest Featured Stock Update with an annotated graph appeared on 6/8/2010. Click here.
View all notes |
Alert me of new notes |
CANSLIM.net Company Profile |
SEC |
Zacks Reports |
StockTalk |
News |
Chart |
Request a new note
C
A N
S L
I M
|
THOR
-
NASDAQ
Thoratec Corp
HEALTH SERVICES - Medical Instruments and Supplies
|
$44.79
|
+0.65
1.47% |
$45.25
|
645,539
71.93% of 50 DAV
50 DAV is 897,400
|
$46.50
-3.68%
|
6/3/2010
|
$44.38
|
PP = $45.35
|
|
MB = $47.62
|
Most Recent Note - 6/11/2010 4:43:57 PM
Y - Gain today on light volume for its second best close, finishing -3.7% off its 52 week high. No overhead supply remains to act as resistance.
>>> The latest Featured Stock Update with an annotated graph appeared on 6/3/2010. Click here.
View all notes |
Alert me of new notes |
CANSLIM.net Company Profile |
SEC |
Zacks Reports |
StockTalk |
News |
Chart |
Request a new note
C
A N
S L
I M
|
Symbol/Exchange
Company Name
Industry Group |
PRICE |
CHANGE
(%Change) |
Day High |
Volume
(% DAV)
(% 50 day avg vol) |
52 Wk Hi
% From Hi |
Featured
Date |
Price
Featured |
Pivot Featured |
|
Max Buy |
ULTA
-
NASDAQ
Ulta Salon Cosm & Frag
SPECIALTY RETAIL - Specialty Retail, Other
|
$24.68
|
+2.28
10.18% |
$24.86
|
5,336,525
1,235.02% of 50 DAV
50 DAV is 432,100
|
$26.00
-5.08%
|
5/28/2010
|
$25.58
|
PP = $25.86
|
|
MB = $27.15
|
Most Recent Note - 6/11/2010 4:46:47 PM
Y - Rallied back above its 50 DMA line with a considerable gain today on 11 times average volume. Its color code was changed to yellow. Announced year-over-year sales growth of +19.1% to $320.2 million from $268.8 million. Earnings per share came in at 23 cents, or nearly 3 times the year-ago performance of 8 cents, beating the Zacks Consensus Estimate by nearly 28%.
>>> The latest Featured Stock Update with an annotated graph appeared on 6/7/2010. Click here.
View all notes |
Alert me of new notes |
CANSLIM.net Company Profile |
SEC |
Zacks Reports |
StockTalk |
News |
Chart |
Request a new note
C
A N
S L
I M
|
|
|
|
THESE ARE NOT BUY RECOMMENDATIONS!
Comments contained in the body of this report are technical
opinions only. The material herein has been obtained
from sources believed to be reliable and accurate, however,
its accuracy and completeness cannot be guaranteed.
This site is not an investment advisor, hence it does
not endorse or recommend any securities or other investments.
Any recommendation contained in this report may not
be suitable for all investors and it is not to be deemed
an offer or solicitation on our part with respect to
the purchase or sale of any securities. All trademarks,
service marks and trade names appearing in this report
are the property of their respective owners, and are
likewise used for identification purposes only.
This report is a service available
only to active Paid Premium Members.
You may opt-out of receiving report notifications
at any time. Questions or comments may be submitted
by writing to Premium Membership Services 665 S.E. 10 Street, Suite 201 Deerfield Beach, FL 33441-5634 or by calling 1-800-965-8307
or 954-785-1121.
|
|
|


