You are not logged in.
This means you
CAN ONLY VIEW reports that were published prior to Monday, February 26, 2024.
You
MUST UPGRADE YOUR MEMBERSHIP if you want to see any current reports.
AFTER MARKET UPDATE - FRIDAY, JUNE 10TH, 2022
Previous After Market Report Next After Market Report >>>
|
|
|
|
DOW |
-880.00 |
31,392.79 |
-2.73% |
|
Volume |
1,065,561,743 |
+19% |
|
Volume |
5,092,372,700 |
-5% |
|
NASDAQ |
-414.20 |
11,340.02 |
-3.52% |
|
Advancers |
467 |
15% |
|
Advancers |
961 |
23% |
|
S&P 500 |
-116.96 |
3,900.86 |
-2.91% |
|
Decliners |
2,643 |
85% |
|
Decliners |
3,232 |
77% |
|
Russell 2000 |
-50.57 |
1,800.28 |
-2.73% |
|
52 Wk Highs |
4 |
|
|
52 Wk Highs |
23 |
|
|
S&P 600 |
-30.41 |
1,189.63 |
-2.49% |
|
52 Wk Lows |
251 |
|
|
52 Wk Lows |
462 |
|
|
The market remains in a correction (M criteria), as arguably the rally still needs a solid confirmation. An opportunity for a late follow-through day remains open unless the recent lows or May 20th lows are violated.
|
 |
Leadership Evaporates as Major Averages Sink Again
Kenneth J. Gruneisen - Passed the CAN SLIM® Master's Exam
The Dow slid 880 points, posting a 4.6% weekly drawdown. The S&P 500 slumped 2.9%, extending its weekly loss to 5.1% and closing 18.7% below its January 3 record. The Nasdaq Composite tumbled 3.5% for the day and 5.6% for the week. All three benchmarks notched a second straight weekly decline with their worst performance since January. Volume totals reported were mixed, higher than the prior session on the NYSE and lower on the Nasdaq exchange. Breadth was clearly negative as decliners led advancers by more that a 5-1 margin on the NYSE and more than 3-1 on the Nasdaq exchange. Leadership evaporated as there were zero high-ranked companies from the Leaders List that hit new 52-week highs and were listed on the BreakOuts Page, versus the total of 5 on the prior session. New 52-week lows totals swelled again and solidly outnumbered new 52-week highs on the NYSE and on the Nasdaq exchange. The major indices have been in a noted market correction (M criteria). Followers of the fact-based investment system know to watch for a follow-through day backed by higher volume which could signal a new confirmed uptrend.
Chart courtesy of www.stockcharts.com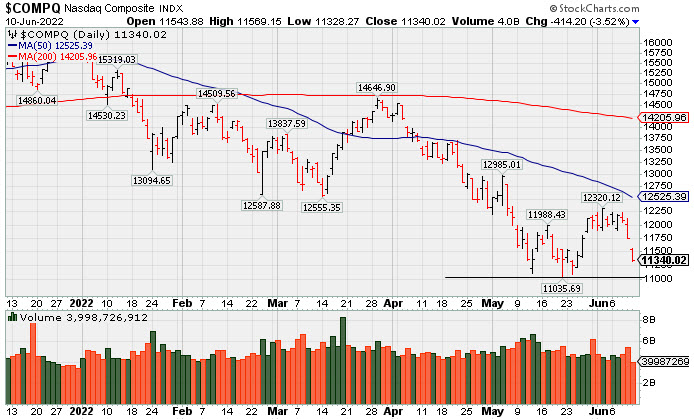 PICTURED: The Nasdaq Composite Index slumped for a 3rd consecutive loss with lighter volume after recently meeting resistance well below its 50-day moving average line. The 3 major indexes cannot be said to be in "healthy" technical shape while all of them are sputtering well below both their 50-day and 200-day moving average (DMA) lines.
Regular readers of this commentary know to be watching closely for signs of truly increasing institutional buying demand. Arguably, the rally still needs confirmation, and an opportunity for a valid follow-through day remains open unless the recent lows or May 20th lows are violated.
All 11 S&P 500 sectors closed in negative territory, with Consumer Discretionary stocks leading laggards. U.S. equities ended firmly lower on Friday as hotter-than-expected inflation data heightened expectations for aggressive monetary policy tightening. The Consumer Price Index (CPI) climbed 1.0% in May, more than tripling April’s 0.3% reading and coming in above expectations calling for a 0.7% gain. The annual headline figure jumped 8.6%, accelerating from the previous 8.3% reading to a fresh 40-year high. Core CPI (excluding food and energy) eased to a 6.0% year-over-year rise from the prior 6.2% pace, though remained firmly above the Federal Reserve’s (Fed) 2% target. Separately, a preliminary reading of June consumer sentiment from the University of Michigan sank to a record low of 50.2 amid rising inflation expectations. Attention now turns to next week’s Fed meeting, with policymakers widely expected to raise rates by 0.50% on Wednesday.
Treasuries resumed their sell-off, with the 10-year note yield jumping 10 basis points (0.10%) to 3.15%. The more Fed-sensitive two-year note spiked 24 basis points (0.24%) to 3.06%, surpassing the 3.00% level for the first time since 2008. Meanwhile, the U.S. dollar surged 0.9% against a basket of its peers amid speculation global central banks may lag behind the Fed’s rate hikes.
|
 Kenneth J. Gruneisen started out as a licensed stockbroker in August 1987, a couple of months prior to the historic stock market crash that took the Dow Jones Industrial Average down -22.6% in a single day. He has published daily fact-based fundamental and technical analysis on high-ranked stocks online for two decades. Through FACTBASEDINVESTING.COM, Kenneth provides educational articles, news, market commentary, and other information regarding proven investment systems that work in good times and bad.
Comments contained in the body of this report are technical opinions only and are not necessarily those of Gruneisen Growth Corp. The material herein has been obtained from sources believed to be reliable and accurate, however, its accuracy and completeness cannot be guaranteed. Our firm, employees, and customers may effect transactions, including transactions contrary to any recommendation herein, or have positions in the securities mentioned herein or options with respect thereto. Any recommendation contained in this report may not be suitable for all investors and it is not to be deemed an offer or solicitation on our part with respect to the purchase or sale of any securities. |
|
 |
Retail, Tech, Financial, and Energy-Linked Groups Fell
Kenneth J. Gruneisen - Passed the CAN SLIM® Master's Exam
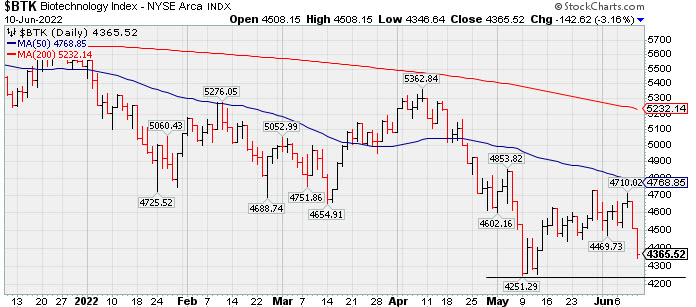
The Retail Index ($RLX -4.50%) and financial issues created a drag on the major averages as the Bank Index ($BKX -4.34%) and Broker/Dealer Index ($XBD -3.54%) sank. The tech sector had a negative bias as the Semiconductor Index ($SOX -3.60%), Networking Index ($NWX -3.77%), and Biotech Index ($BTK -3.16%) each fell more than -3%. The Oil Services Index ($OSX -2.87%) and Integrated Oil Index ($XOI -1.49%) both slumped, meanwhile, the Gold & Silver Index ($XAU +4.54%) posted a standout gain.
PICTURED: The Biotech Index ($BTK -3.16%) is slumping after recently meeting resistance below its downward sloping 50-day moving average (DMA) line.
| Oil Services |
$OSX |
82.23 |
-2.43 |
-2.87% |
+55.97% |
| Integrated Oil |
$XOI |
1,831.37 |
-27.77 |
-1.49% |
+55.44% |
| Semiconductor |
$SOX |
2,831.98 |
-105.81 |
-3.60% |
-28.23% |
| Networking |
$NWX |
713.55 |
-27.94 |
-3.77% |
-26.52% |
| Broker/Dealer |
$XBD |
385.01 |
-14.13 |
-3.54% |
-20.92% |
| Retail |
$RLX |
2,946.79 |
-138.88 |
-4.50% |
-30.28% |
| Gold & Silver |
$XAU |
132.92 |
+5.77 |
+4.54% |
+0.36% |
| Bank |
$BKX |
105.37 |
-4.78 |
-4.34% |
-20.31% |
| Biotech |
$BTK |
4,365.52 |
-142.62 |
-3.16% |
-20.89% |
|
|
|
 |
Featured Stocks
Kenneth J. Gruneisen - Passed the CAN SLIM® Master's Exam
|
|
|
Color Codes Explained :
Y - Better candidates highlighted by our
staff of experts.
G - Previously featured
in past reports as yellow but may no longer be buyable under the
guidelines.
***Last / Change / Volume data in this table is the closing quote data***
Symbol/Exchange
Company Name
Industry Group |
PRICE |
CHANGE
(%Change) |
Day High |
Volume
(% DAV)
(% 50 day avg vol) |
52 Wk Hi
% From Hi |
Featured
Date |
Price
Featured |
Pivot Featured |
|
Max Buy |
 CI
-
NYSE
CI
-
NYSE
Cigna Corp
Medical-Managed Care
|
$253.29
|
-4.29
-1.67% |
$256.09
|
1,397,701
91.59% of 50 DAV
50 DAV is 1,526,000
|
$273.58
-7.42%
|
5/6/2022
|
$263.52
|
PP = $269.97
|
|
MB = $283.47
|
 Most Recent Note - 6/10/2022 4:04:33 PM
G - Color code is changed to green after violating its 50 DMA line ($257) and undercutting the prior low ($253.69 on 6/03/22) triggering a technical sell signal raising greater concerns. Fundamentals remain strong.
>>> FEATURED STOCK ARTICLE : Consolidating Above 50-Day Moving Average Near All-Time High - 5/25/2022 |
View all notes |
Set NEW NOTE alert |
Company Profile |
SEC
News |
Chart |
Request a new note
C
A
S
I |
PAG
-
NYSE
Penske Automotive Grp
Retail/Whlsle-Automobile
|
$115.52
|
-5.73
-4.73% |
$121.11
|
379,614
104.87% of 50 DAV
50 DAV is 362,000
|
$123.60
-6.54%
|
5/13/2022
|
$114.88
|
PP = $114.57
|
|
MB = $120.30
|
Most Recent Note - 6/10/2022 4:10:41 PM
Y - Pulled back with near average volume today slumping back below its "max buy" level and its color code is changed to yellow. No overhead supply remains to act as resistance. Prior highs in the $114 area define initial support to watch above its 50 DMA line ($106.60) defines important near term support to watch.
>>> FEATURED STOCK ARTICLE : Penske Perched at High With No Resistance Remaining - 6/2/2022 |
View all notes |
Set NEW NOTE alert |
Company Profile |
SEC
News |
Chart |
Request a new note
C
A
S
I |
LLY
-
NYSE
Eli Lilly & Co
Medical-Diversified
|
$297.01
|
-6.24
-2.06% |
$301.66
|
2,440,753
81.20% of 50 DAV
50 DAV is 3,006,000
|
$324.08
-8.35%
|
5/16/2022
|
$302.46
|
PP = $314.10
|
|
MB = $329.81
|
Most Recent Note - 6/10/2022 4:08:59 PM
G - Pulled back with light volume today undercutting its 50 DMA line ($298) and prior low raising concerns and its color code is changed to green. A rebound above the 50 DMA line is needed for its outlook to improve. Subsequent gains above the pivot point backed by at least +40% above average volume may help clinch a convincing technical buy signal. Fundamentals remain strong.
>>> FEATURED STOCK ARTICLE : Encountering Distributional Pressure After Reaching New Highs - 6/6/2022 |
View all notes |
Set NEW NOTE alert |
Company Profile |
SEC
News |
Chart |
Request a new note
C
A
S
I |
WCC
-
NYSE
Wesco International Inc
WHOLESALE - Electronics Wholesale
|
$127.17
|
-6.51
-4.87% |
$132.10
|
345,959
69.89% of 50 DAV
50 DAV is 495,000
|
$144.43
-11.95%
|
6/1/2022
|
$128.79
|
PP = $139.10
|
|
MB = $146.06
|
Most Recent Note - 6/10/2022 4:12:47 PM
Y - Slumped further with today's 3rd consecutive loss backed by below average volume. Its 50 DMA line ($26.55) and 200 DMA line define near-term support above prior lows. Fundamentals remain strong after it reported Mar '22 quarterly earnings +154% on +22% sales revenues versus the year ago period.
>>> FEATURED STOCK ARTICLE : Big Volume-Driven Gain Helped Technical Stance Improve - 6/1/2022 |
View all notes |
Set NEW NOTE alert |
Company Profile |
SEC
News |
Chart |
Request a new note
C
A
S
I |
COKE
-
NASDAQ
Coca-Cola Consolidated
FOOD and BEVERAGE - Beverages - Soft Drinks
|
$582.35
|
-7.15
-1.21% |
$599.14
|
43,695
109.24% of 50 DAV
50 DAV is 40,000
|
$656.11
-11.24%
|
6/6/2022
|
$629.97
|
PP = $637.49
|
|
MB = $669.36
|
Most Recent Note - 6/10/2022 4:06:29 PM
Y - Suffered a 4th consecutive loss today with above average volume raising concerns. Prior mid-day reports noted - "A strong gain and close above the pivot point backed by at least +40% above average volume may trigger a technical buy signal. Reported earnings increases above the +25% minimum in the of the past 4 quarterly comparisons through Mar '22 quarters versus the year ago periods. Annual earnings (A criteria) growth has been strong after a downturn in FY '18."
>>> FEATURED STOCK ARTICLE : Paused After Hitting New High With Volume-Driven Gains - 6/7/2022 |
View all notes |
Set NEW NOTE alert |
Company Profile |
SEC
News |
Chart |
Request a new note
C
A
S
I |
Symbol/Exchange
Company Name
Industry Group |
PRICE |
CHANGE
(%Change) |
Day High |
Volume
(% DAV)
(% 50 day avg vol) |
52 Wk Hi
% From Hi |
Featured
Date |
Price
Featured |
Pivot Featured |
|
Max Buy |
|
|
|
THESE ARE NOT BUY RECOMMENDATIONS!
Comments contained in the body of this report are technical
opinions only. The material herein has been obtained
from sources believed to be reliable and accurate, however,
its accuracy and completeness cannot be guaranteed.
This site is not an investment advisor, hence it does
not endorse or recommend any securities or other investments.
Any recommendation contained in this report may not
be suitable for all investors and it is not to be deemed
an offer or solicitation on our part with respect to
the purchase or sale of any securities. All trademarks,
service marks and trade names appearing in this report
are the property of their respective owners, and are
likewise used for identification purposes only.
This report is a service available
only to active Paid Premium Members.
You may opt-out of receiving report notifications
at any time. Questions or comments may be submitted
by writing to Premium Membership Services 665 S.E. 10 Street, Suite 201 Deerfield Beach, FL 33441-5634 or by calling 1-800-965-8307
or 954-785-1121.
|
|
|