You are not logged in.
This means you
CAN ONLY VIEW reports that were published prior to Monday, April 14, 2025.
You
MUST UPGRADE YOUR MEMBERSHIP if you want to see any current reports.
AFTER MARKET UPDATE - MONDAY, JUNE 10TH, 2013
Previous After Market Report Next After Market Report >>>
|
|
|
|
DOW |
-9.53 |
15,238.59 |
-0.06% |
|
Volume |
595,371,590 |
-18% |
|
Volume |
1,503,028,820 |
-6% |
|
NASDAQ |
+4.55 |
3,473.77 |
+0.13% |
|
Advancers |
1,333 |
43% |
|
Advancers |
1,593 |
61% |
|
S&P 500 |
-0.57 |
1,642.81 |
-0.03% |
|
Decliners |
1,679 |
54% |
|
Decliners |
895 |
35% |
|
Russell 2000 |
+5.05 |
992.67 |
+0.51% |
|
52 Wk Highs |
111 |
|
|
52 Wk Highs |
147 |
|
|
S&P 600 |
+3.16 |
557.27 |
+0.57% |
|
52 Wk Lows |
89 |
|
|
52 Wk Lows |
31 |
|
|
 |
Major Averages End Mixed on Indecisive Light-Volume Session
Kenneth J. Gruneisen - Passed the CAN SLIM® Master's Exam
The indices ended Monday's trading session with mixed results. The volume totals were reported lighter than the prior session totals on both major exchanges, a sign that the institutional crowd was indecisive. Breadth was mixed as decliners led advancers by an 8-7 margin on the NYSE and yet advancers outnumbered decliners by nearly 2-1 on the Nasdaq exchange. There were 57 high-ranked companies from the CANSLIM.net Leaders List making new 52-week highs and appearing on the CANSLIM.net BreakOuts Page, up from the prior session total of 43 stocks. New 52-week highs solidly outnumbered new 52-week lows on the NYSE and on the Nasdaq exchange. There were gains for 9 of the 11 high-ranked companies currently included on the Featured Stocks Page.
Equities toggled between gains and losses throughout the session as investors digested a batch of mixed economic data out of Asia and an upgrade to the U.S. credit outlook by S&P.
Six of the 10 sectors on the S&P were higher, led by gains in the telecom space. Facebook Inc (FB +4.5%) rallied following some positive analyst comments. In other news, McDonald's Corp (MCD +1.3%) rose after posting better-than-expected May same-store sales and citing an expanded menu.
Turning to fixed income markets, Treasuries were lower along the curve. The benchmark 10-year note was down 1/4 of a point to yield 2.21% and the 30-year bond was down over a half point to yield 3.37%.
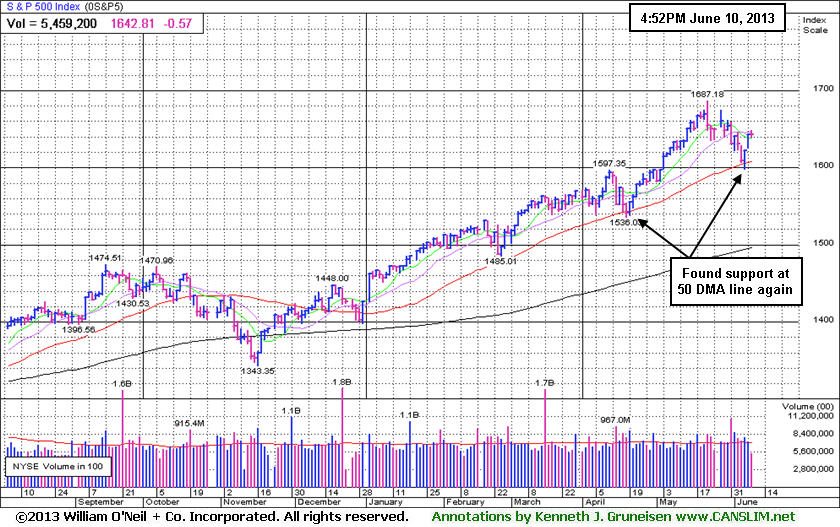
The market (M criteria) uptrend clearly came under pressure as May drew to a close, and the ongoing weakness is threatening to become a full blown "correction". However, lighter volume totals are a sign that institutional volume has not been intensifying while the major averages have retreated. As more damaging losses mount in the broader market this can serve as a reminder for investors to be protective of any gains and to limit losses by being especially watchful for any individual issues flashing technical sell signals. It is vitally important to your success with the fact-based investment system to reduce exposure and preserve cash during market downdrafts.
As always, watch upcoming CANSLIM.net reports for new action-worthy leaders best matching the winning models to be covered as they emerge and then included on the Featured Stocks Page - with our Certified experts' latest notes and links to additional resources including detailed analysis with annotated graphs. The Premium Member Homepage - includes "dynamic archives" to all prior pay reports published. Watch for an announcement via email concerning the next WEBCAST.
PICTURED: The S&P 500 Index found prompt support at its 50-day moving average (DMA) line after the rally encountered recent distributional pressure.
|
 Kenneth J. Gruneisen started out as a licensed stockbroker in August 1987, a couple of months prior to the historic stock market crash that took the Dow Jones Industrial Average down -22.6% in a single day. He has published daily fact-based fundamental and technical analysis on high-ranked stocks online for two decades. Through FACTBASEDINVESTING.COM, Kenneth provides educational articles, news, market commentary, and other information regarding proven investment systems that work in good times and bad.
Comments contained in the body of this report are technical opinions only and are not necessarily those of Gruneisen Growth Corp. The material herein has been obtained from sources believed to be reliable and accurate, however, its accuracy and completeness cannot be guaranteed. Our firm, employees, and customers may effect transactions, including transactions contrary to any recommendation herein, or have positions in the securities mentioned herein or options with respect thereto. Any recommendation contained in this report may not be suitable for all investors and it is not to be deemed an offer or solicitation on our part with respect to the purchase or sale of any securities. |
|
 |
Financial, Some Tech, and Medical-Related Groups Rose
Kenneth J. Gruneisen - Passed the CAN SLIM® Master's Exam
The Broker/Dealer Index ($XBD +0.22%) posted a small gain and the Bank Index ($BKX +0.57%) tallied a slightly better gain. The Healthcare Index ($HMO +1.08%) was a standout group among Monday's gainers. The Internet Index ($IIX +0.35%) and Semiconductor Index ($SOX +0.53%) posted gains to lead the tech sector, meanwhile the Biotechnology Index ($BTK -0.08%) and the Networking Index ($NWX +0.03%) finished flat. Commodity-linked groups were little changed as the Oil Services Index ($OSX -0.36%) and Integrated Oil Index ($XOI -0.07%) edged lower and the Gold & Silver Index ($XAU +0.17%) inched higher. The Retail Index ($RLX -0.13%) also edged lower.
Charts courtesy www.stockcharts.com
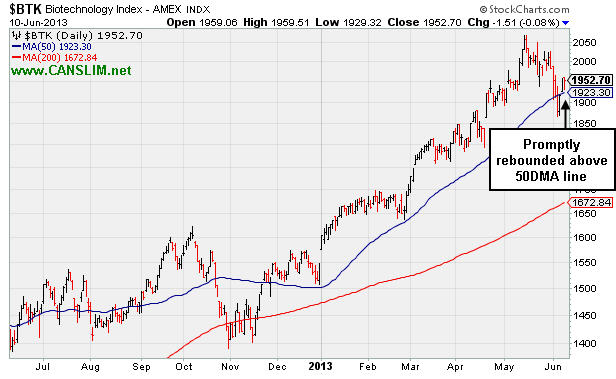
PICTURED: The Biotechnology Index ($BTK -0.08%) promptly rebounded above its 50-day moving average (DMA) line after briefly undercutting that important short-term average.
| Oil Services |
$OSX |
256.93 |
-0.92 |
-0.36% |
+16.70% |
| Healthcare |
$HMO |
3,116.47 |
+33.43 |
+1.08% |
+23.96% |
| Integrated Oil |
$XOI |
1,384.53 |
-0.92 |
-0.07% |
+11.49% |
| Semiconductor |
$SOX |
473.97 |
+2.50 |
+0.53% |
+23.41% |
| Networking |
$NWX |
264.26 |
+0.08 |
+0.03% |
+16.65% |
| Internet |
$IIX |
384.43 |
+1.33 |
+0.35% |
+17.56% |
| Broker/Dealer |
$XBD |
126.54 |
+0.28 |
+0.22% |
+34.15% |
| Retail |
$RLX |
793.63 |
-1.04 |
-0.13% |
+21.52% |
| Gold & Silver |
$XAU |
105.80 |
+0.18 |
+0.17% |
-36.11% |
| Bank |
$BKX |
61.93 |
+0.35 |
+0.57% |
+20.77% |
| Biotech |
$BTK |
1,952.70 |
-1.51 |
-0.08% |
+26.22% |
|
|
|
 |
Perched Near High After Mild Distributional Pressure
Kenneth J. Gruneisen - Passed the CAN SLIM® Master's Exam
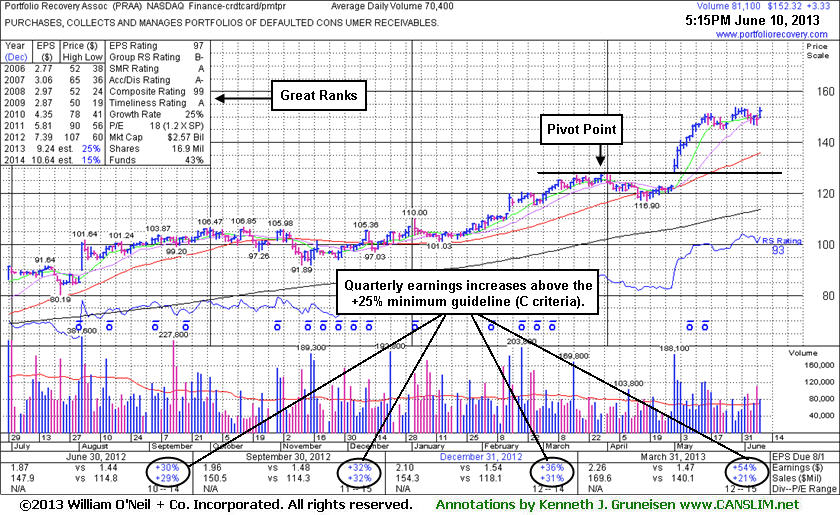
Portfolio Recovery Assoc (PRAA +$3.33 or +2.24% to $152.32) endured mild distributional pressure last week as indicated by the couple of down days marked by above average volume. The high-ranked leader from the Finance - Credit Card/Payment Processing industry group is still holding its ground stubbornly near its all-time high with no resistance remaining due to overhead supply. It is very extended from prior highs in the $127 area and well above its 50-day moving average (DMA) line defining important chart support levels to watch on pullbacks.
Its last appearance in this FSU section was on 5/22/13 with an annotated graph under the headline, "Extended From Base After Streak of Gains for New Highs", consolidating near its high after an impressive streak of 13 consecutive gains into new high territory. Patient investors may watch for a new base or secondary buy point to possibly develop and be noted in the weeks ahead. Since highlighted in the 5/01/13 mid-day report (read here) after its "breakaway gap" it has shown bullish action. Its fundamentals remain strong, as it reported earnings +54% on +21% sales revenues for the Mar '13 quarter, continuing its record of strong earnings increases above the +25% minimum guideline (C criteria). The number of top-rated funds owning its shares rose from 308 in Jun '12 to 385 in Mar '13, a reassuring sign concerning the I criteria.
|
|
|
Color Codes Explained :
Y - Better candidates highlighted by our
staff of experts.
G - Previously featured
in past reports as yellow but may no longer be buyable under the
guidelines.
***Last / Change / Volume data in this table is the closing quote data***
Symbol/Exchange
Company Name
Industry Group |
PRICE |
CHANGE
(%Change) |
Day High |
Volume
(% DAV)
(% 50 day avg vol) |
52 Wk Hi
% From Hi |
Featured
Date |
Price
Featured |
Pivot Featured |
|
Max Buy |
AL
-
NYSE
Air Lease Corp Cl A
DIVERSIFIED SERVICES - Rental and Leasing Services
|
$27.60
|
+0.54
2.00% |
$27.60
|
492,772
86.48% of 50 DAV
50 DAV is 569,800
|
$31.00
-10.97%
|
5/9/2013
|
$30.95
|
PP = $29.38
|
|
MB = $30.85
|
 Most Recent Note - 6/10/2013 5:45:32 PM
G - Posted a gain today with below average volume and it remains below its 50 DMA line which may now act as resistance. Completed a Secondary Offering on 5/31/13.
>>> The latest Featured Stock Update with an annotated graph appeared on 5/30/2013. Click here.
View all notes |
Alert me of new notes |
CANSLIM.net Company Profile |
SEC |
Zacks Reports |
StockTalk |
News |
Chart |
Request a new note
C
A N
S L
I M


|
AMBA
-
NASDAQ
Ambarella Inc
ELECTRONICS - Semiconductor - Specialized
|
$17.40
|
+0.87
5.26% |
$17.45
|
1,741,786
187.55% of 50 DAV
50 DAV is 928,700
|
$17.90
-2.79%
|
5/6/2013
|
$15.31
|
PP = $16.10
|
|
MB = $16.91
|
Most Recent Note - 6/10/2013 2:45:24 PM
G - Color code is changed to green while trading above its "max buy" level and poised for a best-ever close with above average volume behind its gain challenging its 52-week high. Reported strong earnings and revenues increases for the April '13 quarter. Its 50 DMA line ($14.62 now) defines important chart support to watch.
>>> The latest Featured Stock Update with an annotated graph appeared on 5/29/2013. Click here.
View all notes |
Alert me of new notes |
CANSLIM.net Company Profile |
SEC |
Zacks Reports |
StockTalk |
News |
Chart |
Request a new note
C
A N
S L
I M
|
EQM
-
NYSE
E Q T Midstream Partners
ENERGY - Oil and Gas Pipelines
|
$46.97
|
+1.19
2.60% |
$47.51
|
69,769
63.77% of 50 DAV
50 DAV is 109,400
|
$51.72
-9.18%
|
4/25/2013
|
$40.16
|
PP = $40.84
|
|
MB = $42.88
|
Most Recent Note - 6/10/2013 5:41:04 PM
G - Posted its 3rd consecutive gain on light volume since halting its slide well above its 50 DMA line defining important near-term chart support.
>>> The latest Featured Stock Update with an annotated graph appeared on 6/6/2013. Click here.
View all notes |
Alert me of new notes |
CANSLIM.net Company Profile |
SEC |
Zacks Reports |
StockTalk |
News |
Chart |
Request a new note
C
A N
S L
I M
|
FLT
-
NYSE
Fleetcor Technologies
DIVERSIFIED SERVICES - Business/Management Services
|
$88.10
|
+0.99
1.14% |
$88.50
|
670,950
75.94% of 50 DAV
50 DAV is 883,500
|
$88.83
-0.82%
|
5/29/2013
|
$86.02
|
PP = $85.66
|
|
MB = $89.94
|
Most Recent Note - 6/7/2013 4:14:59 PM
Y- Held its ground this week. It was noted in the mid-day report on 5/29/13 with a new pivot point cited based on its 5/03/13 high, and it rose from an advanced "3-weeks tight" base with a gain on the session backed by +56% above average volume. It may go on to produce more climactic gains, however this was a riskier "late-stage" base.
>>> The latest Featured Stock Update with an annotated graph appeared on 5/31/2013. Click here.
View all notes |
Alert me of new notes |
CANSLIM.net Company Profile |
SEC |
Zacks Reports |
StockTalk |
News |
Chart |
Request a new note
C
A N
S L
I M
|
LOPE
-
NASDAQ
Grand Canyon Education
DIVERSIFIED SERVICES - Education and; Training Services
|
$32.62
|
+0.03
0.09% |
$32.93
|
325,110
81.67% of 50 DAV
50 DAV is 398,100
|
$34.07
-4.26%
|
5/10/2013
|
$29.03
|
PP = $27.28
|
|
MB = $28.64
|
Most Recent Note - 6/7/2013 4:11:23 PM
G - Volume totals have been cooling while still holding its ground stubbornly perched at its 52-week high, very extended from its previous base. Prior highs in the $27 area define support to watch on pullbacks. Gains of greater than +20% in the first 2-3 weeks following its "breakaway gap" suggest holding for a minimum of 8 week under the fact-based investment system's rules.
>>> The latest Featured Stock Update with an annotated graph appeared on 6/3/2013. Click here.
View all notes |
Alert me of new notes |
CANSLIM.net Company Profile |
SEC |
Zacks Reports |
StockTalk |
News |
Chart |
Request a new note
C
A N
S L
I M
|
Symbol/Exchange
Company Name
Industry Group |
PRICE |
CHANGE
(%Change) |
Day High |
Volume
(% DAV)
(% 50 day avg vol) |
52 Wk Hi
% From Hi |
Featured
Date |
Price
Featured |
Pivot Featured |
|
Max Buy |
MRLN
-
NASDAQ
Marlin Business Services
DIVERSIFIED SERVICES - Rental and Leasing Services
|
$24.46
|
+0.89
3.78% |
$24.82
|
25,952
108.13% of 50 DAV
50 DAV is 24,000
|
$25.97
-5.81%
|
3/15/2013
|
$22.29
|
PP = $23.18
|
|
MB = $24.34
|
Most Recent Note - 6/10/2013 5:38:41 PM
Y - Rebounded above its 50 DMA line with 3 consecutive gains and its color code is changed to yellow. The recent low ($21.49 on 5/23/13) defines important near-term support below that short-term average where a violation would raise more serious concerns.
>>> The latest Featured Stock Update with an annotated graph appeared on 5/23/2013. Click here.
View all notes |
Alert me of new notes |
CANSLIM.net Company Profile |
SEC |
Zacks Reports |
StockTalk |
News |
Chart |
Request a new note
C
A N
S L
I M
|
NSM
-
NYSE
Nationstar Mtg Hldgs Inc
FINANCIAL SERVICES - Credit Services
|
$42.21
|
+0.13
0.31% |
$42.79
|
490,972
41.25% of 50 DAV
50 DAV is 1,190,200
|
$46.91
-10.02%
|
5/7/2013
|
$39.71
|
PP = $42.34
|
|
MB = $44.46
|
Most Recent Note - 6/10/2013 5:43:20 PM
Y - Posted a 3rd consecutive small gain on light volume. Disciplined investors always limit losses if any stock falls more than -7% from their purchase price.
>>> The latest Featured Stock Update with an annotated graph appeared on 5/28/2013. Click here.
View all notes |
Alert me of new notes |
CANSLIM.net Company Profile |
SEC |
Zacks Reports |
StockTalk |
News |
Chart |
Request a new note
C
A N
S L
I M
|
PRAA
-
NASDAQ
Portfolio Recovery Assoc
DIVERSIFIED SERVICES - Business/Management Services
|
$152.32
|
+3.33
2.24% |
$153.88
|
81,171
115.30% of 50 DAV
50 DAV is 70,400
|
$153.85
-0.99%
|
5/1/2013
|
$130.77
|
PP = $127.88
|
|
MB = $134.27
|
Most Recent Note - 6/10/2013 5:36:19 PM
G - Endured mild distributional pressure last week yet it remains perched near its high holding its ground with no resistance due to overhead supply. Its 50 DMA line defines important chart support. See the latest FSU analysis for more details and a new annotated graph.
>>> The latest Featured Stock Update with an annotated graph appeared on 6/10/2013. Click here.
View all notes |
Alert me of new notes |
CANSLIM.net Company Profile |
SEC |
Zacks Reports |
StockTalk |
News |
Chart |
Request a new note
C
A N
S L
I M
|
PRLB
-
NYSE
Proto Labs Inc
MANUFACTURING - Small Tools and Accessories
|
$56.15
|
-0.41
-0.72% |
$57.34
|
337,709
63.82% of 50 DAV
50 DAV is 529,200
|
$59.84
-6.17%
|
5/3/2013
|
$54.77
|
PP = $54.01
|
|
MB = $56.71
|
Most Recent Note - 6/7/2013 4:08:50 PM
Y - It ended still below its "max buy" level, up today with higher but still below average volume, rallying from support at its 50 DMA line. A subsequent violation may trigger a technical sell signal.
>>> The latest Featured Stock Update with an annotated graph appeared on 5/24/2013. Click here.
View all notes |
Alert me of new notes |
CANSLIM.net Company Profile |
SEC |
Zacks Reports |
StockTalk |
News |
Chart |
Request a new note
C
A N
S L
I M
|
RRTS
-
NYSE
Roadrunner Trans Systems
TRANSPORTATION - Air Delivery and Freight Service
|
$28.58
|
+0.70
2.51% |
$28.62
|
293,364
136.77% of 50 DAV
50 DAV is 214,500
|
$28.24
1.20%
|
4/3/2013
|
$22.77
|
PP = $23.75
|
|
MB = $24.94
|
Most Recent Note - 6/7/2013 4:09:56 PM
G - Rallied to finish the week near its all-time high. Fundamental concerns were raised by its sub par earnings increase in the Mar '13 quarter, below the +25% minimum guideline (C criteria).
>>> The latest Featured Stock Update with an annotated graph appeared on 6/4/2013. Click here.
View all notes |
Alert me of new notes |
CANSLIM.net Company Profile |
SEC |
Zacks Reports |
StockTalk |
News |
Chart |
Request a new note
C
A N
S L
I M
|
Symbol/Exchange
Company Name
Industry Group |
PRICE |
CHANGE
(%Change) |
Day High |
Volume
(% DAV)
(% 50 day avg vol) |
52 Wk Hi
% From Hi |
Featured
Date |
Price
Featured |
Pivot Featured |
|
Max Buy |
VRX
-
NYSE
Valeant Pharmaceuticals
DRUGS - Drug Manufacturers - Other
|
$85.11
|
-0.48
-0.56% |
$86.05
|
1,019,940
54.86% of 50 DAV
50 DAV is 1,859,200
|
$96.25
-11.57%
|
4/30/2013
|
$60.24
|
PP = $76.66
|
|
MB = $80.49
|
Most Recent Note - 6/7/2013 5:08:20 PM
G- Rallied since making recent acquisition plans. Support to watch is at prior highs coinciding with its 50 DMA near $76. See latest FSU analysis for more details and a new annotated graph.
>>> The latest Featured Stock Update with an annotated graph appeared on 6/7/2013. Click here.
View all notes |
Alert me of new notes |
CANSLIM.net Company Profile |
SEC |
Zacks Reports |
StockTalk |
News |
Chart |
Request a new note
C
A N
S L
I M
|
|
|
|
THESE ARE NOT BUY RECOMMENDATIONS!
Comments contained in the body of this report are technical
opinions only. The material herein has been obtained
from sources believed to be reliable and accurate, however,
its accuracy and completeness cannot be guaranteed.
This site is not an investment advisor, hence it does
not endorse or recommend any securities or other investments.
Any recommendation contained in this report may not
be suitable for all investors and it is not to be deemed
an offer or solicitation on our part with respect to
the purchase or sale of any securities. All trademarks,
service marks and trade names appearing in this report
are the property of their respective owners, and are
likewise used for identification purposes only.
This report is a service available
only to active Paid Premium Members.
You may opt-out of receiving report notifications
at any time. Questions or comments may be submitted
by writing to Premium Membership Services 665 S.E. 10 Street, Suite 201 Deerfield Beach, FL 33441-5634 or by calling 1-800-965-8307
or 954-785-1121.
|
|
|

