You are not logged in.
This means you
CAN ONLY VIEW reports that were published prior to Monday, April 14, 2025.
You
MUST UPGRADE YOUR MEMBERSHIP if you want to see any current reports.
AFTER MARKET UPDATE - THURSDAY, JUNE 10TH, 2010
Previous After Market Report Next After Market Report >>>
|
|
|
|
DOW |
+273.28 |
10,172.53 |
+2.76% |
|
Volume |
1,337,155,150 |
-21% |
|
Volume |
2,098,930,240 |
-5% |
|
NASDAQ |
+59.86 |
2,218.71 |
+2.77% |
|
Advancers |
2,672 |
84% |
|
Advancers |
2,271 |
82% |
|
S&P 500 |
+31.15 |
1,086.84 |
+2.95% |
|
Decliners |
422 |
13% |
|
Decliners |
425 |
15% |
|
Russell 2000 |
+21.50 |
639.79 |
+3.48% |
|
52 Wk Highs |
36 |
|
|
52 Wk Highs |
20 |
|
|
S&P 600 |
+10.73 |
342.28 |
+3.24% |
|
52 Wk Lows |
20 |
|
|
52 Wk Lows |
78 |
|
|
 |
Stocks Post Gains, But Volume Totals Reveal Lack Of Conviction
Adam Sarhan, Contributing Writer,
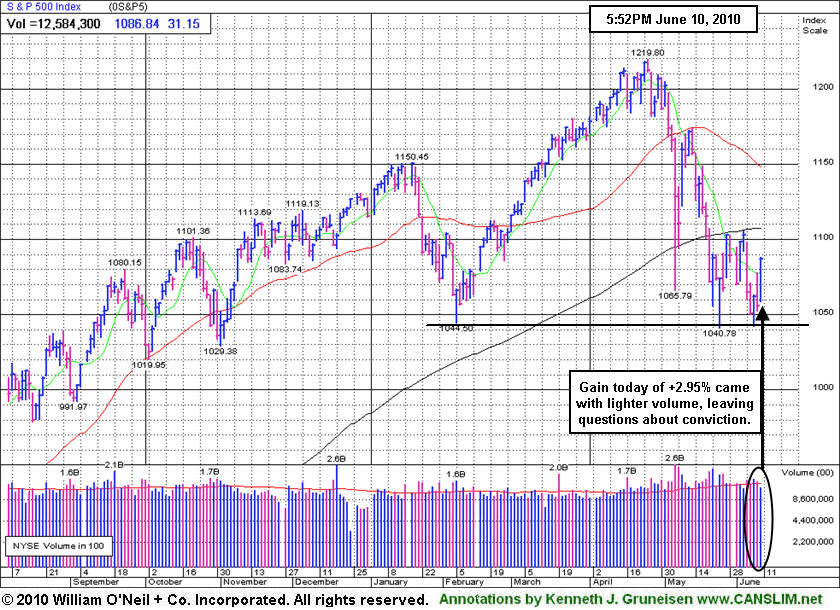
The major averages and a slew of commodities surged after a host of healthy economic data was released from Asia and the European Central Bank (ECB) and the Bank of England (BOE) held rates steady near historic lows. Volume, an important indicator of institutional sponsorship, was reported lighter than Wednesday's levels on both major exchanges which prevented the S&P 500 from scoring a follow-through day (FTD) and suggested large institutions were not aggressively buying stocks. Advancers trumped decliners by more than a 6-to-1 ratio on the NYSE and led by more than a 5-to-1 ratio on the Nasdaq exchange. There were 12 high-ranked companies from the CANSLIM.net Leaders List that made a new 52-week high and appeared on the CANSLIM.net BreakOuts Page, a modest improvement from the 5 issues that appeared on the prior session. New 52-week highs outnumbered new 52-week lows on the NYSE, but not on the Nasdaq exchange.
Overnight, stocks in Asia rose after a slew of healthy economic reports were released from China, Japan and Australia. The latest data showed accelerating economic growth which was a welcoming sign from that region. Chinese exports surged to a six year high which helped reaffirm the notion that the world's fastest-growing major economy will continue to fuel the global recovery. Japan's GDP rose at an annualized +5% rate in the first quarter and Australia's nonfarm payrolls report rose for a third consecutive month. In the US, weekly jobless claims fell while the trade deficit widened to the highest level in a year as exports fell. All this, sent the US dollar lower and a host of dollar denominated assets higher (mainly stocks and commodities) as these markets work off their deeply oversold levels.
From our vantage point, the latest rally effort has lacked substance, evidenced by the poor action in the major averages in recent sessions. Furthermore, the author of "How To Make Money In Stocks", the book that explains the fact-based investment system, has observed in the past that a market should not be considered to be in "healthy" shape unless at least 2 of the 3 major averages are trading above their rising 200-day moving average (DMA) lines. As of Thursday's close, The Nasdaq Composite, Dow Jones Industrial Average, and S&P 500 index unanimously closed below their respective 200 DMA lines. Therefore, the bears will likely remain in control until these popular averages close above those important levels. The Dow Jones Industrial Average marked Day 3 of its latest rally attempt while the Nasdaq Composite Index marked a new Day 1.
Professional Money Management Services - Free Portfolio Review:
If your portfolio is greater than $100,000 and you would like a free portfolio review, click here to get connected with one of our portfolio managers. ** Serious inquires only, please.
PICTURED: The S&P 500 Index's gain of +2.95% came with lighter volume, leaving questions about the buying conviction from the institutional crowd. The benchmark S&P 500 Index marked Day 12 of its current rally attempt, while narrowly avoiding undercutting its 5/25/10 low thus far. It failed to score a proper FTD due to the light volume that accompanied the latest gain from near 2010 lows.
|
|
|
 |
Energy, Financial, and Tech Shares Led Widespread Group Gains
Kenneth J. Gruneisen - Passed the CAN SLIM® Master's Exam
Energy-related shares rallied on Thursday and led to big gains for the Integrated Oil Index ($XOI +5.48%) and Oil Services Index ($OSX +6.22%). Financial shares also contributed to the major averages' gains as the Bank Index ($BKX +3.69%) and Broker/Dealer Index ($XBD +2.48%) provided important underlying strength. There was also a solid gain from the Retail Index ($RLX +3.03%), and unanimous tech sector gains as the Semiconductor Index ($SOX +3.80%), Networking Index ($NWX +2.74%), Internet Index ($IIX +2.79%), and Biotechnology Index ($BTK +3.11%) charged higher. Defensive groups posted modest gains as the Gold & Silver Index ($XAU +1.49%) and Healthcare Index ($HMO +1.54%) rose.
Charts courtesy www.stockcharts.com
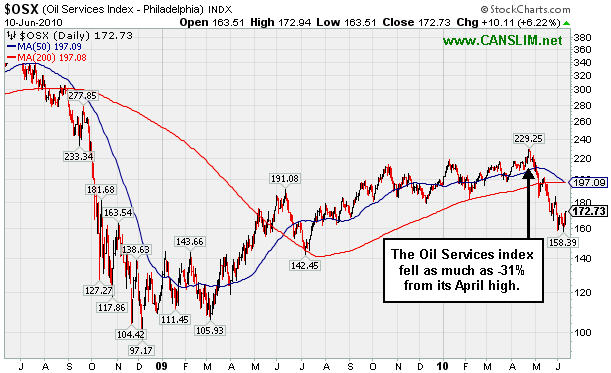
PICTURED: The Oil Services Index ($OSX +6.22%) was a standout index as it rallied for a big gain. It recently fell as much as -31% from its April high.
| Oil Services |
$OSX |
172.73 |
+10.11 |
+6.22% |
-11.38% |
| Healthcare |
$HMO |
1,501.64 |
+22.72 |
+1.54% |
+1.95% |
| Integrated Oil |
$XOI |
932.83 |
+48.43 |
+5.48% |
-12.67% |
| Semiconductor |
$SOX |
344.69 |
+12.63 |
+3.80% |
-4.23% |
| Networking |
$NWX |
228.43 |
+6.10 |
+2.74% |
-1.14% |
| Internet |
$IIX |
235.80 |
+6.39 |
+2.79% |
+0.83% |
| Broker/Dealer |
$XBD |
105.71 |
+2.56 |
+2.48% |
-8.12% |
| Retail |
$RLX |
435.04 |
+12.79 |
+3.03% |
+5.82% |
| Gold & Silver |
$XAU |
175.00 |
+2.57 |
+1.49% |
+4.01% |
| Bank |
$BKX |
48.92 |
+1.74 |
+3.69% |
+14.54% |
| Biotech |
$BTK |
1,048.84 |
+31.65 |
+3.11% |
+11.33% |
|
|
|
 |
Strong Finish On High Volume Triggers Technical Buy Signal
Kenneth J. Gruneisen - Passed the CAN SLIM® Master's Exam
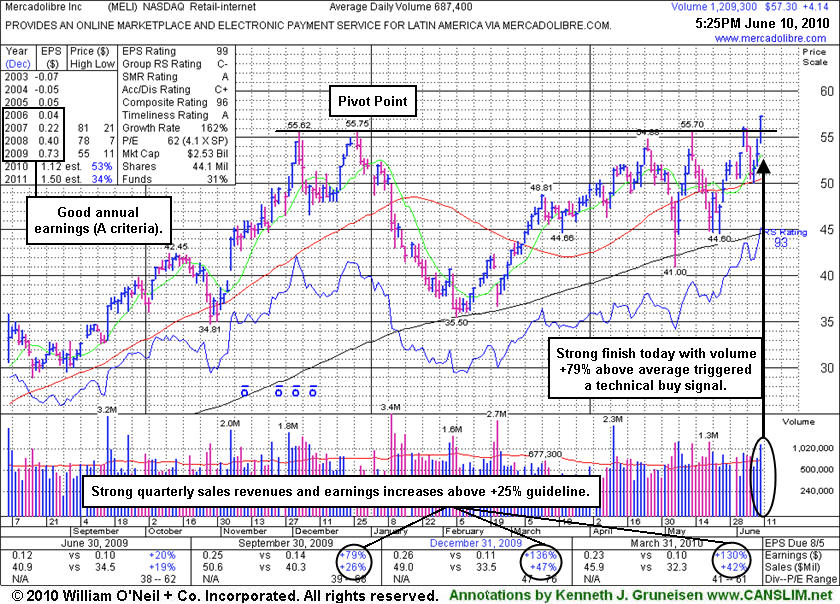
Mercadolibre Inc. (MELI +$4.14 or +7.79% to $57.30) surged in the final hour of today's session and hit a new 52-week high with a considerable gain above its pivot point on volume backed by +79% above average, triggering a technical buy signal. When it was last shown in this FSU section on 5/28/10 under the headline "Gains Above 50 DMA Line Follow Recent Distribution" an annotated graph showed it rebounding above its short-term average after enduring a wave of distributional pressure. In that article said - "It is an ideal candidate for one's watch list while awaiting the new rally effort's confirmation in the form of a sound follow-through day of gains from at least one of the major averages on higher volume." The considerable gains for the major averages today were an encouraging sign, but lower volume totals on the major exchanges suggested that conviction from the institutional crowd at present may not be sufficient to fuel a sustainable advance.
The Latin American Internet - eCommerce firm was featured in yellow in the 5/13/10 mid-day report (read here) and noted as it traded within 5 cents of its 52-week high. It has found great support at its long-term 200-day moving average (DMA) line, including earlier in the year. The high-ranked leader's pivot point is based upon its 12/28/09 high plus ten cents. Top-rated funds owning an interest rose from 62 in Dec '08 to 98 in Mar '10, which is encouraging concerning the I criteria. Its strong quarterly earnings and annual earnings history satisfy the C and A criteria.
|
|
|
Color Codes Explained :
Y - Better candidates highlighted by our
staff of experts.
G - Previously featured
in past reports as yellow but may no longer be buyable under the
guidelines.
***Last / Change / Volume data in this table is the closing quote data***
Symbol/Exchange
Company Name
Industry Group |
PRICE |
CHANGE
(%Change) |
Day High |
Volume
(% DAV)
(% 50 day avg vol) |
52 Wk Hi
% From Hi |
Featured
Date |
Price
Featured |
Pivot Featured |
|
Max Buy |
APEI
-
NASDAQ
American Public Educ Inc
DIVERSIFIED SERVICES - Education and Training Services
|
$46.16
|
+0.66
1.45% |
$46.64
|
146,671
94.50% of 50 DAV
50 DAV is 155,200
|
$48.17
-4.17%
|
6/7/2010
|
$46.60
|
PP = $46.29
|
|
MB = $48.60
|
 Most Recent Note - 6/10/2010 4:21:22 PM
Y - Gain today on light volume. Hovering near its pivot point above its 50 DMA line since its 6/07/10 gain and close above its pivot point with above average volume triggered a technical buy signal. 
>>> The latest Featured Stock Update with an annotated graph appeared on 9/17/2008. Click here.
View all notes |
Alert me of new notes |
CANSLIM.net Company Profile |
SEC |
Zacks Reports |
StockTalk |
News |
Chart |
Request a new note
C
A N
S L
I M


|
BIDU
-
NASDAQ
Baidu Inc Ads
INTERNET - Internet Information Providers
|
$72.63
|
+5.23
7.76% |
$72.71
|
14,998,366
100.59% of 50 DAV
50 DAV is 14,910,300
|
$82.29
-11.74%
|
1/13/2010
|
$43.13
|
PP = $42.68
|
|
MB = $44.81
|
Most Recent Note - 6/10/2010 2:51:40 PM
G - Gapped up today, rallying from support at its 50 DMA line. A worrisome negative reversal from its all-time high on 5/13/10 followed a 10:1 stock split.
>>> The latest Featured Stock Update with an annotated graph appeared on 6/1/2010. Click here.
View all notes |
Alert me of new notes |
CANSLIM.net Company Profile |
SEC |
Zacks Reports |
StockTalk |
News |
Chart |
Request a new note
C
A N
S L
I M
|
BRLI
-
NASDAQ
Bio Reference Labs Inc
HEALTH SERVICES - Medical Laboratories and Researc
|
$23.00
|
+0.50
2.22% |
$23.00
|
76,927
40.02% of 50 DAV
50 DAV is 192,200
|
$24.67
-6.78%
|
2/12/2010
|
$39.02
|
PP = $20.49
|
|
MB = $21.51
|
Most Recent Note - 6/10/2010 4:56:38 PM
G - Gain today on light volume, closing near its 50 DMA line which has been acting as resistance. Consolidating for about 7 weeks since a 2:1 stock split effective on 4/22/10.
>>> The latest Featured Stock Update with an annotated graph appeared on 5/26/2010. Click here.
View all notes |
Alert me of new notes |
CANSLIM.net Company Profile |
SEC |
Zacks Reports |
StockTalk |
News |
Chart |
Request a new note
C
A N
S L
I M
|
CRM
-
NYSE
Salesforce.Com Inc
INTERNET - Internet Software and Services
|
$92.42
|
+3.40
3.82% |
$92.65
|
2,434,998
100.20% of 50 DAV
50 DAV is 2,430,200
|
$96.35
-4.08%
|
6/2/2010
|
$88.44
|
PP = $89.60
|
|
MB = $94.08
|
Most Recent Note - 6/10/2010 5:00:14 PM
Y - Gapped up again today and rallied for its second highest close ever. Prior highs in the $89 area are an important support level to watch above its 50 DMA line.
>>> The latest Featured Stock Update with an annotated graph appeared on 6/2/2010. Click here.
View all notes |
Alert me of new notes |
CANSLIM.net Company Profile |
SEC |
Zacks Reports |
StockTalk |
News |
Chart |
Request a new note
C
A N
S L
I M
|
LOPE
-
NASDAQ
Grand Canyon Education
DIVERSIFIED SERVICES - Education and; Training Services
|
$23.58
|
-0.01
-0.04% |
$23.90
|
199,996
46.77% of 50 DAV
50 DAV is 427,600
|
$28.46
-17.15%
|
4/13/2010
|
$27.71
|
PP = $27.33
|
|
MB = $28.70
|
Most Recent Note - 6/10/2010 5:02:50 PM
G - Still holding its ground quietly, sitting -17% off its 52-week high today. The violation or prior chart lows on 6/07/10 raised concerns.
>>> The latest Featured Stock Update with an annotated graph appeared on 5/27/2010. Click here.
View all notes |
Alert me of new notes |
CANSLIM.net Company Profile |
SEC |
Zacks Reports |
StockTalk |
News |
Chart |
Request a new note
C
A N
S L
I M
|
Symbol/Exchange
Company Name
Industry Group |
PRICE |
CHANGE
(%Change) |
Day High |
Volume
(% DAV)
(% 50 day avg vol) |
52 Wk Hi
% From Hi |
Featured
Date |
Price
Featured |
Pivot Featured |
|
Max Buy |
MELI
-
NASDAQ
Mercadolibre Inc
INTERNET - Internet Software and; Services
|
$57.30
|
+4.14
7.79% |
$57.32
|
1,217,566
179.03% of 50 DAV
50 DAV is 680,100
|
$56.16
2.03%
|
5/13/2010
|
$54.21
|
PP = $55.85
|
|
MB = $58.64
|
Most Recent Note - 6/10/2010 5:06:11 PM
Y - Surged in the final hour of today's session and hit a new 52-week high with a considerable gain above its pivot point on volume +79% above average, triggering a technical buy signal.
>>> The latest Featured Stock Update with an annotated graph appeared on 6/10/2010. Click here.
View all notes |
Alert me of new notes |
CANSLIM.net Company Profile |
SEC |
Zacks Reports |
StockTalk |
News |
Chart |
Request a new note
C
A N
S L
I M
|
ROVI
-
NASDAQ
Rovi Corp
COMPUTER SOFTWARE andamp; SERVICES - Security Software andamp; Services
|
$37.24
|
+0.79
2.17% |
$37.32
|
731,189
54.91% of 50 DAV
50 DAV is 1,331,600
|
$40.06
-7.04%
|
6/3/2010
|
$38.70
|
PP = $40.16
|
|
MB = $42.17
|
Most Recent Note - 6/10/2010 5:10:48 PM
G - Up again today on light volume, yet remaining under its 50 DMA line. Recently testing support near prior lows in the $35 area, and staying above its October 2009 chart high.
>>> The latest Featured Stock Update with an annotated graph appeared on 6/9/2010. Click here.
View all notes |
Alert me of new notes |
CANSLIM.net Company Profile |
SEC |
Zacks Reports |
StockTalk |
News |
Chart |
Request a new note
C
A N
S L
I M
|
SUMR
-
NASDAQ
Summer Infant Inc
CONSUMER NON-DURABLES - Personal Products
|
$6.55
|
-0.09
-1.36% |
$6.81
|
124,837
166.01% of 50 DAV
50 DAV is 75,200
|
$8.42
-22.21%
|
5/4/2010
|
$6.85
|
PP = $7.09
|
|
MB = $7.44
|
Most Recent Note - 6/10/2010 5:14:20 PM
G - Down on above average volume for the 6th session of the past 8 sessions. The 6/08/10 violations of prior chart highs and its 50 DMA line triggered technical sell signals. Only a prompt rebound back above its short-term average would help its outlook.
>>> The latest Featured Stock Update with an annotated graph appeared on 6/8/2010. Click here.
View all notes |
Alert me of new notes |
CANSLIM.net Company Profile |
SEC |
Zacks Reports |
StockTalk |
News |
Chart |
Request a new note
C
A N
S L
I M
|
THOR
-
NASDAQ
Thoratec Corp
HEALTH SERVICES - Medical Instruments and Supplies
|
$44.14
|
+1.46
3.42% |
$44.16
|
498,098
55.50% of 50 DAV
50 DAV is 897,400
|
$46.50
-5.08%
|
6/3/2010
|
$44.38
|
PP = $45.35
|
|
MB = $47.62
|
Most Recent Note - 6/10/2010 5:17:16 PM
Y - Gapped up today and posted a gain on light volume, closing -5% off its 52 week high. Damaging losses recently negated its latest breakout.
>>> The latest Featured Stock Update with an annotated graph appeared on 6/3/2010. Click here.
View all notes |
Alert me of new notes |
CANSLIM.net Company Profile |
SEC |
Zacks Reports |
StockTalk |
News |
Chart |
Request a new note
C
A N
S L
I M
|
ULTA
-
NASDAQ
Ulta Salon Cosm & Frag
SPECIALTY RETAIL - Specialty Retail, Other
|
$22.40
|
+0.50
2.28% |
$22.60
|
848,008
196.25% of 50 DAV
50 DAV is 432,100
|
$26.00
-13.85%
|
5/28/2010
|
$25.58
|
PP = $25.86
|
|
MB = $27.15
|
Most Recent Note - 6/10/2010 5:20:39 PM
G - Halted its slide and posted a second consecutive gain today with above average volume. Concerns remain while it continues to linger below its 50 DMA line, and prior chart lows define important support in the $21 area. After encountering distributional pressure it is currently -14% off its 52-week high.
>>> The latest Featured Stock Update with an annotated graph appeared on 6/7/2010. Click here.
View all notes |
Alert me of new notes |
CANSLIM.net Company Profile |
SEC |
Zacks Reports |
StockTalk |
News |
Chart |
Request a new note
C
A N
S L
I M
|
Symbol/Exchange
Company Name
Industry Group |
PRICE |
CHANGE
(%Change) |
Day High |
Volume
(% DAV)
(% 50 day avg vol) |
52 Wk Hi
% From Hi |
Featured
Date |
Price
Featured |
Pivot Featured |
|
Max Buy |
|
|
|
THESE ARE NOT BUY RECOMMENDATIONS!
Comments contained in the body of this report are technical
opinions only. The material herein has been obtained
from sources believed to be reliable and accurate, however,
its accuracy and completeness cannot be guaranteed.
This site is not an investment advisor, hence it does
not endorse or recommend any securities or other investments.
Any recommendation contained in this report may not
be suitable for all investors and it is not to be deemed
an offer or solicitation on our part with respect to
the purchase or sale of any securities. All trademarks,
service marks and trade names appearing in this report
are the property of their respective owners, and are
likewise used for identification purposes only.
This report is a service available
only to active Paid Premium Members.
You may opt-out of receiving report notifications
at any time. Questions or comments may be submitted
by writing to Premium Membership Services 665 S.E. 10 Street, Suite 201 Deerfield Beach, FL 33441-5634 or by calling 1-800-965-8307
or 954-785-1121.
|
|
|


