You are not logged in.
This means you
CAN ONLY VIEW reports that were published prior to Monday, April 14, 2025.
You
MUST UPGRADE YOUR MEMBERSHIP if you want to see any current reports.
AFTER MARKET UPDATE - WEDNESDAY, JUNE 9TH, 2010
Previous After Market Report Next After Market Report >>>
|
|
|
|
DOW |
-40.73 |
9,899.25 |
-0.41% |
|
Volume |
1,700,904,770 |
+3% |
|
Volume |
2,218,849,700 |
-14% |
|
NASDAQ |
-11.72 |
2,158.85 |
-0.54% |
|
Advancers |
1,542 |
49% |
|
Advancers |
1,245 |
45% |
|
S&P 500 |
-6.31 |
1,055.69 |
-0.59% |
|
Decliners |
1,518 |
48% |
|
Decliners |
1,391 |
50% |
|
Russell 2000 |
+0.60 |
618.29 |
+0.10% |
|
52 Wk Highs |
35 |
|
|
52 Wk Highs |
10 |
|
|
S&P 600 |
+0.36 |
331.55 |
+0.11% |
|
52 Wk Lows |
45 |
|
|
52 Wk Lows |
130 |
|
|
 |
Lack Of Leadership Results In Another Weak Finish
Adam Sarhan, Contributing Writer,
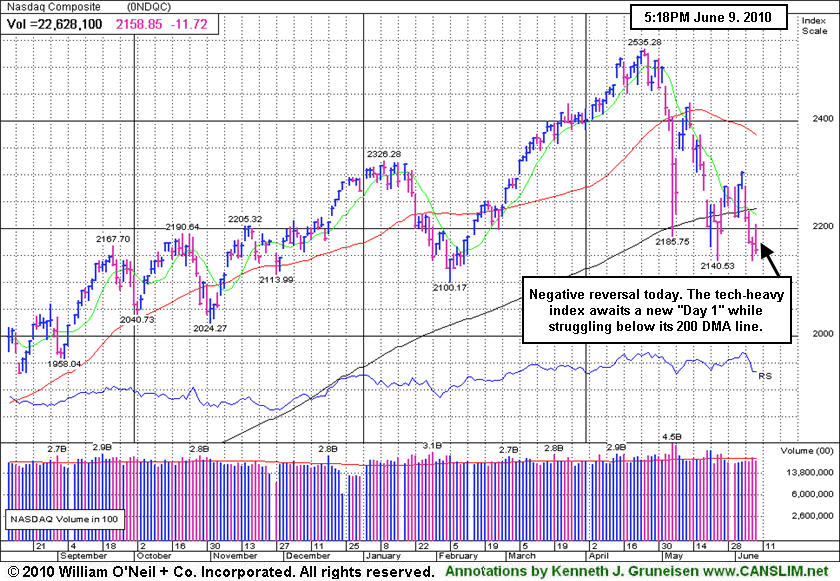
The major averages negatively reversed (opened higher and closed lower) which illustrates how weak this market actually is. Volume, an important indicator of institutional sponsorship, was reported lighter than Tuesday's levels on the Nasdaq exchange while higher volume was reported on the NYSE. Advancers and decliners were very evenly mixed on the NYSE and on the Nasdaq exchange. There were only 5 high-ranked companies from the CANSLIM.net Leaders List that made a new 52-week high and appeared on the CANSLIM.net BreakOuts Page, higher than the 3 issues that appeared on the prior session. New 52-week highs were outnumbered by new 52-week lows on the NYSE and on the Nasdaq exchange.
Investors dumped stocks after the Federal Reserve released its Beige Book. The Fed survey said economic growth was "modest" which worried investors. The Beige Book which is published two weeks before a Fed meeting said, "Economic activity continued to improve since the last report across all 12 Federal Reserve Districts, although many Districts described the pace of growth as ‘modest.’” Elsewhere, a slew of energy and financial stocks tanked which dragged the major averages lower.
In addition to studying the price and volume action of the major averages it is very important to analyze how leading stocks are performing. Since the beginning of May, leadership (new highs) dried up, which bodes poorly for the health of this market. In addition, the number of high-ranked stocks that are considered "healthy" in this market has decreased markedly. That, coupled with the ominous action in the major averages, played a pivotal role in our 5-week defensive stance. Furthermore, the fact that the major averages can not rally for at latest twenty four hours, even after finding support near last month's lows on Tuesday, suggests the bears remain in control.
The benchmark S&P 500 Index marked Day 11 of its current rally attempt while narrowly avoiding undercutting its 5/25/10 low thus far. The Dow Jones Industrial Average marked Day 2 of its latest rally attempt. From our vantage point, the latest rally effort has lacked substance, evidenced by the poor action in the major averages in recent sessions. Furthermore, the author of "How To Make Money In Stocks", the book that explains the fact-based investment system, has observed in the past that a market should not be considered to be in "healthy" shape unless at least 2 of the 3 major averages are trading above their rising 200-day moving average (DMA) lines. As of Wednesday's close, The Nasdaq Composite, Dow Jones Industrial Average, S&P 500 and small-cap Russell 2000 Index unanimously closed below their respective 200 DMA lines. Therefore, the bears will likely remain in control until these popular averages close above those important levels.
Professional Money Management Services - Free Portfolio Review:
If your portfolio is greater than $100,000 and you would like a free portfolio review, click here to get connected with one of our portfolio managers. ** Serious inquires only, please.
PICTURED: The Nasdaq Composite Index's negative reversal leaves it still awaiting "Day 1" of a new rally attempt while struggling under its 200 DMA line.
|
|
|
 |
Integrated Oil Index A Standout Decliner Giving Bearish Signal
Kenneth J. Gruneisen - Passed the CAN SLIM® Master's Exam
The Retail Index ($RLX +0.03%) was a standout by simply holding its ground, but influential financial shares slumped as the Broker/Dealer Index ($XBD -1.01%) and Bank Index ($BKX -0.84%) suffered modest losses. The Semiconductor Index ($SOX -0.75%) and other tech indexes also ended slightly lower as the Biotechnology Index ($BTK -0.35%), Internet Index ($IIX -0.17%), and Networking Index ($NWX -0.14%) each lost less than half of one percent. Defensive groups offered safe haven investors no relief from the market's ills as the Gold & Silver Index ($XAU -1.22%), Healthcare Index ($HMO -0.55%) and Oil Services Index ($OSX -0.57%) also drifted lower.
Charts courtesy www.stockcharts.com

PICTURED: The Integrated Oil Index ($XOI -3.16%) was a standout decliner as it fell to its lowest level since July 2009. Its 50-day and 200-day moving average lines recently crossed over, giving a bearish indication. A bullish crossover in June of 2009 was followed by months of upward progress. Anadarko Petroleum Corporation (APC -18.62%) and BP Plc (BP -15.80%) were the two worst decliners among the index's 13 components.
| Oil Services |
$OSX |
162.62 |
-0.94 |
-0.57% |
-16.57% |
| Healthcare |
$HMO |
1,478.92 |
-8.23 |
-0.55% |
+0.41% |
| Integrated Oil |
$XOI |
884.40 |
-28.82 |
-3.16% |
-17.21% |
| Semiconductor |
$SOX |
332.06 |
-2.52 |
-0.75% |
-7.74% |
| Networking |
$NWX |
222.33 |
-0.31 |
-0.14% |
-3.78% |
| Internet |
$IIX |
229.41 |
-0.39 |
-0.17% |
-1.90% |
| Broker/Dealer |
$XBD |
103.15 |
-1.06 |
-1.01% |
-10.34% |
| Retail |
$RLX |
422.25 |
+0.11 |
+0.03% |
+2.71% |
| Gold & Silver |
$XAU |
172.43 |
-2.13 |
-1.22% |
+2.48% |
| Bank |
$BKX |
47.18 |
-0.40 |
-0.84% |
+10.47% |
| Biotech |
$BTK |
1,017.19 |
-3.53 |
-0.35% |
+7.97% |
|
|
|
 |
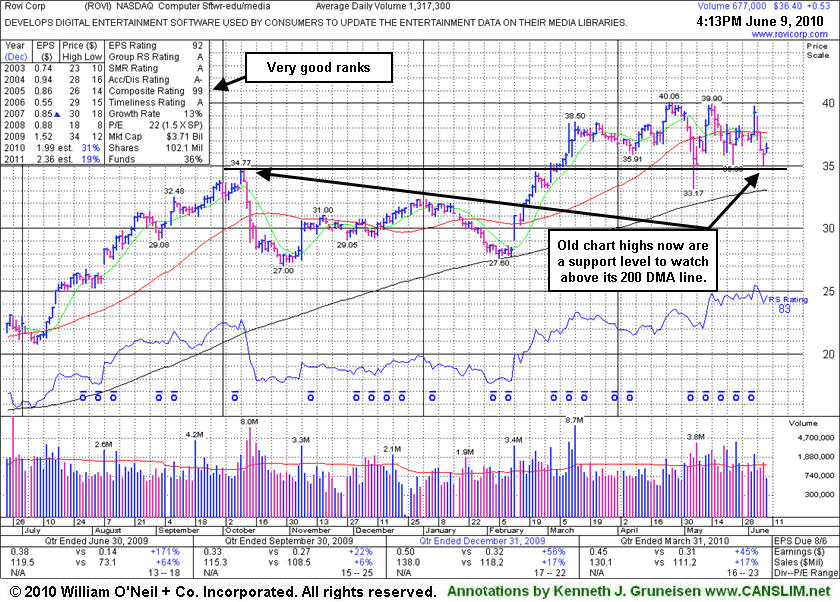
Old Chart High A Support Level Above 200-Day Average
Kenneth J. Gruneisen - Passed the CAN SLIM® Master's Exam
Rovi Corp (ROVI +$0.58 or +1.62% to $36.45) traded up on lighter volume today. Concerns increase the longer it continues to linger under its 50-day moving average (DMA) line. Meanwhile, its old chart high ($34.77) is now a support level to watch above its 200 DMA line. Its 50 DMA line may now act as resistance, while a convincing gain above that important short-term average line would help its outlook improve. There is not a great deal of resistance due to overhead supply while it is trading about -9% off its 52-week high. It makes a good candidate to have on investors' watch list until a new confirmed rally, meanwhile broader market action (M criteria) may be expected to adversely impact 3 out of 4 stocks.
Its 4/23/10 gain for a new all-time high helped it clear a fresh base but was noted as it lacked sufficient volume to trigger a proper new technical buy signal. Earlier, ROVI had triggered a technical buy signal with a high-volume gain on 3/02/10 that may have signaled the beginning of a substantial advance, but thus far it made limited progress. Earnings per share increases in 3 of the past 4 quarterly comparisons versus the year ago period showed better than +25% growth.
|
|
|
Color Codes Explained :
Y - Better candidates highlighted by our
staff of experts.
G - Previously featured
in past reports as yellow but may no longer be buyable under the
guidelines.
***Last / Change / Volume data in this table is the closing quote data***
Symbol/Exchange
Company Name
Industry Group |
PRICE |
CHANGE
(%Change) |
Day High |
Volume
(% DAV)
(% 50 day avg vol) |
52 Wk Hi
% From Hi |
Featured
Date |
Price
Featured |
Pivot Featured |
|
Max Buy |
APEI
-
NASDAQ
American Public Educ Inc
DIVERSIFIED SERVICES - Education and Training Services
|
$45.50
|
-0.64
-1.39% |
$46.75
|
222,408
149.47% of 50 DAV
50 DAV is 148,800
|
$48.17
-5.54%
|
6/7/2010
|
$46.60
|
PP = $46.29
|
|
MB = $48.60
|
 Most Recent Note - 6/9/2010 5:41:17 PM
Y - Pulled back today with lighter but still above average volume, slumping below its pivot point toward its 50 DMA line. Finished in the lower half of its intra-day range, yet its 6/07/10 gain and close above its pivot point with above average volume triggered a technical buy signal. 
>>> The latest Featured Stock Update with an annotated graph appeared on 9/17/2008. Click here.
View all notes |
Alert me of new notes |
CANSLIM.net Company Profile |
SEC |
Zacks Reports |
StockTalk |
News |
Chart |
Request a new note
C
A N
S L
I M


|
BIDU
-
NASDAQ
Baidu Inc Ads
INTERNET - Internet Information Providers
|
$67.40
|
-3.09
-4.38% |
$72.34
|
14,855,410
99.26% of 50 DAV
50 DAV is 14,966,000
|
$82.29
-18.09%
|
1/13/2010
|
$43.13
|
PP = $42.68
|
|
MB = $44.81
|
Most Recent Note - 6/9/2010 3:41:35 PM
G - After gapping up today it has negatively reversed and slumped near its 50 DMA line. A worrisome negative reversal from its all-time high on 5/13/10 followed a 10:1 stock split.
>>> The latest Featured Stock Update with an annotated graph appeared on 6/1/2010. Click here.
View all notes |
Alert me of new notes |
CANSLIM.net Company Profile |
SEC |
Zacks Reports |
StockTalk |
News |
Chart |
Request a new note
C
A N
S L
I M
|
BRLI
-
NASDAQ
Bio Reference Labs Inc
HEALTH SERVICES - Medical Laboratories and Researc
|
$22.50
|
-0.11
-0.49% |
$23.30
|
108,867
56.03% of 50 DAV
50 DAV is 194,300
|
$24.67
-8.81%
|
2/12/2010
|
$39.02
|
PP = $20.49
|
|
MB = $21.51
|
Most Recent Note - 6/9/2010 3:44:10 PM
G - After a strong start today it has negatively reversed, slumping back under its 50 DMA line which is now acting as resistance. It remains trading below its 50 DMA line. Consolidating for about 7 weeks since a 2:1 stock split effective on 4/22/10.
>>> The latest Featured Stock Update with an annotated graph appeared on 5/26/2010. Click here.
View all notes |
Alert me of new notes |
CANSLIM.net Company Profile |
SEC |
Zacks Reports |
StockTalk |
News |
Chart |
Request a new note
C
A N
S L
I M
|
CRM
-
NYSE
Salesforce.Com Inc
INTERNET - Internet Software and Services
|
$89.02
|
+1.02
1.16% |
$91.93
|
2,425,013
101.94% of 50 DAV
50 DAV is 2,378,800
|
$96.35
-7.61%
|
6/2/2010
|
$88.44
|
PP = $89.60
|
|
MB = $94.08
|
Most Recent Note - 6/9/2010 3:49:42 PM
Y - Gapped up today, trading near its pivot point. Prior highs in the $89 area are an important support level to watch. A negative reversal on 6/04/10 after reaching a new all-time high followed its "breakaway gap" on 6/03/10 that triggered a technical buy signal.
>>> The latest Featured Stock Update with an annotated graph appeared on 6/2/2010. Click here.
View all notes |
Alert me of new notes |
CANSLIM.net Company Profile |
SEC |
Zacks Reports |
StockTalk |
News |
Chart |
Request a new note
C
A N
S L
I M
|
LOPE
-
NASDAQ
Grand Canyon Education
DIVERSIFIED SERVICES - Education and; Training Services
|
$23.59
|
+0.01
0.04% |
$24.02
|
258,064
60.22% of 50 DAV
50 DAV is 428,500
|
$28.46
-17.11%
|
4/13/2010
|
$27.71
|
PP = $27.33
|
|
MB = $28.70
|
Most Recent Note - 6/9/2010 3:52:35 PM
G - Holding its ground quietly today -17% off its 52-week high after the violation or prior chart lows on 6/07/10 raised concerns.
>>> The latest Featured Stock Update with an annotated graph appeared on 5/27/2010. Click here.
View all notes |
Alert me of new notes |
CANSLIM.net Company Profile |
SEC |
Zacks Reports |
StockTalk |
News |
Chart |
Request a new note
C
A N
S L
I M
|
Symbol/Exchange
Company Name
Industry Group |
PRICE |
CHANGE
(%Change) |
Day High |
Volume
(% DAV)
(% 50 day avg vol) |
52 Wk Hi
% From Hi |
Featured
Date |
Price
Featured |
Pivot Featured |
|
Max Buy |
MELI
-
NASDAQ
Mercadolibre Inc
INTERNET - Internet Software and; Services
|
$53.16
|
+1.51
2.92% |
$54.83
|
751,970
110.99% of 50 DAV
50 DAV is 677,500
|
$56.16
-5.34%
|
5/13/2010
|
$54.21
|
PP = $55.85
|
|
MB = $58.64
|
Most Recent Note - 6/9/2010 3:54:04 PM
Y - Perched -5% off its 52-week high after finding support at its 50 DMA line this week. Its latest rally effort fell short of producing a powerful gain above its pivot point with volume sufficient to trigger a proper technical buy signal.
>>> The latest Featured Stock Update with an annotated graph appeared on 5/28/2010. Click here.
View all notes |
Alert me of new notes |
CANSLIM.net Company Profile |
SEC |
Zacks Reports |
StockTalk |
News |
Chart |
Request a new note
C
A N
S L
I M
|
ROVI
-
NASDAQ
Rovi Corp
COMPUTER SOFTWARE andamp; SERVICES - Security Software andamp; Services
|
$36.45
|
+0.58
1.62% |
$36.81
|
853,695
64.78% of 50 DAV
50 DAV is 1,317,900
|
$40.06
-9.01%
|
6/3/2010
|
$38.70
|
PP = $40.16
|
|
MB = $42.17
|
Most Recent Note - 6/9/2010 3:57:09 PM
G - Up on light volume today, concerns increase the longer it continues to linger under its 50 DMA line. Meanwhile it has been testing support near recent lows. It would need to rally back above its short-term average for its outlook to improve.
>>> The latest Featured Stock Update with an annotated graph appeared on 6/9/2010. Click here.
View all notes |
Alert me of new notes |
CANSLIM.net Company Profile |
SEC |
Zacks Reports |
StockTalk |
News |
Chart |
Request a new note
C
A N
S L
I M
|
SUMR
-
NASDAQ
Summer Infant Inc
CONSUMER NON-DURABLES - Personal Products
|
$6.64
|
+0.09
1.37% |
$6.91
|
93,507
127.92% of 50 DAV
50 DAV is 73,100
|
$8.42
-21.14%
|
5/4/2010
|
$6.85
|
PP = $7.09
|
|
MB = $7.44
|
Most Recent Note - 6/9/2010 4:01:02 PM
G - Ending near the session low today. The 6/08/10 violations of prior chart highs and its 50 DMA line triggered technical sell signals. Only a prompt rebound back above its short-term average would help its outlook.
>>> The latest Featured Stock Update with an annotated graph appeared on 6/8/2010. Click here.
View all notes |
Alert me of new notes |
CANSLIM.net Company Profile |
SEC |
Zacks Reports |
StockTalk |
News |
Chart |
Request a new note
C
A N
S L
I M
|
THOR
-
NASDAQ
Thoratec Corp
HEALTH SERVICES - Medical Instruments and Supplies
|
$42.68
|
+0.36
0.85% |
$43.96
|
700,990
78.01% of 50 DAV
50 DAV is 898,600
|
$46.50
-8.22%
|
6/3/2010
|
$44.38
|
PP = $45.35
|
|
MB = $47.62
|
Most Recent Note - 6/9/2010 4:03:49 PM
Y - Closed near the session low after early gains today. Consolidating well above its 50 DMA line while about -9% off its 52 week high. Losses entirely erased its latest breakout.
>>> The latest Featured Stock Update with an annotated graph appeared on 6/3/2010. Click here.
View all notes |
Alert me of new notes |
CANSLIM.net Company Profile |
SEC |
Zacks Reports |
StockTalk |
News |
Chart |
Request a new note
C
A N
S L
I M
|
ULTA
-
NASDAQ
Ulta Salon Cosm & Frag
SPECIALTY RETAIL - Specialty Retail, Other
|
$21.90
|
+0.48
2.24% |
$22.16
|
930,243
218.52% of 50 DAV
50 DAV is 425,700
|
$26.00
-15.77%
|
5/28/2010
|
$25.58
|
PP = $25.86
|
|
MB = $27.15
|
Most Recent Note - 6/9/2010 4:06:29 PM
G - Halted its slide with a gain today on higher volume. Concerns remain while it continues to linger below its 50 DMA line. After encountering distributional pressure it is currently -16% off its 52-week high, trading near its prior chart lows that define important chart support in the $21 area.
>>> The latest Featured Stock Update with an annotated graph appeared on 6/7/2010. Click here.
View all notes |
Alert me of new notes |
CANSLIM.net Company Profile |
SEC |
Zacks Reports |
StockTalk |
News |
Chart |
Request a new note
C
A N
S L
I M
|
Symbol/Exchange
Company Name
Industry Group |
PRICE |
CHANGE
(%Change) |
Day High |
Volume
(% DAV)
(% 50 day avg vol) |
52 Wk Hi
% From Hi |
Featured
Date |
Price
Featured |
Pivot Featured |
|
Max Buy |
|
|
|
THESE ARE NOT BUY RECOMMENDATIONS!
Comments contained in the body of this report are technical
opinions only. The material herein has been obtained
from sources believed to be reliable and accurate, however,
its accuracy and completeness cannot be guaranteed.
This site is not an investment advisor, hence it does
not endorse or recommend any securities or other investments.
Any recommendation contained in this report may not
be suitable for all investors and it is not to be deemed
an offer or solicitation on our part with respect to
the purchase or sale of any securities. All trademarks,
service marks and trade names appearing in this report
are the property of their respective owners, and are
likewise used for identification purposes only.
This report is a service available
only to active Paid Premium Members.
You may opt-out of receiving report notifications
at any time. Questions or comments may be submitted
by writing to Premium Membership Services 665 S.E. 10 Street, Suite 201 Deerfield Beach, FL 33441-5634 or by calling 1-800-965-8307
or 954-785-1121.
|
|
|


