You are not logged in.
This means you
CAN ONLY VIEW reports that were published prior to Monday, April 14, 2025.
You
MUST UPGRADE YOUR MEMBERSHIP if you want to see any current reports.
AFTER MARKET UPDATE - TUESDAY, JUNE 9TH, 2009
Previous After Market Report Next After Market Report >>>
|
|
|
|
DOW |
-1.43 |
8,763.06 |
-0.02% |
|
Volume |
1,060,033,810 |
-2% |
|
Volume |
2,173,317,760 |
+9% |
|
NASDAQ |
+17.73 |
1,860.13 |
+0.96% |
|
Advancers |
1,816 |
58% |
|
Advancers |
1,636 |
57% |
|
S&P 500 |
+3.29 |
942.43 |
+0.35% |
|
Decliners |
1,190 |
38% |
|
Decliners |
1,072 |
37% |
|
Russell 2000 |
+3.14 |
527.93 |
+0.60% |
|
52 Wk Highs |
11 |
|
|
52 Wk Highs |
38 |
|
|
S&P 600 |
+1.47 |
279.15 |
+0.53% |
|
52 Wk Lows |
3 |
|
|
52 Wk Lows |
7 |
|
|
 |
Nasdaq Leads Peers, Underpinned By Tech Sector Gains
Adam Sarhan, Contributing Writer,
The major averages ended higher after a healthy Treasury auction and news that the government allowed several banks to repay TARP funds. Advancers led decliners by approximately a 3-to-2 ratio on the NYSE and on the Nasdaq exchange. Volume was reported higher than the prior session on the Nasdaq exchange, which indicated that large institutional investors were buying stocks, however there was a slightly lower volume total reported for the NYSE. There were 11 high-ranked companies from the CANSLIM.net Leaders List that made a new 52-week high and appeared on the CANSLIM.net BreakOuts Page, higher than the 8 issues that appeared on the prior session. The greater expansion recently occurring in the new highs list has offered encouraging news for growth oriented investors.
Stocks ended higher after the government released a list of banks that are allowed to repay funds borrowed via the Troubled Asset Relief Program (TARP). Treasury Secretary Timothy Geithner released a statement that said "These repayments are an encouraging sign of financial repair." He also acknowledged that "we still have work to do.” Tuesday's decision to allow some of the banks to repay TARP funds was largely due to the recent bounce in equity markets along with the banks' ability to raise funds by selling additional shares. The latest data shows that US banks have raised more than $100 billion since the government "stress test" results were announced.
The major averages caught a bid after the Treasury's successful auction of short term notes today. It is encouraging to see the major averages to continue bouncing following the worst annual decline since the Great Depression. So far, the government has pledged $12.8 trillion to end the first global recession since World War II. Currently, the benchmark S&P 500 Index has a price/earnings (P/E) ratio at about 14.8, which is not "low" on a longer-term historical basis. The average P/E ratio for the past decade has been 19.9. During prior bear market lows, the P/E for the S&P 500 Index hovered near 10 or in the low teens.
PICTURED: The S&P 500 Index is building a base-on-base type pattern.
|
|
|
 |
Tech and Energy Shares Rise
Kenneth J. Gruneisen - Passed the CAN SLIM® Master's Exam
The tech sector and the energy group helped boost the major averages on Tuesday, meanwhile lackluster action in most other areas and weakness in the Healthcare ($HMO -1.65%) group offset some of the gains. The Oil Services ($OSX +2.18%) and Integrated Oil ($XOI +0.83%) indexes rose. The Bank Index ($BKX +0.45%) and Broker/Dealer Index ($XBD -0.17%) posted mixed results and were little changed on the session, and the Gold & Silver Index ($XAU +0.03%) was virtually unchanged. Positive action from the Retail Index ($RLX +0.82%) and tech shares also helped the major averages. The Biotechnology ($BTK +1.16%), Internet ($IIX +1.34%), and Networking ($NWX +1.92%) indexes each posted better than +1% gains.
Charts courtesy www.stockcharts.com
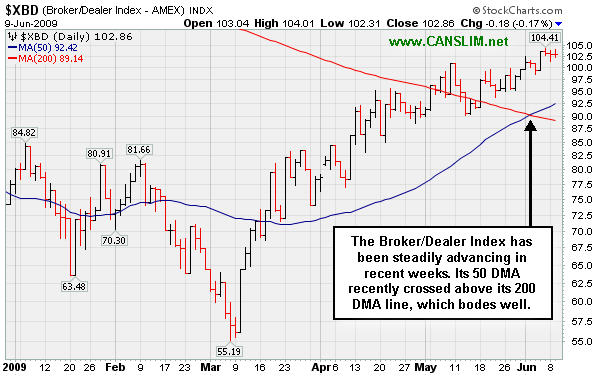
PICTURED 1: The Broker/Dealer Index ($XBD -0.17%) is one of the highly influential financial indexes which recently saw its 50-day moving average (DMA) and 200 DMA lines converge, and that type of bullish crossover generally bodes well. Financial stocks have been relatively calm in recent weeks while steadily advancing, unlike the wild whipsaw action investors saw in recent months -marked by several daily swings of more than 10% up or down!
Charts courtesy www.stockcharts.com
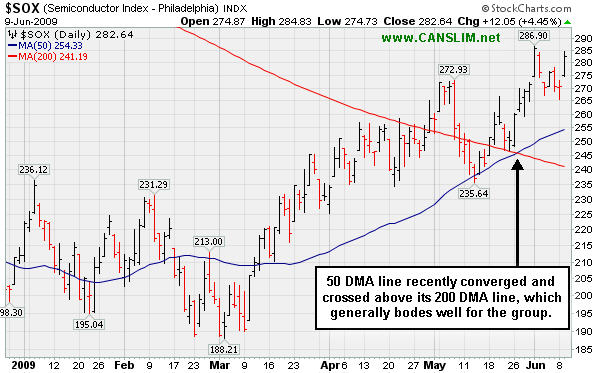
PICTURED 2: The Semiconductor Index ($SOX +4.45%) gapped up while numerous chip stocks posted solid gains, helping the tech-heavy Nasdaq Composite Index outpace its peers. Marvell Technology Group Ltd. (MRVL +14.54%) was a standout gainer among the index's components after increasing the size of its previously announced first-quarter net loss to reflect a $72 million settlement of a shareholder lawsuit. This is yet another of several recent examples where stocks have been able to shrug of negative news headlines and rally. This kind of action suggests that after the latest Bear Market most of the "bad news" is already factored into current market prices. Stocks' ability to rally in the face of bad news is a characteristic typical of a healthier bullish market (the M criteria) environment.
| Oil Services |
$OSX |
181.22 |
+3.87 |
+2.18% |
+49.29% |
| Healthcare |
$HMO |
1,046.42 |
-17.59 |
-1.65% |
+8.98% |
| Integrated Oil |
$XOI |
987.80 |
+8.11 |
+0.83% |
+0.83% |
| Semiconductor |
$SOX |
282.64 |
+12.05 |
+4.45% |
+33.21% |
| Networking |
$NWX |
195.52 |
+3.68 |
+1.92% |
+35.88% |
| Internet |
$IIX |
194.05 |
+2.56 |
+1.34% |
+45.06% |
| Broker/Dealer |
$XBD |
102.86 |
-0.18 |
-0.17% |
+32.77% |
| Retail |
$RLX |
338.78 |
+2.75 |
+0.82% |
+21.31% |
| Gold & Silver |
$XAU |
151.13 |
+0.05 |
+0.03% |
+22.03% |
| Bank |
$BKX |
37.72 |
+0.17 |
+0.45% |
-14.89% |
|
|
|
 |
No Recent Base For Leader Hitting New 52-Week Highs
Kenneth J. Gruneisen - Passed the CAN SLIM® Master's Exam
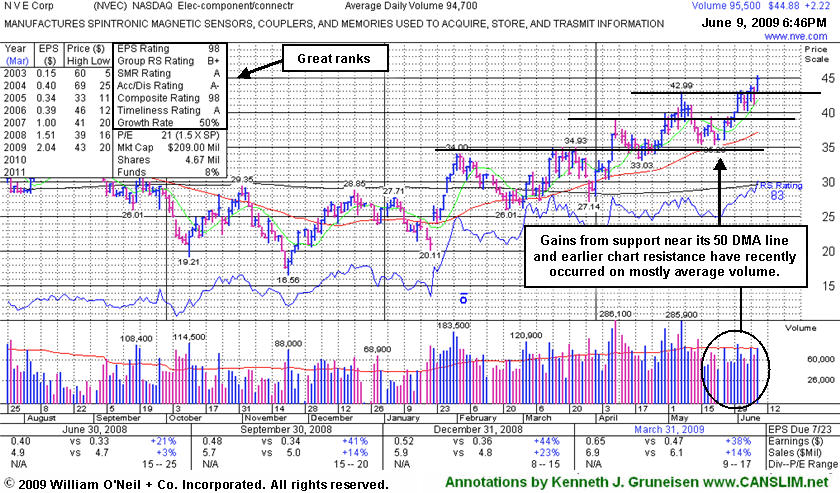
NVE Corp (NVEC +$2.22 or +5.20% to $44.88) has encountered no distributional pressure in recent weeks while gains on near average volume have boosted it to new 52-week highs. It is extended from a sound base now, making it a riskier choice for followers of the investment system. Usually a sound base needs to be formed over a period of at least 5-weeks minimum. Advanced chart patterns can occasionally offer valid entry points in a shorter span, but these brief consolidations must occur in a very tight trading range. During its most recent consolidation, NVEC dipped almost -18% from its $42.99 high. Thus, it would not be considered a "three weeks tight" type of pattern.
After any stock is bought, the system's sell rules kick in if it falls more than 7-8%, prompting investors to limit losses before they might become more devastating. This strict discipline may be especially important because of the very small supply of shares outstanding in this specific company. A small supply of shares is generally considered a good sign with respect to the S criteria, yet could contribute to great volatility in the event of institutional accumulation or distribution. NVEC has traded up as much as +33.85% since it was first featured in yellow at $33.85 in the Friday, March 13, 2009 Mid-Day Breakouts Report (read here).
Its 50-day moving average line is an important support level to watch now. Earnings per share rose +38% in the period ended March 31, 2009 versus the year ago quarter, yet sales were up just +14% and, as previously noted, the company's sales revenues thus far have been rather minuscule. At less than $7 million per quarter in each of the past 8 quarters, sales have growing at a mostly lackluster pace percentage-wise. Companies reporting more substantial sales revenues generally make more reliable buy candidates, while companies with little "meat on the bone" can be particularly vulnerable to bad stumbles, fundamentally and technically. Nonetheless, this high-ranked Electronics - Components leader has a good quarterly and annual earnings growth history (C & A criteria), and recent quarters showed sales revenues accelerating. No resistance remains due to overhead supply.
|
|
|
Color Codes Explained :
Y - Better candidates highlighted by our
staff of experts.
G - Previously featured
in past reports as yellow but may no longer be buyable under the
guidelines.
***Last / Change / Volume quote data in this table corresponds with the timestamp on the note***
Symbol/Exchange
Company Name
Industry Group |
Last |
Chg. |
Vol
% DAV |
Date Featured |
Price Featured |
Latest Pivot Point
Featured |
Status |
| Latest Max Buy Price |
GMCR
- NASDAQ
Green Mtn Coffee Roastrs
FOOD & BEVERAGE - Processed & Packaged Goods
|
$61.50
|
N/A
|
N/A
N/A
|
1/1/2008
(Date
Featured) |
$27.13
(Price
Featured) |
PP = $28.66 |
G |
| MB = $30.09 |
Most Recent Note - 6/9/2009
G - Do not be confused by the 3:2 stock split effective today. GMCR has traded up more than +138% since appearing with an annotated graph under the headline "It May Soon Be Time To Go Green" when featured in the January 2009 CANSLIM.net News (read here). It is now easier than ever to review prior coverage on current high-ranked leaders via CANSLIM.net's revamped Featured Stock Profile pages. Simply click the company name or links to Company Profile. Thanks to the support of CANSLIM.net's active members, more improvements are coming soon!
>>> The latest Featured Stock Update with an annotated graph appeared on 6/8/2009. click here.
|
|
C
A
S
I |
News |
Chart |
SEC
View all notes Alert
me of new notes
Company
Profile
|
HMSY
- NASDAQ
H M S Holdings Corp
COMPUTER SOFTWARE & SERVICES - Healthcare Information Service
|
$36.00
|
N/A
|
N/A
N/A
|
2/20/2009
(Date
Featured) |
$34.08
(Price
Featured) |
PP = $36.55 |
Y |
| MB = $38.38 |
Most Recent Note - 6/9/2009 6:31:59 PM
Y - Still quietly consolidating in a tight range near all-time highs since gapping up on 6/01/09. No overhead supply is left to hinder the progress for this Commercial Services - Healthcare firm.
>>> The latest Featured Stock Update with an annotated graph appeared on 5/28/2009. click here.
|
|
C
A
S
I |
News |
Chart |
SEC
View all notes Alert
me of new notes
Company
Profile
|
ILMN
- NASDAQ
Illumina Inc
DRUGS - Biotechnology
|
$38.32
|
N/A
|
N/A
N/A
|
5/3/2009
(Date
Featured) |
$38.14
(Price
Featured) |
PP = $39.05 |
Y |
| MB = $41.00 |
Most Recent Note - 6/9/2009 6:33:35 PM
Y - Its Relative Strength rank has slumped to 61, raising concerns while consolidating in a very tight trading range for more than 3 months. Recently found support near its 50 DMA line. Disciplined investors will watch for confirming gains above its pivot point to trigger a proper technical buy signal before taking any action. Recently featured in the May 2009 issue of CANSLIM.net News (read here).
>>> The latest Featured Stock Update with an annotated graph appeared on 5/29/2009. click here.
|
|
C
A
S
I |
News |
Chart |
SEC
View all notes Alert
me of new notes
Company
Profile
|
LFT
-
|
$29.40
|
N/A
|
N/A
N/A
|
4/2/2009
(Date
Featured) |
$22.19
(Price
Featured) |
PP = $21.81 |
G |
| MB = $22.90 |
Most Recent Note - 6/9/2009 6:34:50 PM
G - Holding its ground since hitting a new 52-week high on 6/05/09 as it rose from a choppy (improper) base pattern. Its progress could be hindered by future share offerings. Its 5/28/09 gap up and considerable gain followed another strong quarterly financial report. Prompt repair of its recent 50 DMA line violation, and its gap up, were noted as signs of solid institutional (the I criteria) support and buying demand. This Chinese Computer Software firm recently filed a registration of approximately 16 million shares for resale, and it also revealed a planned acquisition of another Chinese service provider.
>>> The latest Featured Stock Update with an annotated graph appeared on 6/4/2009. click here.
|
|
C
A
S
I |
News |
Chart |
SEC
View all notes Alert
me of new notes
Company
Profile
|
NTES
- NASDAQ
Netease Inc Adr
INTERNET - Internet Information Providers
|
$38.22
|
N/A
|
N/A
N/A
|
5/21/2009
(Date
Featured) |
$31.19
(Price
Featured) |
PP = $32.75 |
G |
| MB = $34.39 |
Most Recent Note - 6/9/2009 6:35:50 PM
G - Currently extended from its second-stage base. Its 5/28/09 gap up and considerable gain with +79% above average volume confirmed a technical buy signal as it rose above its pivot point. Indications of institutional (the I criteria) buying demand have been noted after earnings news on 5/20/09 a shakeout tested support near its 50 DMA line. First featured at $26.75 in the 3/31/09 CANSLIM.net Mid-Day Breakouts Report (read here). This high-ranked Chinese Internet - Content firm was also summarized in greater detail including an annotated graph in the April 2009 issue of CANSLIM.net News (read here).
>>> The latest Featured Stock Update with an annotated graph appeared on 6/5/2009. click here.
|
|
C
A
S
I |
News |
Chart |
SEC
View all notes Alert
me of new notes
Company
Profile
|
NVEC
- NASDAQ
N V E Corp
ELECTRONICS - Semiconductor - Specialized
|
$44.88
|
N/A
|
N/A
N/A
|
3/13/2009
(Date
Featured) |
$33.85
(Price
Featured) |
PP = $39.01 |
G |
| MB = $40.96 |
Most Recent Note - 6/9/2009 6:36:59 PM
G - Gain on average volume today for a new 52-week high. It recently found support at its 50 DMA line. Earnings per share rose +38% over the year ago period, yet sales were up just +14% and still rather minuscule.
>>> The latest Featured Stock Update with an annotated graph appeared on 6/9/2009. click here.
|
|
C
A
S
I |
News |
Chart |
SEC
View all notes Alert
me of new notes
Company
Profile
|
SNDA
-
|
$63.66
|
N/A
|
N/A
N/A
|
5/31/2009
(Date
Featured) |
$57.62
(Price
Featured) |
PP = $53.95 |
G |
| MB = $56.65 |
Most Recent Note - 6/9/2009 6:38:17 PM
G - Gain today on average volume for a new high close, too extended from a sound base to be considered buyable under the proper guidelines. Patient investors may watch for a pullback near its 50 DMA line, an important support level which has not been tested since breaking out in March. Just featured in the June 2009 issue of CANSLIM.net News. Be sure to review the "What to Look Out For" section and entire detailed summary - read here).
>>> The latest Featured Stock Update with an annotated graph appeared on 6/3/2009. click here.
|
|
C
A
S
I |
News |
Chart |
SEC
View all notes Alert
me of new notes
Company
Profile
|
SYNA
- NASDAQ
Synaptics Inc
COMPUTER SOFTWARE & SERVICES - Information Technology Service
|
$40.10
|
N/A
|
N/A
N/A
|
5/18/2009
(Date
Featured) |
$32.58
(Price
Featured) |
PP = $34.52 |
G |
| MB = $36.25 |
Most Recent Note - 6/9/2009 6:40:17 PM
G - Considerable gain today backed by more than twice average volume as it hit another new 52-week high. Approaching its all-time highs near $41, which are mostly a psychological resistance level now, since little overhead supply exists. First featured in yellow in the May 18, 2009 mid-day report (read here). The number of top-rated funds owning its shares rose from 123 in June '08 to 188 in March '09, which is good news concerning the I criteria. Its annual earnings (the A criteria) history showed a dowturn in 2006, leaving concerns, but it followed that up with strong growth the next 2 years. Its small supply of shares (the S criteria) outstanding could contribute to especially great volatility in the event of institutional accumulation or distribution.
>>> The latest Featured Stock Update with an annotated graph appeared on 6/1/2009. click here.
|
|
C
A
S
I |
News |
Chart |
SEC
View all notes Alert
me of new notes
Company
Profile
|
TNDM
- NASDAQ
Tandem Diabetes Care Inc
TELECOMMUNICATIONS - Wireless Communications
|
$30.27
|
N/A
|
N/A
N/A
|
3/2/2009
(Date
Featured) |
$18.89
(Price
Featured) |
PP = $29.85 |
Y |
| MB = $31.34 |
Most Recent Note - 6/9/2009 6:46:20 PM
Y - Small gain today on very light volume followed a heavy distribution day which raised concerns, yet it has managed to avoid closing below its 5/01/09 close which would completely negate its latest technical breakout. It found prompt support after deterioration under prior chart highs and an intra-day violation of its 50 DMA line, much like its impressive "positive reversal" on 5/14/09 was noted as a sign of prompt institutional support arriving. Gapped up on 4/30/09 for a new all-time high after reporting solid quarterly sales and earnings increases. Traded up as much as +72.42% since first featured at $18.89 in the 3/02/09 Mid-Day BreakOuts Report (read here).
>>> The latest Featured Stock Update with an annotated graph appeared on 6/2/2009. click here.
|
|
C
A
S
I |
News |
Chart |
SEC
View all notes Alert
me of new notes
Company
Profile
|
|
|
|
THESE ARE NOT BUY RECOMMENDATIONS!
Comments contained in the body of this report are technical
opinions only. The material herein has been obtained
from sources believed to be reliable and accurate, however,
its accuracy and completeness cannot be guaranteed.
This site is not an investment advisor, hence it does
not endorse or recommend any securities or other investments.
Any recommendation contained in this report may not
be suitable for all investors and it is not to be deemed
an offer or solicitation on our part with respect to
the purchase or sale of any securities. All trademarks,
service marks and trade names appearing in this report
are the property of their respective owners, and are
likewise used for identification purposes only.
This report is a service available
only to active Paid Premium Members.
You may opt-out of receiving report notifications
at any time. Questions or comments may be submitted
by writing to Premium Membership Services 665 S.E. 10 Street, Suite 201 Deerfield Beach, FL 33441-5634 or by calling 1-800-965-8307
or 954-785-1121.
|
|
|


