You are not logged in.
This means you
CAN ONLY VIEW reports that were published prior to Monday, April 14, 2025.
You
MUST UPGRADE YOUR MEMBERSHIP if you want to see any current reports.
AFTER MARKET UPDATE - FRIDAY, JUNE 8TH, 2012
Previous After Market Report Next After Market Report >>>
|
|
|
|
DOW |
+93.24 |
12,554.20 |
+0.75% |
|
Volume |
685,610,770 |
-20% |
|
Volume |
1,312,847,940 |
-18% |
|
NASDAQ |
+27.40 |
2,858.42 |
+0.97% |
|
Advancers |
2,130 |
68% |
|
Advancers |
1,622 |
63% |
|
S&P 500 |
+10.67 |
1,325.66 |
+0.81% |
|
Decliners |
894 |
29% |
|
Decliners |
860 |
33% |
|
Russell 2000 |
+8.85 |
769.19 |
+1.16% |
|
52 Wk Highs |
67 |
|
|
52 Wk Highs |
33 |
|
|
S&P 600 |
+4.64 |
431.02 |
+1.09% |
|
52 Wk Lows |
33 |
|
|
52 Wk Lows |
31 |
|
|
 |
Major Averages Overcame Weakness to Post Gains on Lighter Volume
Kenneth J. Gruneisen - Passed the CAN SLIM® Master's Exam
For the week, the Dow Jones Industrial Average gained +3.6%, and the S&P 500 Index rose +3.7%, and the Nasdaq Composite Index advanced +4.0%. On Friday's session the indices reversed early losses to end the session with respectable gains. However, volume totals were reported lighter than the prior session totals on the Nasdaq exchange and on the NYSE, whereas gains backed by higher volume would be a better indication that the institutional crowd was accumulating shares. Breadth was positive as advancers led decliners by more than a 2-1 ratio on the NYSE and by nearly 2-1 on the Nasdaq exchange. The total number of new 52-week highs outnumbered new 52-week lows on the NYSE and on the Nasdaq exchange for a third consecutive session. There were 33 high-ranked companies from the CANSLIM.net Leaders List made new 52-week highs and appeared on the CANSLIM.net BreakOuts Page, matching the prior session total of 33 stocks. At Friday's close there were gains for 13 of the 15 high-ranked companies currently included on the Featured Stocks Page.
German trade data came in worse-than-expected and Italian industrial production fell more than projected. On our shores, economic readings were also disappointing with the international trade gap narrowing less than expected while wholesale inventories rose more than expected in April.Despite a shaky start, stocks found their footing as investors prepared for news out of Europe and China. Over the weekend, Spain is expected to petition the European Union for a bank recapitalization bailout and China is scheduled to release a bevy of economic data.
Financial stocks showed initial weakness after the Fed revealed plans on Thursday to increase capitalization requirements. By the end of Friday's session, however, Bank of America Corp (BAC +1.89%) and Citigroup Inc (C +3.20%) had tallied solid gains. McDonald’s Corp (MCD -0.71%) was lower after posting a weaker-than-expected result in May same-store sales on slowing international sales. Also in the space, Yum Brands Inc (YUM -3.26%) fell.
There was strength in Telecom stocks as shares of AT&T (T +1.14%) and Verizon Communications Inc (VZ +1.92%) gained. Energy shares were lower as crude oil prices dipped nearly -3% intra-day, yet lower energy costs helped airlines rally, including United Continental Holdings Inc (UAL +2.49%) and U.S. Airways Group Inc (LLC +7.71%).
In bondland, Treasuries were mixed along the curve. The 10-year note was up 2 ticks to yield 1.63% and the 30-year bond gave up 1/8 of a point to yield 2.75%.
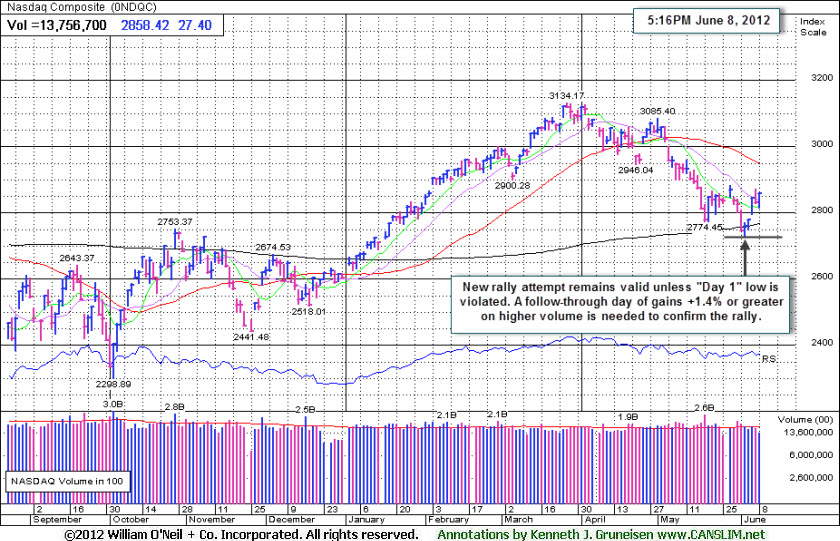
Technically, the big gains by the major averages on Wednesday's session were too soon (Day 3) in the nascent rally attempt to be considered a valid follow-through day (FTD). The expansion in leadership (new highs) and the major indices' rebounds above their respective 200-day moving average (DMA) lines with gains on higher volume were encouraging signs.
The major averages (M criteria) are technically still considered to be in a rally attempt within an ongoing correction, and stocks may still be vulnerable to greater downside. Historical studies suggest that the most constructive market rallies produced a solid follow-through day (FTD) between Days 4-7 of a new rally effort. Gains of +1.4% or greater by at least one of the major indexes should be backed by higher volume (preferably above average volume) coupled with an expansion in the number of stocks hitting new highs. Only fresh technical proof may give fact-based investors the clearance to begin with new buying efforts strictly in sound buy candidates. Meanwhile, investors should keep up a watchlist of worthy buy candidates while remaining protective of capital.
PICTURED: The Nasdaq Composite Index's rally attempt remains valid unless the "Day 1" lows are violated. Friday's session marked Day 5. Notice that the tech-heavy index also has a downward sloping 50-day moving average (DMA) line. When that short-term average has a downward slope it is fair to say the market has been struggling for a while, and disciplined investors following the fact-based investment system have likely moved much of their cash to the sidelines. This tactical approach reduces stress and protects precious capital during bearish market environments. This also helps to preserve investors' confidence so they are ready to act when a new confirmed rally eventually presents itself while less experienced investors might still be nursing their wounds.
|
 Kenneth J. Gruneisen started out as a licensed stockbroker in August 1987, a couple of months prior to the historic stock market crash that took the Dow Jones Industrial Average down -22.6% in a single day. He has published daily fact-based fundamental and technical analysis on high-ranked stocks online for two decades. Through FACTBASEDINVESTING.COM, Kenneth provides educational articles, news, market commentary, and other information regarding proven investment systems that work in good times and bad.
Comments contained in the body of this report are technical opinions only and are not necessarily those of Gruneisen Growth Corp. The material herein has been obtained from sources believed to be reliable and accurate, however, its accuracy and completeness cannot be guaranteed. Our firm, employees, and customers may effect transactions, including transactions contrary to any recommendation herein, or have positions in the securities mentioned herein or options with respect thereto. Any recommendation contained in this report may not be suitable for all investors and it is not to be deemed an offer or solicitation on our part with respect to the purchase or sale of any securities. |
|
 |
Healthcare, Financial, Tech, and Retail Indexes Rose
Kenneth J. Gruneisen - Passed the CAN SLIM® Master's Exam
The Healthcare Index ($HMO +4.81%) was a standout gainer, repairing some of its prior session's large loss. The Bank Index ($BKX +1.66%) was a positive influence on the major averages but the Broker/Dealer Index ($XBD +0.36%) could not match its gain. The Retail Index ($RLX +1.33%) erased an early loss and continually built on its gain throughout the session. The Semiconductor Index ($SOX +1.43%) and the Networking Index ($NWX +1.00%) led the tech sector higher, followed by the Internet Index ($IIX +0.86%) and the Biotechnology Index ($BTK +0.64%). The Gold & Silver Index ($XAU +0.60%) also posted a small gain, meanwhile the Integrated Oil Index ($XOI +0.05%) finished flat and the Oil Services Index ($OSX -0.56%) ended with a small loss.
Charts courtesy www.stockcharts.com
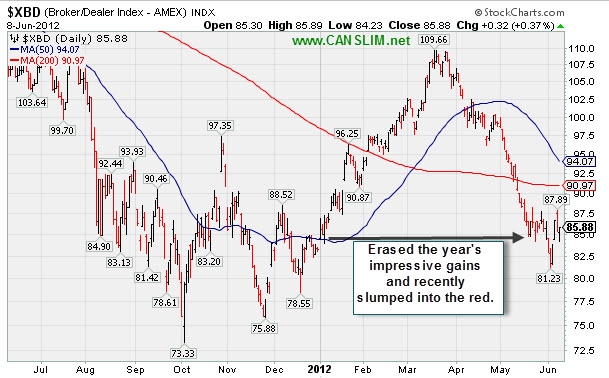
PICTURED: The Broker/Dealer Index ($XBD +0.36%) erased the year's impressive gains and recently slumped into the red.
| Oil Services |
$OSX |
201.72 |
-1.13 |
-0.56% |
-6.73% |
| Healthcare |
$HMO |
2,305.16 |
+105.72 |
+4.81% |
+1.03% |
| Integrated Oil |
$XOI |
1,125.24 |
+0.56 |
+0.05% |
-8.45% |
| Semiconductor |
$SOX |
372.73 |
+5.26 |
+1.43% |
+2.27% |
| Networking |
$NWX |
209.68 |
+2.07 |
+1.00% |
-2.55% |
| Internet |
$IIX |
299.48 |
+2.56 |
+0.86% |
+6.30% |
| Broker/Dealer |
$XBD |
85.86 |
+0.31 |
+0.36% |
+3.12% |
| Retail |
$RLX |
613.39 |
+8.08 |
+1.33% |
+17.24% |
| Gold & Silver |
$XAU |
162.10 |
+0.96 |
+0.60% |
-10.26% |
| Bank |
$BKX |
43.61 |
+0.71 |
+1.66% |
+10.74% |
| Biotech |
$BTK |
1,416.18 |
+8.94 |
+0.64% |
+29.75% |
|
|
|
 |
Wedging Higher While M Criteria Still Urges Caution
Kenneth J. Gruneisen - Passed the CAN SLIM® Master's Exam
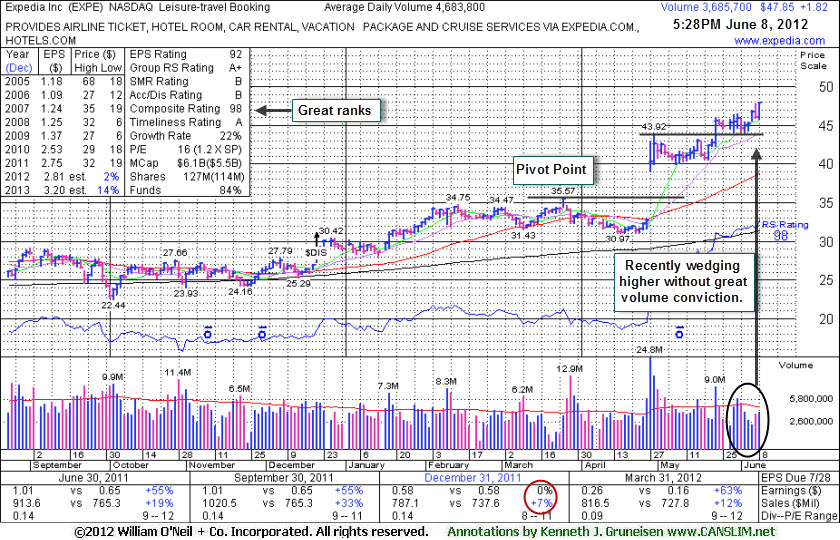
Expedia Inc (EXPE +$1.82 or +3.95% to $47.85) hit another new 52-week high today with a gain backed by below average volume. Gains into new high territory without great volume conviction are termed "wedging", which calls attention to the lack of robust buying demand from the institutional crowd. EXPE is also getting more extended from its prior highs in the $43 area. A new pivot point was not cited, yet there was a noted advanced "3-weeks tight" pattern formed during the ongoing market "correction" after its earlier breakaway gap. Disciplined investors know that the M criteria argues against any new buying efforts unless a rally has been confirmed.
Its last appearance in this FSU section was on 5/03/12 with an annotated graph under the headline, "Consolidation Following Exceptional Breakaway Gap". It had been highlighted in yellow in the 4/27/12 mid-day breakouts report (read here) after its considerable "breakaway gap" up above the pivot point cited based on its 3/26/12 high. It reported earnings +63% on +12% sales revenues for the quarter ended March 31, 2012 versus the year ago period. Quarterly earnings have been above the +25% minimum guideline in 3 of the past 4 comparisons (see the Dec '11 comparison circled in red) and its annual earnings (A criteria) history has been good. The number of top-rated funds owning its shares rose from 916 in Jun '11 to 976 in Mar '12, a reassuring sign concerning the I criteria. The Leisure - Travel Booking industry group has earned a high Group Relative Strength Rating of 96/A+, a reassuring sign concerning the L criteria.
A breakaway gap has been repeatedly noted as the one exception where the usual limit can be stretched to allow for disciplined investors to buy as much as +10% above the pivot point. Longtime readers know that the regular limit above the pivot point is +5%, and the further one chases a stock above its pivot point will increase the likelihood that an ordinary pullback of -7-8% might prompt them to sell based on the fact-based system's strict selling rules.
|
|
|
Color Codes Explained :
Y - Better candidates highlighted by our
staff of experts.
G - Previously featured
in past reports as yellow but may no longer be buyable under the
guidelines.
***Last / Change / Volume data in this table is the closing quote data***
Symbol/Exchange
Company Name
Industry Group |
PRICE |
CHANGE
(%Change) |
Day High |
Volume
(% DAV)
(% 50 day avg vol) |
52 Wk Hi
% From Hi |
Featured
Date |
Price
Featured |
Pivot Featured |
|
Max Buy |
ALXN
-
NASDAQ
Alexion Pharmaceuticals
DRUGS - Drug Manufacturers - Other
|
$92.43
|
+2.05
2.27% |
$92.57
|
1,358,537
65.98% of 50 DAV
50 DAV is 2,058,900
|
$95.01
-2.72%
|
5/1/2012
|
$91.73
|
PP = $95.11
|
|
MB = $99.87
|
Most Recent Note - 6/6/2012 6:18:47 PM
Y - Color code is changed to yellow after a 3rd consecutive gain today backed by light volume helped it rebound above its 50 DMA line. No new pivot point is being cited, and it faces near-term resistance in the $94-95 area.
>>> The latest Featured Stock Update with an annotated graph appeared on 5/31/2012. Click here.
View all notes |
Alert me of new notes |
CANSLIM.net Company Profile |
SEC |
Zacks Reports |
StockTalk |
News |
Chart |
Request a new note
C
A N
S L
I M


|
ASPS
-
NASDAQ
Altisource Ptf Sltns Sa
REAL ESTATE - Property Management/Developmen
|
$64.94
|
+1.18
1.85% |
$66.51
|
177,610
133.94% of 50 DAV
50 DAV is 132,600
|
$65.71
-1.17%
|
6/5/2012
|
$60.01
|
PP = $63.00
|
|
MB = $66.15
|
Most Recent Note - 6/6/2012 6:11:51 PM
Y - Today's 3rd consecutive gain backed by +55% above average volume helped it rally above the pivot point cited based on its 4/26/12 high. Technically it triggered a buy signal, however the major averages (M criteria) also need to confirm a new rally with a solid follow-through day before any new buying efforts are justified under the fact-based investment system.
>>> The latest Featured Stock Update with an annotated graph appeared on 6/5/2012. Click here.
View all notes |
Alert me of new notes |
CANSLIM.net Company Profile |
SEC |
Zacks Reports |
StockTalk |
News |
Chart |
Request a new note
C
A N
S L
I M
|
CERN
-
NASDAQ
Cerner Corp
COMPUTER SOFTWARE and SERVICES - Healthcare Information Service
|
$78.95
|
+0.59
0.75% |
$79.00
|
910,563
72.42% of 50 DAV
50 DAV is 1,257,300
|
$84.10
-6.12%
|
6/7/2012
|
$78.36
|
PP = $84.20
|
|
MB = $88.41
|
Most Recent Note - 6/7/2012 6:17:43 PM
Y - It has been encountering distributional pressure and the M criteria requires a FTD before any new buying efforts may be considered under the investment system's guidelines. Color code was changed to yellow and a new pivot point has been cited based on its 5/01/12 high plus 10 cents. Volume-driven gains are needed to trigger a new (or add-on) technical buy signal. See the latest FSU analysis for more details and a new annotated weekly graph.
>>> The latest Featured Stock Update with an annotated graph appeared on 6/7/2012. Click here.
View all notes |
Alert me of new notes |
CANSLIM.net Company Profile |
SEC |
Zacks Reports |
StockTalk |
News |
Chart |
Request a new note
C
A N
S L
I M
|
CMCSA
-
NASDAQ
Comcast Corp Cl A
MEDIA - CATV Systems
|
$30.27
|
+0.26
0.87% |
$30.33
|
15,217,868
116.05% of 50 DAV
50 DAV is 13,112,800
|
$30.88
-1.96%
|
5/2/2012
|
$30.04
|
PP = $30.51
|
|
MB = $32.04
|
Most Recent Note - 6/6/2012 6:16:38 PM
Y - Today's 3rd consecutive gain helped it rally above its 50 DMA line helping its technical stance improve. Color code is changed to yellow based on its resilience while no new pivot point is being cited. The prior low ($28.09 on 5/21/12) defines important near-term support to watch where further deterioration would raise more serious concerns.
>>> The latest Featured Stock Update with an annotated graph appeared on 5/7/2012. Click here.
View all notes |
Alert me of new notes |
CANSLIM.net Company Profile |
SEC |
Zacks Reports |
StockTalk |
News |
Chart |
Request a new note
C
A N
S L
I M
|
COO
-
NYSE
Cooper Companies Inc
HEALTH SERVICES - Medical Instruments and Supplies
|
$78.82
|
-1.24
-1.55% |
$79.33
|
2,431,912
504.97% of 50 DAV
50 DAV is 481,600
|
$89.31
-11.75%
|
3/9/2012
|
$83.05
|
PP = $81.02
|
|
MB = $85.07
|
Most Recent Note - 6/7/2012 3:06:37 PM
G - Due to report earnings for the quarter ended April 30, 2012 after the close today. Faces resistance due to overhead supply up through the $89 area after a damaging streak of losses recently triggered sell signals.
>>> The latest Featured Stock Update with an annotated graph appeared on 5/18/2012. Click here.
View all notes |
Alert me of new notes |
CANSLIM.net Company Profile |
SEC |
Zacks Reports |
StockTalk |
News |
Chart |
Request a new note
C
A N
S L
I M
|
Symbol/Exchange
Company Name
Industry Group |
PRICE |
CHANGE
(%Change) |
Day High |
Volume
(% DAV)
(% 50 day avg vol) |
52 Wk Hi
% From Hi |
Featured
Date |
Price
Featured |
Pivot Featured |
|
Max Buy |
DG
-
NYSE
Dollar General Corp
RETAIL - Discount, Variety Stores
|
$50.29
|
+1.31
2.67% |
$50.75
|
4,518,070
132.55% of 50 DAV
50 DAV is 3,408,500
|
$49.50
1.60%
|
5/7/2012
|
$48.51
|
PP = $47.69
|
|
MB = $50.07
|
Most Recent Note - 6/7/2012 12:06:45 PM
G - Found support near its 50 DMA line and today it is perched at its 52-week and all-time highs. Completed another Secondary Offering on 6/05/12, its 4th Secondary Offering since September '11. Reported earnings +31% on +13% sales revenues for the quarter ended April 30, 2012 versus the year ago period. The broader market (M criteria) has yet to confirm a new rally, however, and without a solid follow-through day from at least one of the major averages all new buying efforts are discouraged under the fact-based investment system.
>>> The latest Featured Stock Update with an annotated graph appeared on 5/9/2012. Click here.
View all notes |
Alert me of new notes |
CANSLIM.net Company Profile |
SEC |
Zacks Reports |
StockTalk |
News |
Chart |
Request a new note
C
A N
S L
I M
|
EXPE
-
NASDAQ
Expedia Inc
INTERNET - Internet Information Providers
|
$47.85
|
+1.82
3.95% |
$48.06
|
3,687,394
78.73% of 50 DAV
50 DAV is 4,683,800
|
$47.78
0.15%
|
4/27/2012
|
$41.80
|
PP = $35.57
|
|
MB = $37.35
|
 Most Recent Note - 6/8/2012 5:51:50 PM
G - Hit another new 52-week high today with a gain backed by below average volume, getting more extended from its prior highs in the $43 area. See the latest FSU analysis for more details and a new annotated graph.
>>> The latest Featured Stock Update with an annotated graph appeared on 6/8/2012. Click here.
View all notes |
Alert me of new notes |
CANSLIM.net Company Profile |
SEC |
Zacks Reports |
StockTalk |
News |
Chart |
Request a new note
C
A N
S L
I M
|
GNC
-
NYSE
G N C Holdings Inc
RETAIL - Drug Stores
|
$38.09
|
+0.78
2.09% |
$38.37
|
1,466,604
77.27% of 50 DAV
50 DAV is 1,898,000
|
$41.95
-9.20%
|
1/19/2012
|
$28.99
|
PP = $29.60
|
|
MB = $31.08
|
Most Recent Note - 6/8/2012 5:56:44 PM
G - Posted a gain today on below average volume, fighting to stay above its 50 DMA line. Recent lows define important near-term support while it could be forming a "double bottom" base.
>>> The latest Featured Stock Update with an annotated graph appeared on 6/6/2012. Click here.
View all notes |
Alert me of new notes |
CANSLIM.net Company Profile |
SEC |
Zacks Reports |
StockTalk |
News |
Chart |
Request a new note
C
A N
S L
I M
|
NTES
-
NASDAQ
Netease Inc Adr
INTERNET - Internet Information Providers
|
$62.62
|
-0.99
-1.56% |
$63.44
|
502,241
69.24% of 50 DAV
50 DAV is 725,400
|
$65.54
-4.46%
|
3/19/2012
|
$56.18
|
PP = $55.10
|
|
MB = $57.86
|
Most Recent Note - 6/6/2012 5:03:49 PM
G - Rallied with above average volume to a new 52-week high today. It had not formed a sound base pattern. Recent lows near the $55 area define important chart support to watch where a violation may trigger a worrisome technical sell signal.
>>> The latest Featured Stock Update with an annotated graph appeared on 5/24/2012. Click here.
View all notes |
Alert me of new notes |
CANSLIM.net Company Profile |
SEC |
Zacks Reports |
StockTalk |
News |
Chart |
Request a new note
C
A N
S L
I M
|
SWI
-
NYSE
Solarwinds Inc
COMPUTER SOFTWARE and SERVICES - Application Software
|
$44.50
|
+0.06
0.14% |
$44.57
|
493,186
45.28% of 50 DAV
50 DAV is 1,089,300
|
$48.64
-8.51%
|
4/26/2012
|
$45.15
|
PP = $42.32
|
|
MB = $44.44
|
Most Recent Note - 6/6/2012 6:07:53 PM
G - Posted a 2nd consecutive gain on lighter volume today after halting its 4-session slide at its 50 DMA line. A damaging violation of that short-term average and the prior session's low ($41.24) would trigger a more worrisome technical sell signal.
>>> The latest Featured Stock Update with an annotated graph appeared on 5/21/2012. Click here.
View all notes |
Alert me of new notes |
CANSLIM.net Company Profile |
SEC |
Zacks Reports |
StockTalk |
News |
Chart |
Request a new note
C
A N
S L
I M
|
Symbol/Exchange
Company Name
Industry Group |
PRICE |
CHANGE
(%Change) |
Day High |
Volume
(% DAV)
(% 50 day avg vol) |
52 Wk Hi
% From Hi |
Featured
Date |
Price
Featured |
Pivot Featured |
|
Max Buy |
SXCI
-
NASDAQ
S X C Health Solutions
COMPUTER SOFTWARE and SERVICES - Healthcare Information Service
|
$93.84
|
+0.96
1.03% |
$94.00
|
342,407
28.02% of 50 DAV
50 DAV is 1,222,200
|
$100.50
-6.63%
|
2/23/2012
|
$68.24
|
PP = $66.05
|
|
MB = $69.35
|
Most Recent Note - 6/6/2012 6:09:06 PM
G - Posted a 2nd consecutive gain today on below average volume after halting its slide at its 50 DMA line, important support for chart readers. Completed a new Public Offering on 5/10/12. It may be forming a new base, however the M criteria argues against new buying efforts without a confirmed rally with a solid FTD from at least one of the major averages.
>>> The latest Featured Stock Update with an annotated graph appeared on 5/17/2012. Click here.
View all notes |
Alert me of new notes |
CANSLIM.net Company Profile |
SEC |
Zacks Reports |
StockTalk |
News |
Chart |
Request a new note
C
A N
S L
I M
|
TDG
-
NYSE
Transdigm Group Inc
AEROSPACE/DEFENSE - Aerospace/Defense Products and; Services
|
$127.14
|
+0.95
0.75% |
$127.14
|
305,221
56.77% of 50 DAV
50 DAV is 537,600
|
$132.69
-4.18%
|
2/29/2012
|
$120.10
|
PP = $118.93
|
|
MB = $124.88
|
Most Recent Note - 6/6/2012 6:00:26 PM
G - Considerable gain today on near average volume, rallying from important support at its 50 DMA line. Its prior low ($118.43 on 5/18/12) defines the next important near-term chart support level to watch.
>>> The latest Featured Stock Update with an annotated graph appeared on 5/23/2012. Click here.
View all notes |
Alert me of new notes |
CANSLIM.net Company Profile |
SEC |
Zacks Reports |
StockTalk |
News |
Chart |
Request a new note
C
A N
S L
I M
|
UA
-
NYSE
Under Armour Inc Cl A
CONSUMER NON-DURABLES - Textile - Apparel Clothing
|
$103.31
|
+3.49
3.50% |
$103.32
|
1,176,468
124.53% of 50 DAV
50 DAV is 944,700
|
$102.86
0.44%
|
2/15/2012
|
$85.77
|
PP = $84.86
|
|
MB = $89.10
|
Most Recent Note - 6/8/2012 5:58:44 PM
G - Rallied with slightly above average volume for new 52-week and all-time highs. Previously noted - "No resistance remains due to overhead supply. Fundamental concerns remain after a slightly sub par earnings increase in the Dec '11 quarter."
>>> The latest Featured Stock Update with an annotated graph appeared on 5/29/2012. Click here.
View all notes |
Alert me of new notes |
CANSLIM.net Company Profile |
SEC |
Zacks Reports |
StockTalk |
News |
Chart |
Request a new note
C
A N
S L
I M
|
VSI
-
NYSE
Vitamin Shoppe Inc
SPECIALTY RETAIL - Specialty Retail, Other
|
$50.65
|
+0.40
0.80% |
$50.99
|
207,270
45.18% of 50 DAV
50 DAV is 458,800
|
$55.29
-8.39%
|
4/25/2012
|
$47.77
|
PP = $48.46
|
|
MB = $50.88
|
Most Recent Note - 6/7/2012 3:41:43 PM
Y - Quietly consolidating above prior highs in the $48 area which define important chart support. Market conditions argue against new buying efforts until a FTD from at least one of the major averages confirms a new rally. Color code is changed to yellow while one may consider a secondary buy point from its successful test of the 10 week average up to +5% above the recent high. Disciplined investors always limit losses by selling if a stock falls more than -7% from their buy price.
>>> The latest Featured Stock Update with an annotated graph appeared on 6/4/2012. Click here.
View all notes |
Alert me of new notes |
CANSLIM.net Company Profile |
SEC |
Zacks Reports |
StockTalk |
News |
Chart |
Request a new note
C
A N
S L
I M
|
WFM
-
NASDAQ
Whole Foods Market Inc
RETAIL - Grocery Stores
|
$90.93
|
+0.66
0.73% |
$91.06
|
1,400,545
77.81% of 50 DAV
50 DAV is 1,799,900
|
$91.50
-0.62%
|
5/3/2012
|
$90.28
|
PP = $86.45
|
|
MB = $90.77
|
Most Recent Note - 6/6/2012 6:14:17 PM
Y - Today's gain on average volume led to a best-ever close near its 52-week high. Color code was changed to yellow based on recent resilience while no new pivot point was cited. The high-ranked Retail - Super/Mini Markets firm found prompt support near its 50 DMA line after damaging losses negated the latest technical breakout. Confirming gains backed by higher volume, and a FTD from at least one of the major averages would be important and reassuring signs worth watching for.
>>> The latest Featured Stock Update with an annotated graph appeared on 5/11/2012. Click here.
View all notes |
Alert me of new notes |
CANSLIM.net Company Profile |
SEC |
Zacks Reports |
StockTalk |
News |
Chart |
Request a new note
C
A N
S L
I M
|
Symbol/Exchange
Company Name
Industry Group |
PRICE |
CHANGE
(%Change) |
Day High |
Volume
(% DAV)
(% 50 day avg vol) |
52 Wk Hi
% From Hi |
Featured
Date |
Price
Featured |
Pivot Featured |
|
Max Buy |
|
|
|
THESE ARE NOT BUY RECOMMENDATIONS!
Comments contained in the body of this report are technical
opinions only. The material herein has been obtained
from sources believed to be reliable and accurate, however,
its accuracy and completeness cannot be guaranteed.
This site is not an investment advisor, hence it does
not endorse or recommend any securities or other investments.
Any recommendation contained in this report may not
be suitable for all investors and it is not to be deemed
an offer or solicitation on our part with respect to
the purchase or sale of any securities. All trademarks,
service marks and trade names appearing in this report
are the property of their respective owners, and are
likewise used for identification purposes only.
This report is a service available
only to active Paid Premium Members.
You may opt-out of receiving report notifications
at any time. Questions or comments may be submitted
by writing to Premium Membership Services 665 S.E. 10 Street, Suite 201 Deerfield Beach, FL 33441-5634 or by calling 1-800-965-8307
or 954-785-1121.
|
|
|

