You are not logged in.
This means you
CAN ONLY VIEW reports that were published prior to Wednesday, April 30, 2025.
You
MUST UPGRADE YOUR MEMBERSHIP if you want to see any current reports.
AFTER MARKET UPDATE - TUESDAY, JUNE 8TH, 2010
Previous After Market Report Next After Market Report >>>
|
|
|
|
DOW |
+123.49 |
9,939.98 |
+1.26% |
|
Volume |
1,647,671,440 |
+16% |
|
Volume |
2,584,872,380 |
+20% |
|
NASDAQ |
-3.33 |
2,170.57 |
-0.15% |
|
Advancers |
1,825 |
58% |
|
Advancers |
1,069 |
38% |
|
S&P 500 |
+11.53 |
1,062.00 |
+1.10% |
|
Decliners |
1,246 |
39% |
|
Decliners |
1,580 |
57% |
|
Russell 2000 |
-0.80 |
617.69 |
-0.13% |
|
52 Wk Highs |
22 |
|
|
52 Wk Highs |
8 |
|
|
S&P 600 |
-0.53 |
331.19 |
-0.16% |
|
52 Wk Lows |
131 |
|
|
52 Wk Lows |
187 |
|
|
 |
Indices End Mixed as Bernanke Doubts "Double Dip" Recession is Coming
Adam Sarhan, Contributing Writer,
The major averages traded between positive and negative territory and finished mixed after Fed Chairman Ben Bernanke said he does not expect a "double dip" recession in the US. Volume, an important indicator of institutional sponsorship, was higher than Monday's levels. Advancers led decliners by about a 3-to-2 ratio on the NYSE but trailed by about a 3-to-2 ratio on the Nasdaq exchange. There were only 3 high-ranked companies from the CANSLIM.net Leaders List that made a new 52-week high and appeared on the CANSLIM.net BreakOuts Page, lower than the 4 issues that appeared on the prior session. New 52-week lows outnumbered new 52-week highs on the NYSE and the Nasdaq exchange.
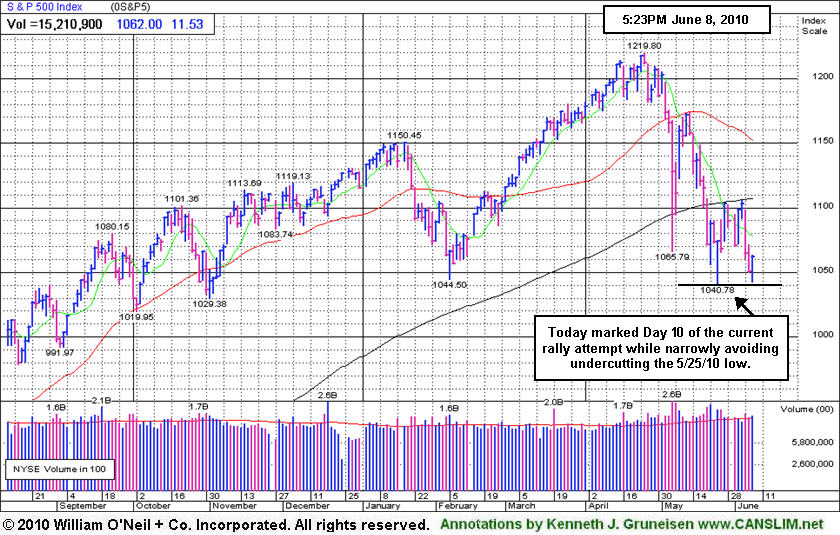
The Dow Jones Industrial Average, Nasdaq Composite, and small-cap Russell 2000 indexes all traded below their May 25, 2010 lows while the benchmark S&P 500 Index came within 2 points of last month's low. The Dow Jones Industrial Average marked a new Day 1 with Tuesday's positive close, but the Nasdaq Composite Index's loss leaves it awaiting a new Day 1 gain. So far, support near prior chart lows has been tested and appears to have held, but any further deterioration would suggest that another leg lower may follow.
The market reacted somewhat positively to Ben Bernanke's comments that he does not believe a double dip recession will occur in the US, but the price/volume action of the major averages disagrees with his outlook. It may be extremely important to watch how the euro performs versus many of its popular counterparts going forward. So far, the vast majority of the recent weakness has been directly due to European contagion woes. The euro negatively reversed (opened higher but closed lower) on Tuesday which put pressure on global equity indexes. Last month's low for the euro (formerly support) was just above $1.21 and that level has now become resistance. The bears remain in control until the bulls manage to send the euro above $1.21. Elsewhere, it was disconcerting to see the euro plunge to a new multi-year lows versus the Swiss Franc.
From our vantage point, the latest three-day rally effort failed, evidenced by the poor action in the major averages in recent sessions. Furthermore, the author of "How To Make Money In Stocks", the book that explains the fact-based investment system, has observed in the past that a market should not be considered to be in "healthy" shape unless at least 2 of the 3 major averages are trading above their rising 200-day moving average (DMA) lines. This played a pivotal role in our view in recent weeks. As of Tuesday's close, The Nasdaq Composite, Dow Jones Industrial Average, S&P 500 and small-cap Russell 2000 Index unanimously closed below their respective 200 DMA lines. Therefore, the bears will likely remain in control until these popular averages close above those important levels.
Professional Money Management Services - Free Portfolio Review:
If your portfolio is greater than $100,000 and you would like a free portfolio review, click here to get connected with one of our portfolio managers. ** Serious inquires only, please.
PICTURED: The S&P 500 Index marked Day 10 of its current rally attempt while narrowly avoiding undercutting its 5/25/10 low.
Note: We would like to wish Mr. Kenneth Gruneisen, Founder of CANSLIM.net, A VERY HAPPY BIRTHDAY!
|
|
|
 |
Retail Index Halts -17% Slide From April High At 200 DMA Line
Kenneth J. Gruneisen - Passed the CAN SLIM® Master's Exam
Financial shares finished the session higher as the Broker/Dealer Index ($XBD +0.92%) and Bank Index ($BKX +2.26%) posted gains. The Gold & Silver Index ($XAU +1.34%) rose, yet the Healthcare Index ($HMO -0.86%) and Biotechnology Index ($BTK -0.78%) traded with a slightly negative bias. Meanwhile, the Networking Index ($NWX +0.04%) and Internet Index ($IIX +0.07%) held their ground while the Semiconductor Index ($SOX -0.38%) edged lower. Modest gains in energy-related shares helped the Integrated Oil Index ($XOI +0.22%) and Oil Services Index ($OSX +0.78%) end the session slightly higher.
Charts courtesy www.stockcharts.com
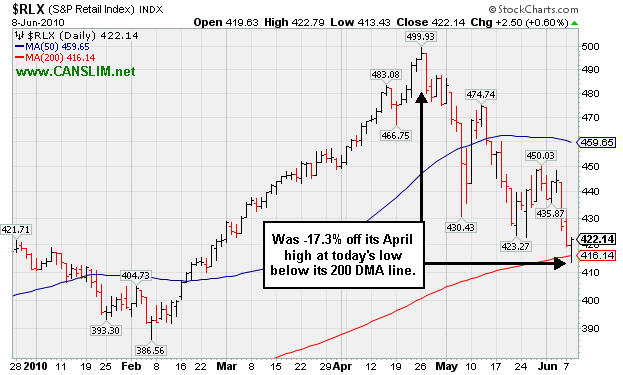
PICTURED: The Retail Index ($RLX +0.60%) traded -17.3% off its April high at Tuesday's low below its 200-day moving average (DMA) line.
| Oil Services |
$OSX |
163.56 |
+1.27 |
+0.78% |
-16.09% |
| Healthcare |
$HMO |
1,487.16 |
-12.88 |
-0.86% |
+0.97% |
| Integrated Oil |
$XOI |
913.23 |
+2.02 |
+0.22% |
-14.51% |
| Semiconductor |
$SOX |
334.58 |
-1.26 |
-0.38% |
-7.04% |
| Networking |
$NWX |
222.69 |
+0.10 |
+0.04% |
-3.62% |
| Internet |
$IIX |
229.84 |
+0.17 |
+0.07% |
-1.72% |
| Broker/Dealer |
$XBD |
104.22 |
+0.95 |
+0.92% |
-9.42% |
| Retail |
$RLX |
422.16 |
+2.52 |
+0.60% |
+2.69% |
| Gold & Silver |
$XAU |
174.56 |
+2.31 |
+1.34% |
+3.75% |
| Bank |
$BKX |
47.58 |
+1.05 |
+2.26% |
+11.40% |
| Biotech |
$BTK |
1,020.87 |
-7.99 |
-0.78% |
+8.36% |
|
|
|
 |
Damaging Distributional Pressure Triggers Technical Sell Signal
Kenneth J. Gruneisen - Passed the CAN SLIM® Master's Exam
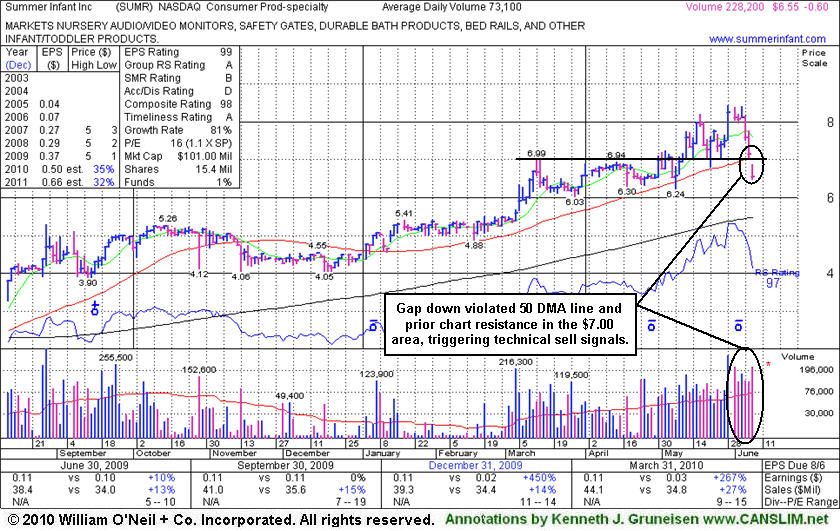
Summer Infant Inc (SUMR -$0.60 or -8.39% or $6.65) gapped down today, violating prior chart highs and its 50-day moving average (DMA) line, with its considerable loss on higher volume (3 times average) triggering technical sell signals. Recent losses with above average volume raised concerns. Today's weakness led to a 50 DMA violation that stands in stark contrast with its last appearance in this FSU section on 5/21/10 under the headline "Positive Reversal Near Chart Support Levels" when that short-term average acted as support.
Recent quarterly comparisons show sales revenues growth accelerating and big earnings increases (triple digit percentages), plus it has a good annual earnings (A criteria) history. Low-priced stocks are supposed to be avoided under the fact-based system because they are typically riskier candidates, however, when all key criteria are satisfied and market conditions are bullish buying efforts may be justified. Broader market action (M criteria) is normally expected to impact 3 out of 4 stocks, and odds are currently stacked against investors' success until a new rally with a follow-through day from at least one of the major averages confirms that strength is returning to stocks.
|
|
|
Color Codes Explained :
Y - Better candidates highlighted by our
staff of experts.
G - Previously featured
in past reports as yellow but may no longer be buyable under the
guidelines.
***Last / Change / Volume data in this table is the closing quote data***
Symbol/Exchange
Company Name
Industry Group |
PRICE |
CHANGE
(%Change) |
Day High |
Volume
(% DAV)
(% 50 day avg vol) |
52 Wk Hi
% From Hi |
Featured
Date |
Price
Featured |
Pivot Featured |
|
Max Buy |
APEI
-
NASDAQ
American Public Educ Inc
DIVERSIFIED SERVICES - Education and Training Services
|
$46.14
|
-0.32
-0.68% |
$46.77
|
472,646
333.08% of 50 DAV
50 DAV is 141,900
|
$48.17
-4.21%
|
6/7/2010
|
$46.60
|
PP = $46.29
|
|
MB = $48.60
|
 Most Recent Note - 6/8/2010 1:39:28 PM
Y - Pulling back today, slumping under its pivot point. Finished in the lower half of its intra-day range, yet its 6/07/10 gain and close above its pivot point with above average volume triggered a technical buy signal. 
>>> The latest Featured Stock Update with an annotated graph appeared on 9/17/2008. Click here.
View all notes |
Alert me of new notes |
CANSLIM.net Company Profile |
SEC |
Zacks Reports |
StockTalk |
News |
Chart |
Request a new note
C
A N
S L
I M


|
BIDU
-
NASDAQ
Baidu Inc Ads
INTERNET - Internet Information Providers
|
$70.49
|
+0.68
0.97% |
$71.72
|
10,839,785
70.98% of 50 DAV
50 DAV is 15,272,600
|
$82.29
-14.34%
|
1/13/2010
|
$43.13
|
PP = $42.68
|
|
MB = $44.81
|
Most Recent Note - 6/7/2010 3:25:42 PM
G - Down on light volume today, consolidating toward its 50 DMA line, still extended from any sound base. A worrisome negative reversal from its all-time high on 5/13/10 followed a 10:1 stock split.
>>> The latest Featured Stock Update with an annotated graph appeared on 6/1/2010. Click here.
View all notes |
Alert me of new notes |
CANSLIM.net Company Profile |
SEC |
Zacks Reports |
StockTalk |
News |
Chart |
Request a new note
C
A N
S L
I M
|
BRLI
-
NASDAQ
Bio Reference Labs Inc
HEALTH SERVICES - Medical Laboratories and Researc
|
$22.61
|
+0.31
1.39% |
$22.70
|
129,178
66.86% of 50 DAV
50 DAV is 193,200
|
$24.67
-8.36%
|
2/12/2010
|
$39.02
|
PP = $20.49
|
|
MB = $21.51
|
Most Recent Note - 6/7/2010 5:05:06 PM
G - It remains trading below its 50 DMA line. Consolidating for about 7 weeks since a 2:1 stock split effective on 4/22/10.
>>> The latest Featured Stock Update with an annotated graph appeared on 5/26/2010. Click here.
View all notes |
Alert me of new notes |
CANSLIM.net Company Profile |
SEC |
Zacks Reports |
StockTalk |
News |
Chart |
Request a new note
C
A N
S L
I M
|
CRM
-
NYSE
Salesforce.Com Inc
INTERNET - Internet Software and Services
|
$88.00
|
+0.10
0.11% |
$89.74
|
3,619,324
153.75% of 50 DAV
50 DAV is 2,354,000
|
$96.35
-8.67%
|
6/2/2010
|
$88.44
|
PP = $89.60
|
|
MB = $94.08
|
Most Recent Note - 6/7/2010 5:10:39 PM
Y - Loss today raised concern as it finishing under its pivot point and prior high closes following a negative reversal on 6/04/10 after reaching a new all-time high. Its "breakaway gap" on 6/03/10 triggered a technical buy signal.
>>> The latest Featured Stock Update with an annotated graph appeared on 6/2/2010. Click here.
View all notes |
Alert me of new notes |
CANSLIM.net Company Profile |
SEC |
Zacks Reports |
StockTalk |
News |
Chart |
Request a new note
C
A N
S L
I M
|
LL
-
NYSE
Lumber Liquidators Hldgs
RETAIL - Home Improvement Stores
|
$27.00
|
-0.83
-2.98% |
$28.23
|
662,334
190.00% of 50 DAV
50 DAV is 348,600
|
$33.41
-19.19%
|
4/22/2010
|
$29.87
|
PP = $29.03
|
|
MB = $30.48
|
Most Recent Note - 6/8/2010 2:09:14 PM
G - Slumping further below its 50 DMA line and December '09 highs today, approaching its prior chart lows and 200 DMA line. Based on weak action it will be dropped from the Featured Stocks list tonight. A rally back above its short-term average would help its outlook improve. A "negative reversal" on 4/26/10 marked its all-time high.
>>> The latest Featured Stock Update with an annotated graph appeared on 6/4/2010. Click here.
View all notes |
Alert me of new notes |
CANSLIM.net Company Profile |
SEC |
Zacks Reports |
StockTalk |
News |
Chart |
Request a new note
C
A N
S L
I M
|
Symbol/Exchange
Company Name
Industry Group |
PRICE |
CHANGE
(%Change) |
Day High |
Volume
(% DAV)
(% 50 day avg vol) |
52 Wk Hi
% From Hi |
Featured
Date |
Price
Featured |
Pivot Featured |
|
Max Buy |
LOPE
-
NASDAQ
Grand Canyon Education
DIVERSIFIED SERVICES - Education and; Training Services
|
$23.58
|
-0.07
-0.30% |
$23.79
|
220,126
52.22% of 50 DAV
50 DAV is 421,500
|
$28.46
-17.15%
|
4/13/2010
|
$27.71
|
PP = $27.33
|
|
MB = $28.70
|
Most Recent Note - 6/8/2010 4:20:26 PM
G - Held its ground quietly today -18% off its 52-week high after violating prior chart lows on 6/07/10, raising concerns.
>>> The latest Featured Stock Update with an annotated graph appeared on 5/27/2010. Click here.
View all notes |
Alert me of new notes |
CANSLIM.net Company Profile |
SEC |
Zacks Reports |
StockTalk |
News |
Chart |
Request a new note
C
A N
S L
I M
|
MELI
-
NASDAQ
Mercadolibre Inc
INTERNET - Internet Software and; Services
|
$51.65
|
+0.63
1.23% |
$52.55
|
560,248
83.71% of 50 DAV
50 DAV is 669,300
|
$56.16
-8.03%
|
5/13/2010
|
$54.21
|
PP = $55.85
|
|
MB = $58.64
|
Most Recent Note - 6/7/2010 5:16:55 PM
Y - Pulled back toward its 50 DMA line today. Its latest rally effort fell short of producing a powerful gain above its pivot point with volume sufficient to trigger a proper technical buy signal.
>>> The latest Featured Stock Update with an annotated graph appeared on 5/28/2010. Click here.
View all notes |
Alert me of new notes |
CANSLIM.net Company Profile |
SEC |
Zacks Reports |
StockTalk |
News |
Chart |
Request a new note
C
A N
S L
I M
|
ROVI
-
NASDAQ
Rovi Corp
COMPUTER SOFTWARE andamp; SERVICES - Security Software andamp; Services
|
$35.87
|
-0.42
-1.16% |
$36.30
|
1,447,363
109.87% of 50 DAV
50 DAV is 1,317,300
|
$40.06
-10.46%
|
6/3/2010
|
$38.70
|
PP = $40.16
|
|
MB = $42.17
|
Most Recent Note - 6/8/2010 4:23:01 PM
G - Closed at the session high today with a small loss after slumping further under its 50 DMA line near recent lows. Color code was changed to green. It would need to rally back above its short-term average for its outlook to improve.
>>> The latest Featured Stock Update with an annotated graph appeared on 5/24/2010. Click here.
View all notes |
Alert me of new notes |
CANSLIM.net Company Profile |
SEC |
Zacks Reports |
StockTalk |
News |
Chart |
Request a new note
C
A N
S L
I M
|
SUMR
-
NASDAQ
Summer Infant Inc
CONSUMER NON-DURABLES - Personal Products
|
$6.55
|
-0.60
-8.39% |
$7.19
|
228,227
316.98% of 50 DAV
50 DAV is 72,000
|
$8.42
-22.21%
|
5/4/2010
|
$6.85
|
PP = $7.09
|
|
MB = $7.44
|
Most Recent Note - 6/8/2010 4:25:20 PM
G - Gapped down today, violating prior chart highs and its 50 DMA line with a considerable loss on higher volume triggering technical sell signals. Recent losses with above average volume raised concerns.
>>> The latest Featured Stock Update with an annotated graph appeared on 6/8/2010. Click here.
View all notes |
Alert me of new notes |
CANSLIM.net Company Profile |
SEC |
Zacks Reports |
StockTalk |
News |
Chart |
Request a new note
C
A N
S L
I M
|
THOR
-
NASDAQ
Thoratec Corp
HEALTH SERVICES - Medical Instruments and Supplies
|
$42.32
|
-0.43
-1.01% |
$43.14
|
736,141
81.51% of 50 DAV
50 DAV is 903,100
|
$46.50
-8.99%
|
6/3/2010
|
$44.38
|
PP = $45.35
|
|
MB = $47.62
|
Most Recent Note - 6/8/2010 10:34:40 AM
Y - Consolidating well above its 50 DMA line while about -9% off its 52 week high today. Losses entirely erased its latest breakout.
>>> The latest Featured Stock Update with an annotated graph appeared on 6/3/2010. Click here.
View all notes |
Alert me of new notes |
CANSLIM.net Company Profile |
SEC |
Zacks Reports |
StockTalk |
News |
Chart |
Request a new note
C
A N
S L
I M
|
Symbol/Exchange
Company Name
Industry Group |
PRICE |
CHANGE
(%Change) |
Day High |
Volume
(% DAV)
(% 50 day avg vol) |
52 Wk Hi
% From Hi |
Featured
Date |
Price
Featured |
Pivot Featured |
|
Max Buy |
ULTA
-
NASDAQ
Ulta Salon Cosm & Frag
SPECIALTY RETAIL - Specialty Retail, Other
|
$21.42
|
-0.81
-3.64% |
$22.52
|
577,514
138.13% of 50 DAV
50 DAV is 418,100
|
$26.00
-17.62%
|
5/28/2010
|
$25.58
|
PP = $25.86
|
|
MB = $27.15
|
Most Recent Note - 6/8/2010 2:25:44 PM
G - Slumping further below its 50 DMA line today. After encountering distributional pressure it is currently -18% off its 52-week high, trading near its prior chart lows that define important chart support now in the $21 area.
>>> The latest Featured Stock Update with an annotated graph appeared on 6/7/2010. Click here.
View all notes |
Alert me of new notes |
CANSLIM.net Company Profile |
SEC |
Zacks Reports |
StockTalk |
News |
Chart |
Request a new note
C
A N
S L
I M
|
|
|
|
THESE ARE NOT BUY RECOMMENDATIONS!
Comments contained in the body of this report are technical
opinions only. The material herein has been obtained
from sources believed to be reliable and accurate, however,
its accuracy and completeness cannot be guaranteed.
This site is not an investment advisor, hence it does
not endorse or recommend any securities or other investments.
Any recommendation contained in this report may not
be suitable for all investors and it is not to be deemed
an offer or solicitation on our part with respect to
the purchase or sale of any securities. All trademarks,
service marks and trade names appearing in this report
are the property of their respective owners, and are
likewise used for identification purposes only.
This report is a service available
only to active Paid Premium Members.
You may opt-out of receiving report notifications
at any time. Questions or comments may be submitted
by writing to Premium Membership Services 665 S.E. 10 Street, Suite 201 Deerfield Beach, FL 33441-5634 or by calling 1-800-965-8307
or 954-785-1121.
|
|
|


