You are not logged in.
This means you
CAN ONLY VIEW reports that were published prior to Monday, April 14, 2025.
You
MUST UPGRADE YOUR MEMBERSHIP if you want to see any current reports.
AFTER MARKET UPDATE - FRIDAY, JUNE 7TH, 2013
Previous After Market Report Next After Market Report >>>
|
|
|
|
DOW |
+207.50 |
15,248.12 |
+1.38% |
|
Volume |
729,444,390 |
-9% |
|
Volume |
1,600,633,830 |
-8% |
|
NASDAQ |
+45.17 |
3,469.22 |
+1.32% |
|
Advancers |
2,096 |
67% |
|
Advancers |
1,648 |
63% |
|
S&P 500 |
+20.82 |
1,643.38 |
+1.28% |
|
Decliners |
932 |
30% |
|
Decliners |
866 |
33% |
|
Russell 2000 |
+8.16 |
987.62 |
+0.83% |
|
52 Wk Highs |
93 |
|
|
52 Wk Highs |
128 |
|
|
S&P 600 |
+4.23 |
554.11 |
+0.77% |
|
52 Wk Lows |
19 |
|
|
52 Wk Lows |
27 |
|
|
 |
Major Averages Rallied On Payrolls Report
Kenneth J. Gruneisen - Passed the CAN SLIM® Master's Exam
For the week, the Dow Jones Industrial Average was up +0.9%, the S&P 500 Index advanced +0.8% and the Nasdaq Composite Index climbed +0.4%. The indices ended Friday's trading session firmly in positive territory and closed out June's first trading week in rally mode, snapping a two-week losing streak. The volume totals were reported lighter than the prior session totals on both major exchanges, however, a sign that the institutional crowd was not increasing their buying efforts. Breadth was positive as advancers led decliners by a 2-1 margin on the NYSE and on the Nasdaq exchange. There were 43 high-ranked companies from the CANSLIM.net Leaders List making new 52-week highs and appearing on the CANSLIM.net BreakOuts Page, up from the prior session total of 15 stocks. New 52-week highs solidly outnumbered new 52-week lows on the NYSE and on the Nasdaq exchange. There were gains for 9 of the 11 high-ranked companies currently included on the Featured Stocks Page.
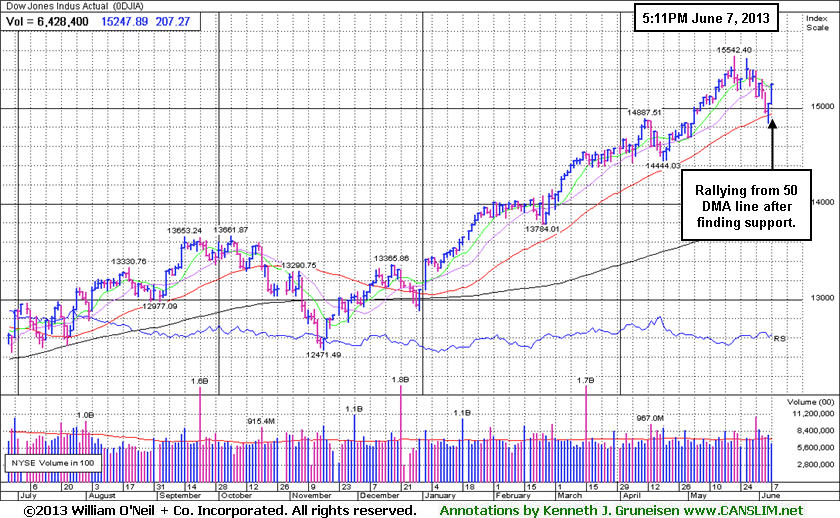
Equity markets gained ground as an employment update renewed hopes that the Fed will not taper its bond purchases. The nonfarm payrolls report topped estimates for May with a gain of 175,000, but came in below this year's average monthly advance. In addition, the previous month's figure was revised lower and the unemployment rate unexpectedly rose to 7.6%.
Nine of the 10 S&P 500 sectors were higher with cyclicals outperforming defensive issues. Industrials was the best performing group as General Electric Co (GE +2.05%) and United Parcel Service, Inc (UPS +1.90%) rose. Telecommunications lagged behind as AT&T Inc (T -1.01%) and CenturyLink Inc (CTL -0.20%) edged lower.
In fixed-income, Treasuries erased a weekly advance due to today’s retreat. The 10-year note was down 26/32 to yield 2.17% and the 30-year bond lost over a full point and a half to yield 3.34%.
The market (M criteria) uptrend clearly came under pressure as May drew to a close, and the ongoing weakness is threatening to become a full blown "correction". However, lighter volume totals are a sign that institutional volume has not been intensifying while the major averages have retreated. As more damaging losses mount in the broader market this can serve as a reminder for investors to be protective of any gains and to limit losses by being especially watchful for any individual issues flashing technical sell signals. It is vitally important to your success with the fact-based investment system to reduce exposure and preserve cash during market downdrafts.
As always, watch upcoming CANSLIM.net reports for new action-worthy leaders best matching the winning models to be covered as they emerge and then included on the Featured Stocks Page - with our Certified experts' latest notes and links to additional resources including detailed analysis with annotated graphs. The Premium Member Homepage - includes "dynamic archives" to all prior pay reports published. Watch for an announcement via email concerning the next WEBCAST.
PICTURED: The Dow Jones Industrial Average found prompt support at its 50-day moving average (DMA) line.
|
 Kenneth J. Gruneisen started out as a licensed stockbroker in August 1987, a couple of months prior to the historic stock market crash that took the Dow Jones Industrial Average down -22.6% in a single day. He has published daily fact-based fundamental and technical analysis on high-ranked stocks online for two decades. Through FACTBASEDINVESTING.COM, Kenneth provides educational articles, news, market commentary, and other information regarding proven investment systems that work in good times and bad.
Comments contained in the body of this report are technical opinions only and are not necessarily those of Gruneisen Growth Corp. The material herein has been obtained from sources believed to be reliable and accurate, however, its accuracy and completeness cannot be guaranteed. Our firm, employees, and customers may effect transactions, including transactions contrary to any recommendation herein, or have positions in the securities mentioned herein or options with respect thereto. Any recommendation contained in this report may not be suitable for all investors and it is not to be deemed an offer or solicitation on our part with respect to the purchase or sale of any securities. |
|
 |
Retail, Financial, Tech and Healthcare Groups Rose
Kenneth J. Gruneisen - Passed the CAN SLIM® Master's Exam
The Retail Index ($RLX +1.74%) posted a solid gain and financial stocks were a positive influence on the major averages as the Broker/Dealer Index ($XBD +3.25%) outpaced the Bank Index ($BKX +1.55%) with gains. The Semiconductor Index ($SOX +1.47%), Internet Index ($IIX +1.52%), Networking Index ($NWX +1.62%), and Biotechnology Index ($BTK +2.00%) posted unanimous gains. Modest gains in energy-related shares gave the Integrated Oil Index ($XOI +0.67%) and the Oil Services Index ($OSX +1.11%) both a boost. Defensive groups were mixed as the Healthcare Index ($HMO +1.77%) posted a gain yet the Gold & Silver Index ($XAU -3.89%) was a standout decliner.
Charts courtesy www.stockcharts.com
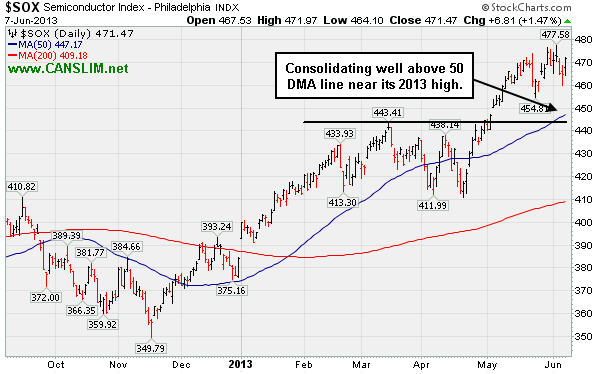
PICTURED: The Semiconductor Index ($SOX +1.47%) is consolidating well above its 50-day moving average (DMA) line and perched near its 2013 high.
| Oil Services |
$OSX |
257.85 |
+2.83 |
+1.11% |
+17.12% |
| Healthcare |
$HMO |
3,083.05 |
+53.72 |
+1.77% |
+22.63% |
| Integrated Oil |
$XOI |
1,385.45 |
+9.21 |
+0.67% |
+11.57% |
| Semiconductor |
$SOX |
471.47 |
+6.81 |
+1.47% |
+22.76% |
| Networking |
$NWX |
264.19 |
+4.21 |
+1.62% |
+16.61% |
| Internet |
$IIX |
383.10 |
+5.75 |
+1.52% |
+17.16% |
| Broker/Dealer |
$XBD |
126.26 |
+3.98 |
+3.25% |
+33.85% |
| Retail |
$RLX |
794.67 |
+13.60 |
+1.74% |
+21.68% |
| Gold & Silver |
$XAU |
105.62 |
-4.28 |
-3.89% |
-36.22% |
| Bank |
$BKX |
61.58 |
+0.94 |
+1.55% |
+20.09% |
| Biotech |
$BTK |
1,954.21 |
+38.30 |
+2.00% |
+26.32% |
|
|
|
 |
Rallied on Recently Announced Acquisition News
Kenneth J. Gruneisen - Passed the CAN SLIM® Master's Exam
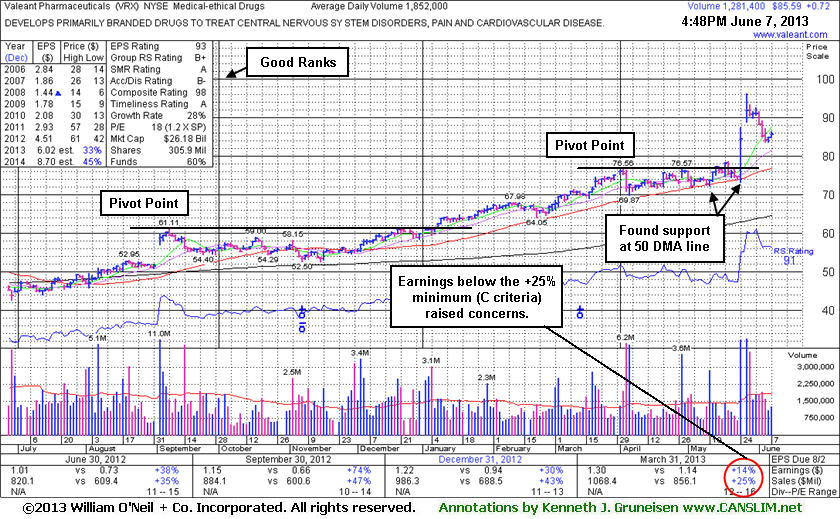
Valeant Pharmaceuticals International, Inc (VRX +$0.72 or +0.85% to $85.59) is extended from prior highs and prior reports cautioned investors. However, the high-ranked Medical - Ethical Drugs firm recently rallied as it announced plans to buy Bausch & Lomb for $8.7 billion. Time alone will tell if its recent acquisitions will result in stronger earnings in the upcoming quarterly comparisons.
VRX was last shown in this FSU section on 5/17/13 with an annotated graph under the headline, "Bullish Action Continues Following Sub Par Earnings for Mar '13 Period". Light volume at the time was noted as a sign that very few investors were headed for the exit. Prior reports recently cautioned - "Sub par earnings for the Mar '13 quarter below the +25% minimum guideline (C criteria) raised fundamental concerns." Investors are taught in the Certification to only buy stocks with a combination of both strong fundamentals and strong technical action, however stocks should be sold based on their technical action only. In this example, more bullish action rewarded patient investors still giving it the benefit of the doubt until any technical sell signals start adding up.
The number of top-rated funds owning its shares rose from 818 in Mar '12 in to 966 in Mar '13, a reassuring trend concerning the I criteria. Quarterly earnings increases (C criteria) had been strong and well above the +25% guideline until the Mar '13 period, which only showed a +14% earnings increase (see red circle) over the year-ago period. A downturn in FY '07 and '08 earnings (A criteria) has been followed by a strong earnings rebound in recent years. Return On Equity is currently reported at 37%, well above the 17% minimum guideline of the fact-based system.
|
|
|
Color Codes Explained :
Y - Better candidates highlighted by our
staff of experts.
G - Previously featured
in past reports as yellow but may no longer be buyable under the
guidelines.
***Last / Change / Volume data in this table is the closing quote data***
Symbol/Exchange
Company Name
Industry Group |
PRICE |
CHANGE
(%Change) |
Day High |
Volume
(% DAV)
(% 50 day avg vol) |
52 Wk Hi
% From Hi |
Featured
Date |
Price
Featured |
Pivot Featured |
|
Max Buy |
AL
-
NYSE
Air Lease Corp Cl A
DIVERSIFIED SERVICES - Rental and Leasing Services
|
$27.06
|
-0.54
-1.96% |
$28.02
|
595,137
105.63% of 50 DAV
50 DAV is 563,400
|
$31.00
-12.71%
|
5/9/2013
|
$30.95
|
PP = $29.38
|
|
MB = $30.85
|
Most Recent Note - 6/4/2013 12:18:58 PM
G - Consolidating near its 50 DMA line now, it completed a Secondary Offering on 5/31/13. Often times companies attract additional institutional interest (I criteria) with the help of underwriters when Secondary Offerings are completed, however they can typically be a short-term hindrance to price progress.
>>> The latest Featured Stock Update with an annotated graph appeared on 5/30/2013. Click here.
View all notes |
Alert me of new notes |
CANSLIM.net Company Profile |
SEC |
Zacks Reports |
StockTalk |
News |
Chart |
Request a new note
C
A N
S L
I M


|
AMBA
-
NASDAQ
Ambarella Inc
ELECTRONICS - Semiconductor - Specialized
|
$16.53
|
+0.18
1.10% |
$16.63
|
1,149,035
125.21% of 50 DAV
50 DAV is 917,700
|
$17.90
-7.65%
|
5/6/2013
|
$15.31
|
PP = $16.10
|
|
MB = $16.91
|
Most Recent Note - 6/6/2013 11:59:44 AM
Y - Pulling back today. It finished in the lower third of its intra-day range on the prior session, encountering distributional pressure after gapping up and challenging its 52-week high. Reported earnings +129% on +31% sales revenues for the April '13 quarter versus the year ago period. Its 50 DMA line ($14.58 now) defines important chart support to watch.
>>> The latest Featured Stock Update with an annotated graph appeared on 5/29/2013. Click here.
View all notes |
Alert me of new notes |
CANSLIM.net Company Profile |
SEC |
Zacks Reports |
StockTalk |
News |
Chart |
Request a new note
C
A N
S L
I M
|
EQM
-
NYSE
E Q T Midstream Partners
ENERGY - Oil and Gas Pipelines
|
$45.78
|
+0.18
0.39% |
$46.45
|
30,555
27.48% of 50 DAV
50 DAV is 111,200
|
$51.72
-11.48%
|
4/25/2013
|
$40.16
|
PP = $40.84
|
|
MB = $42.88
|
Most Recent Note - 6/6/2013 5:41:13 PM
G - Halted its slide today after encountering distributional pressure and retreating since a "negative reversal" on 5/28/13 at its 52-week high. See the latest FSU analysis for more details and a new annotated graph. Its 50 DMA line defines important near-term chart support.
>>> The latest Featured Stock Update with an annotated graph appeared on 6/6/2013. Click here.
View all notes |
Alert me of new notes |
CANSLIM.net Company Profile |
SEC |
Zacks Reports |
StockTalk |
News |
Chart |
Request a new note
C
A N
S L
I M
|
FLT
-
NYSE
Fleetcor Technologies
DIVERSIFIED SERVICES - Business/Management Services
|
$87.11
|
+1.69
1.98% |
$87.20
|
557,676
62.94% of 50 DAV
50 DAV is 886,100
|
$88.83
-1.94%
|
5/29/2013
|
$86.02
|
PP = $85.66
|
|
MB = $89.94
|
 Most Recent Note - 6/7/2013 4:14:59 PM
Y- Held its ground this week. It was noted in the mid-day report on 5/29/13 with a new pivot point cited based on its 5/03/13 high, and it rose from an advanced "3-weeks tight" base with a gain on the session backed by +56% above average volume. It may go on to produce more climactic gains, however this was a riskier "late-stage" base.
>>> The latest Featured Stock Update with an annotated graph appeared on 5/31/2013. Click here.
View all notes |
Alert me of new notes |
CANSLIM.net Company Profile |
SEC |
Zacks Reports |
StockTalk |
News |
Chart |
Request a new note
C
A N
S L
I M
|
LOPE
-
NASDAQ
Grand Canyon Education
DIVERSIFIED SERVICES - Education and; Training Services
|
$32.59
|
+0.74
2.32% |
$32.70
|
279,604
69.85% of 50 DAV
50 DAV is 400,300
|
$34.07
-4.34%
|
5/10/2013
|
$29.03
|
PP = $27.28
|
|
MB = $28.64
|
Most Recent Note - 6/7/2013 4:11:23 PM
G - Volume totals have been cooling while still holding its ground stubbornly perched at its 52-week high, very extended from its previous base. Prior highs in the $27 area define support to watch on pullbacks. Gains of greater than +20% in the first 2-3 weeks following its "breakaway gap" suggest holding for a minimum of 8 week under the fact-based investment system's rules.
>>> The latest Featured Stock Update with an annotated graph appeared on 6/3/2013. Click here.
View all notes |
Alert me of new notes |
CANSLIM.net Company Profile |
SEC |
Zacks Reports |
StockTalk |
News |
Chart |
Request a new note
C
A N
S L
I M
|
Symbol/Exchange
Company Name
Industry Group |
PRICE |
CHANGE
(%Change) |
Day High |
Volume
(% DAV)
(% 50 day avg vol) |
52 Wk Hi
% From Hi |
Featured
Date |
Price
Featured |
Pivot Featured |
|
Max Buy |
MRLN
-
NASDAQ
Marlin Business Services
DIVERSIFIED SERVICES - Rental and Leasing Services
|
$23.57
|
+0.25
1.07% |
$23.88
|
29,364
123.90% of 50 DAV
50 DAV is 23,700
|
$25.97
-9.24%
|
3/15/2013
|
$22.29
|
PP = $23.18
|
|
MB = $24.34
|
Most Recent Note - 6/3/2013 2:02:46 PM
G - Slumping under its 50 DMA line and its color code is changed to green. The recent low ($21.49 on 5/23/13) defines important near-term support below that short-term average where a violation would raise more serious concerns.
>>> The latest Featured Stock Update with an annotated graph appeared on 5/23/2013. Click here.
View all notes |
Alert me of new notes |
CANSLIM.net Company Profile |
SEC |
Zacks Reports |
StockTalk |
News |
Chart |
Request a new note
C
A N
S L
I M
|
NSM
-
NYSE
Nationstar Mtg Hldgs Inc
FINANCIAL SERVICES - Credit Services
|
$42.08
|
+0.53
1.28% |
$42.15
|
896,401
74.30% of 50 DAV
50 DAV is 1,206,400
|
$46.91
-10.30%
|
5/7/2013
|
$39.71
|
PP = $42.34
|
|
MB = $44.46
|
Most Recent Note - 6/3/2013 4:30:52 PM
Y - Volume was below average behind today's gain following a spurt of damaging losses marked by above average volume. Weak action recently negated its prior breakout and raised concerns. Disciplined investors always limit losses if any stock falls more than -7% from their purchase price.
>>> The latest Featured Stock Update with an annotated graph appeared on 5/28/2013. Click here.
View all notes |
Alert me of new notes |
CANSLIM.net Company Profile |
SEC |
Zacks Reports |
StockTalk |
News |
Chart |
Request a new note
C
A N
S L
I M
|
PRAA
-
NASDAQ
Portfolio Recovery Assoc
DIVERSIFIED SERVICES - Business/Management Services
|
$148.99
|
-1.17
-0.78% |
$150.88
|
112,251
163.16% of 50 DAV
50 DAV is 68,800
|
$153.85
-3.16%
|
5/1/2013
|
$130.77
|
PP = $127.88
|
|
MB = $134.27
|
Most Recent Note - 6/7/2013 4:13:13 PM
G - Endured mild distributional pressure this week yet it remains perched near its high holding its ground with no resistance due to overhead supply. Very extended from prior highs in the $127 area and well above its 50 DMA line defining important chart support.
>>> The latest Featured Stock Update with an annotated graph appeared on 5/22/2013. Click here.
View all notes |
Alert me of new notes |
CANSLIM.net Company Profile |
SEC |
Zacks Reports |
StockTalk |
News |
Chart |
Request a new note
C
A N
S L
I M
|
PRLB
-
NYSE
Proto Labs Inc
MANUFACTURING - Small Tools and Accessories
|
$56.56
|
+2.15
3.95% |
$56.61
|
506,128
95.28% of 50 DAV
50 DAV is 531,200
|
$59.84
-5.48%
|
5/3/2013
|
$54.77
|
PP = $54.01
|
|
MB = $56.71
|
Most Recent Note - 6/7/2013 4:08:50 PM
Y - It ended still below its "max buy" level, up today with higher but still below average volume, rallying from support at its 50 DMA line. A subsequent violation may trigger a technical sell signal.
>>> The latest Featured Stock Update with an annotated graph appeared on 5/24/2013. Click here.
View all notes |
Alert me of new notes |
CANSLIM.net Company Profile |
SEC |
Zacks Reports |
StockTalk |
News |
Chart |
Request a new note
C
A N
S L
I M
|
RRTS
-
NYSE
Roadrunner Trans Systems
TRANSPORTATION - Air Delivery and Freight Service
|
$27.88
|
+0.95
3.53% |
$28.13
|
412,651
198.10% of 50 DAV
50 DAV is 208,300
|
$28.24
-1.27%
|
4/3/2013
|
$22.77
|
PP = $23.75
|
|
MB = $24.94
|
Most Recent Note - 6/7/2013 4:09:56 PM
G - Rallied to finish the week near its all-time high. Fundamental concerns were raised by its sub par earnings increase in the Mar '13 quarter, below the +25% minimum guideline (C criteria).
>>> The latest Featured Stock Update with an annotated graph appeared on 6/4/2013. Click here.
View all notes |
Alert me of new notes |
CANSLIM.net Company Profile |
SEC |
Zacks Reports |
StockTalk |
News |
Chart |
Request a new note
C
A N
S L
I M
|
Symbol/Exchange
Company Name
Industry Group |
PRICE |
CHANGE
(%Change) |
Day High |
Volume
(% DAV)
(% 50 day avg vol) |
52 Wk Hi
% From Hi |
Featured
Date |
Price
Featured |
Pivot Featured |
|
Max Buy |
VRX
-
NYSE
Valeant Pharmaceuticals
DRUGS - Drug Manufacturers - Other
|
$85.59
|
+0.72
0.85% |
$86.53
|
1,284,509
69.36% of 50 DAV
50 DAV is 1,852,000
|
$96.25
-11.08%
|
4/30/2013
|
$60.24
|
PP = $76.66
|
|
MB = $80.49
|
Most Recent Note - 6/7/2013 5:08:20 PM
G- Rallied since making recent acquisition plans. Support to watch is at prior highs coinciding with its 50 DMA near $76. See latest FSU analysis for more details and a new annotated graph.
>>> The latest Featured Stock Update with an annotated graph appeared on 6/7/2013. Click here.
View all notes |
Alert me of new notes |
CANSLIM.net Company Profile |
SEC |
Zacks Reports |
StockTalk |
News |
Chart |
Request a new note
C
A N
S L
I M
|
|
|
|
THESE ARE NOT BUY RECOMMENDATIONS!
Comments contained in the body of this report are technical
opinions only. The material herein has been obtained
from sources believed to be reliable and accurate, however,
its accuracy and completeness cannot be guaranteed.
This site is not an investment advisor, hence it does
not endorse or recommend any securities or other investments.
Any recommendation contained in this report may not
be suitable for all investors and it is not to be deemed
an offer or solicitation on our part with respect to
the purchase or sale of any securities. All trademarks,
service marks and trade names appearing in this report
are the property of their respective owners, and are
likewise used for identification purposes only.
This report is a service available
only to active Paid Premium Members.
You may opt-out of receiving report notifications
at any time. Questions or comments may be submitted
by writing to Premium Membership Services 665 S.E. 10 Street, Suite 201 Deerfield Beach, FL 33441-5634 or by calling 1-800-965-8307
or 954-785-1121.
|
|
|

