You are not logged in.
This means you
CAN ONLY VIEW reports that were published prior to Monday, April 14, 2025.
You
MUST UPGRADE YOUR MEMBERSHIP if you want to see any current reports.
AFTER MARKET UPDATE - THURSDAY, JUNE 7TH, 2012
Previous After Market Report Next After Market Report >>>
|
|
|
|
DOW |
+46.17 |
12,460.96 |
+0.37% |
|
Volume |
854,608,290 |
-1% |
|
Volume |
1,595,560,080 |
-6% |
|
NASDAQ |
-13.70 |
2,831.02 |
-0.48% |
|
Advancers |
1,407 |
44% |
|
Advancers |
1,016 |
39% |
|
S&P 500 |
-0.14 |
1,314.99 |
-0.01% |
|
Decliners |
1,648 |
52% |
|
Decliners |
1,481 |
56% |
|
Russell 2000 |
-4.83 |
760.34 |
-0.63% |
|
52 Wk Highs |
78 |
|
|
52 Wk Highs |
42 |
|
|
S&P 600 |
-2.90 |
426.38 |
-0.68% |
|
52 Wk Lows |
21 |
|
|
52 Wk Lows |
27 |
|
|
 |
Indices Finished Mixed on Lighter Volume Totals
Kenneth J. Gruneisen - Passed the CAN SLIM® Master's Exam
The major averages ended with mixed results after trading higher for most of Thursday's session. The volume totals were reported lighter than the prior session totals on the Nasdaq exchange and on the NYSE. Breadth was negative as decliners led advancers by an 8-7 ratio on the NYSE and by nearly 3-2 on the Nasdaq exchange. The total number of new 52-week highs outnumbered new 52-week lows on the NYSE and on the Nasdaq exchange for a second consecutive session. There were also 33 high-ranked companies from the CANSLIM.net Leaders List made new 52-week highs and appeared on the CANSLIM.net BreakOuts Page, almost doubling the prior session total of 18 stocks. However, at Thursday's close there were gains for only 5 of the 15 high-ranked companies currently included on the Featured Stocks Page.
Stocks moved higher in early action after China unexpectedly cut its key lending rate and U.S. weekly jobless claims came in modestly better-than-expected. Investors were optimistic heading into Ben Bernanke's testimony to the Joint Economic Committee, hoping for hints at further easing measure by the Federal Reserve. However, Dr. Bernanke made no indication of Fed interaction. In addition, the Fed chairman reiterated the fragile nature of the U.S. recovery, citing the European crisis and pending fiscal-cliff as significant risks to the economy.
Material and industrial stocks initially rose on the prospect of improved growth out of China. Financials also began by adding to the prior session's gains, however Bank of America Corp (BAC -2.88%) and The Goldman Sachs Group Inc (GS -1.01%) ended in the red as the influential financial group reversed course. On the earnings front, shares of Men's Warehouse Inc (MW -18.89%) were torn apart after it fell short of estimates. Lululemon Athletica Inc (LULU -8.83%) gapped down below prior lows. Its consolidation stretched toward its 200-day moving average (DMA) line after the company topped earnings projections, but forecasted full year guidance below analysts' projections.
In bondland, Treasuries were mixed along the curve with the 10-year note up 7 ticks to yield 1.64% and the 30-year bond down 3 ticks to yield 2.75%.
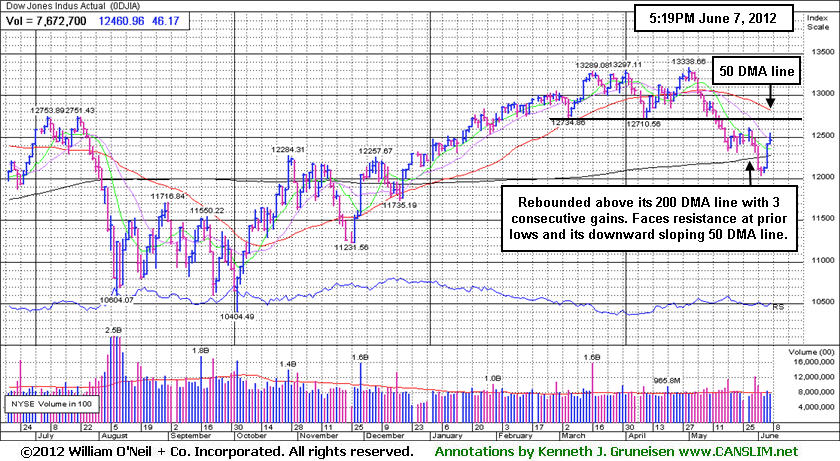
Technically, the big gains by the major averages on Wednesday's session were too soon (Day 3) in the nascent rally attempt to be considered a valid follow-through day (FTD). The expansion in leadership (new highs) and the major indices' rebounds above their respective 200-day moving average (DMA) lines with gains on higher volume were encouraging signs.
The major averages (M criteria) are technically still considered to be in a rally attempt within an ongoing correction, and stocks may still be vulnerable to greater downside. Historical studies suggest that the most constructive market rallies produced a solid follow-through day (FTD) between Days 4-7 of a new rally effort. Gains of +1.4% or greater by at least one of the major indexes should be backed by higher volume (preferably above average volume) coupled with an expansion in the number of stocks hitting new highs. Only fresh technical proof may give fact-based investors the clearance to begin with new buying efforts strictly in sound buy candidates. Meanwhile, investors should keep up a watchlist of worthy buy candidates while remaining protective of capital.
PICTURED: The Dow Jones Industrial Average rebounded above its 200-day moving average (DMA) line with 3 consecutive gains in its current rally attempt. It faces resistance at prior lows and its downward sloping 50 DMA line. When that short-term average has a downward slope it is fair to say the market has been struggling for a while, and disciplined investors following the fact-based investment system have likely moved much of their cash to the sidelines. This tactical approach reduces stress and protects precious capital during bearish market environments. This also helps to preserve investors' confidence so they are ready to act when a new confirmed rally eventually presents itself while less experienced investors might still be nursing their wounds.
|
 Kenneth J. Gruneisen started out as a licensed stockbroker in August 1987, a couple of months prior to the historic stock market crash that took the Dow Jones Industrial Average down -22.6% in a single day. He has published daily fact-based fundamental and technical analysis on high-ranked stocks online for two decades. Through FACTBASEDINVESTING.COM, Kenneth provides educational articles, news, market commentary, and other information regarding proven investment systems that work in good times and bad.
Comments contained in the body of this report are technical opinions only and are not necessarily those of Gruneisen Growth Corp. The material herein has been obtained from sources believed to be reliable and accurate, however, its accuracy and completeness cannot be guaranteed. Our firm, employees, and customers may effect transactions, including transactions contrary to any recommendation herein, or have positions in the securities mentioned herein or options with respect thereto. Any recommendation contained in this report may not be suitable for all investors and it is not to be deemed an offer or solicitation on our part with respect to the purchase or sale of any securities. |
|
 |
Healthcare Index Not Recovering Above 200-Day Average
Kenneth J. Gruneisen - Passed the CAN SLIM® Master's Exam
The Bank Index ($BKX +0.09%) held its ground on Thursday but erased early gains, meanwhile the Broker/Dealer Index ($XBD -1.30%) ended he session with a loss. The tech sector faced pressure as the Semiconductor Index ($SOX -1.37%), Networking Index ($NWX -1.22%), Biotechnology Index ($BTK -0.54%), and the Internet Index ($IIX -0.43%) ended with unanimous losses. The Retail Index ($RLX -0.33%) edged lower. Energy-related shares were mixed as the Oil Services Index ($OSX -0.46%) ended with a small loss while the Integrated Oil Index ($XOI +0.37%) tallied a small gain. The Gold & Silver Index ($XAU -2.75%) was hit with a big loss, not rewarding defensively positioned investors.
Charts courtesy www.stockcharts.com
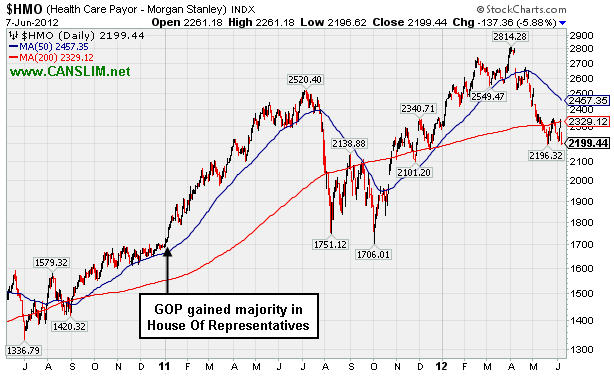
PICTURED: The Healthcare Index ($HMO -5.88%) was a standout as it fell sharply on Thursday after encountering resistance at its 200-day moving average line. A decision from the Supreme Court is expected during June concerning the fate of Obamacare. The 2-year graph above illustrates its choppy ascent since the GOP gained a majority in the House Of Representatives. By all accounts, the US government stands to be the biggest consumer of healthcare services with a huge wave of aging baby boomers anticipating Medicare entitlements regardless of the decision concerning the case pending.
| Oil Services |
$OSX |
202.85 |
-0.93 |
-0.46% |
-6.21% |
| Healthcare |
$HMO |
2,199.44 |
-137.36 |
-5.88% |
-3.60% |
| Integrated Oil |
$XOI |
1,124.68 |
+4.11 |
+0.37% |
-8.50% |
| Semiconductor |
$SOX |
367.47 |
-5.10 |
-1.37% |
+0.83% |
| Networking |
$NWX |
207.61 |
-2.56 |
-1.22% |
-3.51% |
| Internet |
$IIX |
296.92 |
-1.29 |
-0.43% |
+5.39% |
| Broker/Dealer |
$XBD |
85.56 |
-1.13 |
-1.30% |
+2.75% |
| Retail |
$RLX |
605.31 |
-1.99 |
-0.33% |
+15.69% |
| Gold & Silver |
$XAU |
161.14 |
-4.55 |
-2.75% |
-10.79% |
| Bank |
$BKX |
42.90 |
+0.04 |
+0.09% |
+8.94% |
| Biotech |
$BTK |
1,407.24 |
-7.63 |
-0.54% |
+28.94% |
|
|
|
 |
Resilient Leader Forming New Base During Market Correction
Kenneth J. Gruneisen - Passed the CAN SLIM® Master's Exam
When a leading stock which is already included on the Featured Stocks page is setting up with a new base, or when it is trading near a secondary buy point following an earlier breakout, the stock may be highlighted in yellow again as a "noteworthy" and potentially action-worthy buy candidate. The most relevant factors are noted in the report which alerts prudent CANSLIM oriented investors to place the issue in their watch list. After doing any necessary backup research, the investor is prepared to act after the stock triggers a technical buy signal (breaks above its pivot point on more than +50% average turnover) but before it gets too extended from a sound base. In the event the stock fails to trigger a technical buy signal and its price declines then it will simply be removed from the watch list.
Disciplined investors know that the M criteria can override all other favorable characteristics, as 3 out of 4 stocks tend to move in the direction of the major averages. During confirmed rallies only, investors know to buy fresh breakouts as near as possible to the pivot point and avoid chasing stocks after they have rallied more than +5% above their pivot point. It is crucial to always limit losses whenever any stock heads the wrong direction, and disciplined investors always sell if a struggling stock ever falls more than -7% from their purchase price.
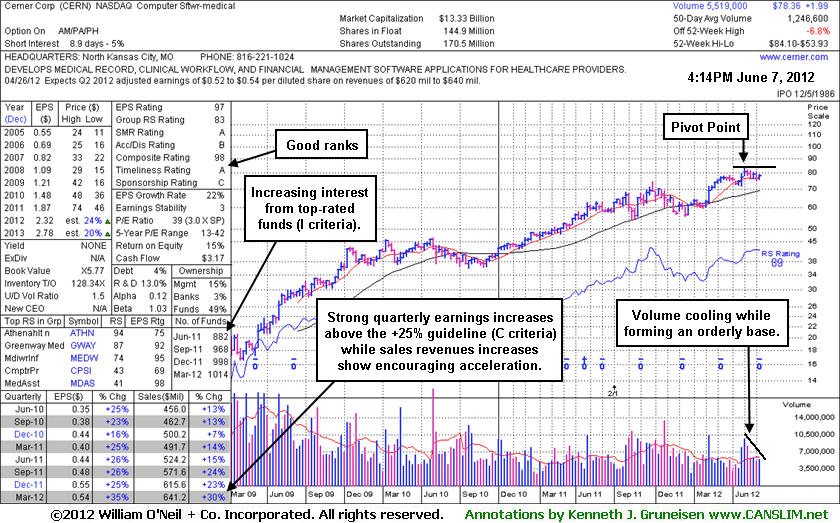
Cerner Corp (CERN +$0.14 or +0.18% to $78.36) finished near the session low today while posting a 4th consecutive gain. Gains backed by above average volume helped it rebound back above its 50-day moving average (DMA) line recently. A new pivot point has been cited based on its 5/01/12 high plus 10 cents. That day marked its last appearance in this FSU section under the headline, "Streak of Volume-Driven Gains Rallying Above "Max Buy" Level". Volume-driven gains are needed to trigger a new (or add-on) technical buy signal. Meanwhile, any damaging losses below its recent low ($75.57 on 6/01/12) would raise more serious concerns and trigger more worrisome technical sell signals. It has been encountering some distributional pressure recently, and the M criteria requires a FTD before any new buying efforts may be considered under the investment system's guidelines. Disciplined investors know there is no advantage to getting in "early" before a convincing buy signal has confirmed proof of fresh institutional accumulation driving share prices higher.
Little overhead supply remains to act as resistance while it is now -6.8% off its 52-week high and building on a 6-week flat base pattern (shown on its annotated weekly graph below) . The Computer Software - Medical firm's quarterly sales revenues and earnings per share track record and its annual earnings history (C and A criteria) satisfy the investment system's fundamental guidelines. Sequentially, the recent quarterly comparisons show acceleration in its sales revenues growth rate, a reassuring sign of greater demand for its products and services. The number of top-rated funds owning its shares rose from 882 in Jun '11 to 1,014 in Mar '12, a reassuring sign concerning the I criteria. It is already heavily owned by the institutional crowd, yet its current Up/Down Volume Ratio of 1.5 is an unbiased indication that its shares have been under accumulation in the past 50 days.
|
|
|
Color Codes Explained :
Y - Better candidates highlighted by our
staff of experts.
G - Previously featured
in past reports as yellow but may no longer be buyable under the
guidelines.
***Last / Change / Volume data in this table is the closing quote data***
Symbol/Exchange
Company Name
Industry Group |
PRICE |
CHANGE
(%Change) |
Day High |
Volume
(% DAV)
(% 50 day avg vol) |
52 Wk Hi
% From Hi |
Featured
Date |
Price
Featured |
Pivot Featured |
|
Max Buy |
ALXN
-
NASDAQ
Alexion Pharmaceuticals
DRUGS - Drug Manufacturers - Other
|
$90.38
|
-0.46
-0.51% |
$92.00
|
949,775
45.98% of 50 DAV
50 DAV is 2,065,800
|
$95.01
-4.87%
|
5/1/2012
|
$91.73
|
PP = $95.11
|
|
MB = $99.87
|
Most Recent Note - 6/6/2012 6:18:47 PM
Y - Color code is changed to yellow after a 3rd consecutive gain today backed by light volume helped it rebound above its 50 DMA line. No new pivot point is being cited, and it faces near-term resistance in the $94-95 area.
>>> The latest Featured Stock Update with an annotated graph appeared on 5/31/2012. Click here.
View all notes |
Alert me of new notes |
CANSLIM.net Company Profile |
SEC |
Zacks Reports |
StockTalk |
News |
Chart |
Request a new note
C
A N
S L
I M


|
ASPS
-
NASDAQ
Altisource Ptf Sltns Sa
REAL ESTATE - Property Management/Developmen
|
$63.76
|
-0.64
-0.99% |
$64.79
|
90,038
67.90% of 50 DAV
50 DAV is 132,600
|
$65.71
-2.97%
|
6/5/2012
|
$60.01
|
PP = $63.00
|
|
MB = $66.15
|
Most Recent Note - 6/6/2012 6:11:51 PM
Y - Today's 3rd consecutive gain backed by +55% above average volume helped it rally above the pivot point cited based on its 4/26/12 high. Technically it triggered a buy signal, however the major averages (M criteria) also need to confirm a new rally with a solid follow-through day before any new buying efforts are justified under the fact-based investment system.
>>> The latest Featured Stock Update with an annotated graph appeared on 6/5/2012. Click here.
View all notes |
Alert me of new notes |
CANSLIM.net Company Profile |
SEC |
Zacks Reports |
StockTalk |
News |
Chart |
Request a new note
C
A N
S L
I M
|
CERN
-
NASDAQ
Cerner Corp
COMPUTER SOFTWARE and SERVICES - Healthcare Information Service
|
$78.36
|
+0.14
0.18% |
$79.26
|
1,744,135
139.91% of 50 DAV
50 DAV is 1,246,600
|
$84.10
-6.83%
|
6/7/2012
|
$78.36
|
PP = $84.20
|
|
MB = $88.41
|
 Most Recent Note - 6/7/2012 6:17:43 PM
Y - It has been encountering distributional pressure and the M criteria requires a FTD before any new buying efforts may be considered under the investment system's guidelines. Color code was changed to yellow and a new pivot point has been cited based on its 5/01/12 high plus 10 cents. Volume-driven gains are needed to trigger a new (or add-on) technical buy signal. See the latest FSU analysis for more details and a new annotated weekly graph.
>>> The latest Featured Stock Update with an annotated graph appeared on 6/7/2012. Click here.
View all notes |
Alert me of new notes |
CANSLIM.net Company Profile |
SEC |
Zacks Reports |
StockTalk |
News |
Chart |
Request a new note
C
A N
S L
I M
|
CMCSA
-
NASDAQ
Comcast Corp Cl A
MEDIA - CATV Systems
|
$30.01
|
+0.26
0.86% |
$30.29
|
16,884,312
129.76% of 50 DAV
50 DAV is 13,011,900
|
$30.88
-2.80%
|
5/2/2012
|
$30.04
|
PP = $30.51
|
|
MB = $32.04
|
Most Recent Note - 6/6/2012 6:16:38 PM
Y - Today's 3rd consecutive gain helped it rally above its 50 DMA line helping its technical stance improve. Color code is changed to yellow based on its resilience while no new pivot point is being cited. The prior low ($28.09 on 5/21/12) defines important near-term support to watch where further deterioration would raise more serious concerns.
>>> The latest Featured Stock Update with an annotated graph appeared on 5/7/2012. Click here.
View all notes |
Alert me of new notes |
CANSLIM.net Company Profile |
SEC |
Zacks Reports |
StockTalk |
News |
Chart |
Request a new note
C
A N
S L
I M
|
COO
-
NYSE
Cooper Companies Inc
HEALTH SERVICES - Medical Instruments and Supplies
|
$80.06
|
-2.09
-2.54% |
$83.27
|
816,724
173.48% of 50 DAV
50 DAV is 470,800
|
$89.31
-10.36%
|
3/9/2012
|
$83.05
|
PP = $81.02
|
|
MB = $85.07
|
Most Recent Note - 6/7/2012 3:06:37 PM
G - Due to report earnings for the quarter ended April 30, 2012 after the close today. Faces resistance due to overhead supply up through the $89 area after a damaging streak of losses recently triggered sell signals.
>>> The latest Featured Stock Update with an annotated graph appeared on 5/18/2012. Click here.
View all notes |
Alert me of new notes |
CANSLIM.net Company Profile |
SEC |
Zacks Reports |
StockTalk |
News |
Chart |
Request a new note
C
A N
S L
I M
|
Symbol/Exchange
Company Name
Industry Group |
PRICE |
CHANGE
(%Change) |
Day High |
Volume
(% DAV)
(% 50 day avg vol) |
52 Wk Hi
% From Hi |
Featured
Date |
Price
Featured |
Pivot Featured |
|
Max Buy |
DG
-
NYSE
Dollar General Corp
RETAIL - Discount, Variety Stores
|
$48.98
|
+0.28
0.57% |
$49.49
|
4,736,792
137.76% of 50 DAV
50 DAV is 3,438,400
|
$49.50
-1.05%
|
5/7/2012
|
$48.51
|
PP = $47.69
|
|
MB = $50.07
|
Most Recent Note - 6/7/2012 12:06:45 PM
G - Found support near its 50 DMA line and today it is perched at its 52-week and all-time highs. Completed another Secondary Offering on 6/05/12, its 4th Secondary Offering since September '11. Reported earnings +31% on +13% sales revenues for the quarter ended April 30, 2012 versus the year ago period. The broader market (M criteria) has yet to confirm a new rally, however, and without a solid follow-through day from at least one of the major averages all new buying efforts are discouraged under the fact-based investment system.
>>> The latest Featured Stock Update with an annotated graph appeared on 5/9/2012. Click here.
View all notes |
Alert me of new notes |
CANSLIM.net Company Profile |
SEC |
Zacks Reports |
StockTalk |
News |
Chart |
Request a new note
C
A N
S L
I M
|
EXPE
-
NASDAQ
Expedia Inc
INTERNET - Internet Information Providers
|
$46.03
|
-0.66
-1.41% |
$47.78
|
3,461,522
73.12% of 50 DAV
50 DAV is 4,734,100
|
$46.96
-1.98%
|
4/27/2012
|
$41.80
|
PP = $35.57
|
|
MB = $37.35
|
Most Recent Note - 6/6/2012 6:06:19 PM
G - Hit another new 52-week high today with a gain backed by very light volume, its 3rd consecutive gain with below average volume, getting more extended from its prior highs in the $43 area.
>>> The latest Featured Stock Update with an annotated graph appeared on 5/3/2012. Click here.
View all notes |
Alert me of new notes |
CANSLIM.net Company Profile |
SEC |
Zacks Reports |
StockTalk |
News |
Chart |
Request a new note
C
A N
S L
I M
|
GNC
-
NYSE
G N C Holdings Inc
RETAIL - Drug Stores
|
$37.31
|
-0.36
-0.96% |
$38.30
|
1,776,526
94.63% of 50 DAV
50 DAV is 1,877,400
|
$41.95
-11.06%
|
1/19/2012
|
$28.99
|
PP = $29.60
|
|
MB = $31.08
|
Most Recent Note - 6/6/2012 5:59:10 PM
G - Posted a 2nd consecutive gain on below average volume after halting its slide following a 50 DMA line violation and streak of 6 consecutive losses. Recent lows define important near-term support while it could be forming a "double bottom" base. See the latest FSU analysis for more details and a new annotated graph.
>>> The latest Featured Stock Update with an annotated graph appeared on 6/6/2012. Click here.
View all notes |
Alert me of new notes |
CANSLIM.net Company Profile |
SEC |
Zacks Reports |
StockTalk |
News |
Chart |
Request a new note
C
A N
S L
I M
|
NTES
-
NASDAQ
Netease Inc Adr
INTERNET - Internet Information Providers
|
$63.61
|
+0.53
0.84% |
$65.54
|
597,318
81.51% of 50 DAV
50 DAV is 732,800
|
$63.72
-0.17%
|
3/19/2012
|
$56.18
|
PP = $55.10
|
|
MB = $57.86
|
Most Recent Note - 6/6/2012 5:03:49 PM
G - Rallied with above average volume to a new 52-week high today. It had not formed a sound base pattern. Recent lows near the $55 area define important chart support to watch where a violation may trigger a worrisome technical sell signal.
>>> The latest Featured Stock Update with an annotated graph appeared on 5/24/2012. Click here.
View all notes |
Alert me of new notes |
CANSLIM.net Company Profile |
SEC |
Zacks Reports |
StockTalk |
News |
Chart |
Request a new note
C
A N
S L
I M
|
SWI
-
NYSE
Solarwinds Inc
COMPUTER SOFTWARE and SERVICES - Application Software
|
$44.44
|
+0.23
0.52% |
$45.20
|
1,040,456
94.20% of 50 DAV
50 DAV is 1,104,500
|
$48.64
-8.63%
|
4/26/2012
|
$45.15
|
PP = $42.32
|
|
MB = $44.44
|
Most Recent Note - 6/6/2012 6:07:53 PM
G - Posted a 2nd consecutive gain on lighter volume today after halting its 4-session slide at its 50 DMA line. A damaging violation of that short-term average and the prior session's low ($41.24) would trigger a more worrisome technical sell signal.
>>> The latest Featured Stock Update with an annotated graph appeared on 5/21/2012. Click here.
View all notes |
Alert me of new notes |
CANSLIM.net Company Profile |
SEC |
Zacks Reports |
StockTalk |
News |
Chart |
Request a new note
C
A N
S L
I M
|
Symbol/Exchange
Company Name
Industry Group |
PRICE |
CHANGE
(%Change) |
Day High |
Volume
(% DAV)
(% 50 day avg vol) |
52 Wk Hi
% From Hi |
Featured
Date |
Price
Featured |
Pivot Featured |
|
Max Buy |
SXCI
-
NASDAQ
S X C Health Solutions
COMPUTER SOFTWARE and SERVICES - Healthcare Information Service
|
$92.88
|
-0.62
-0.66% |
$94.85
|
729,846
59.92% of 50 DAV
50 DAV is 1,218,100
|
$100.50
-7.58%
|
2/23/2012
|
$68.24
|
PP = $66.05
|
|
MB = $69.35
|
Most Recent Note - 6/6/2012 6:09:06 PM
G - Posted a 2nd consecutive gain today on below average volume after halting its slide at its 50 DMA line, important support for chart readers. Completed a new Public Offering on 5/10/12. It may be forming a new base, however the M criteria argues against new buying efforts without a confirmed rally with a solid FTD from at least one of the major averages.
>>> The latest Featured Stock Update with an annotated graph appeared on 5/17/2012. Click here.
View all notes |
Alert me of new notes |
CANSLIM.net Company Profile |
SEC |
Zacks Reports |
StockTalk |
News |
Chart |
Request a new note
C
A N
S L
I M
|
TDG
-
NYSE
Transdigm Group Inc
AEROSPACE/DEFENSE - Aerospace/Defense Products and; Services
|
$126.19
|
-0.55
-0.43% |
$128.00
|
463,131
86.34% of 50 DAV
50 DAV is 536,400
|
$132.69
-4.90%
|
2/29/2012
|
$120.10
|
PP = $118.93
|
|
MB = $124.88
|
Most Recent Note - 6/6/2012 6:00:26 PM
G - Considerable gain today on near average volume, rallying from important support at its 50 DMA line. Its prior low ($118.43 on 5/18/12) defines the next important near-term chart support level to watch.
>>> The latest Featured Stock Update with an annotated graph appeared on 5/23/2012. Click here.
View all notes |
Alert me of new notes |
CANSLIM.net Company Profile |
SEC |
Zacks Reports |
StockTalk |
News |
Chart |
Request a new note
C
A N
S L
I M
|
UA
-
NYSE
Under Armour Inc Cl A
CONSUMER NON-DURABLES - Textile - Apparel Clothing
|
$99.82
|
-1.53
-1.51% |
$101.15
|
981,191
105.01% of 50 DAV
50 DAV is 934,400
|
$102.86
-2.96%
|
2/15/2012
|
$85.77
|
PP = $84.86
|
|
MB = $89.10
|
Most Recent Note - 6/6/2012 6:02:59 PM
G - Rose near its 52-week high and best-ever close today with a 3rd consecutive gain on below average volume. No resistance remains due to overhead supply. Fundamental concerns remain after a slightly sub par earnings increase in the Dec '11 quarter.
>>> The latest Featured Stock Update with an annotated graph appeared on 5/29/2012. Click here.
View all notes |
Alert me of new notes |
CANSLIM.net Company Profile |
SEC |
Zacks Reports |
StockTalk |
News |
Chart |
Request a new note
C
A N
S L
I M
|
VSI
-
NYSE
Vitamin Shoppe Inc
SPECIALTY RETAIL - Specialty Retail, Other
|
$50.25
|
-0.81
-1.59% |
$51.81
|
219,704
47.15% of 50 DAV
50 DAV is 466,000
|
$55.29
-9.12%
|
4/25/2012
|
$47.77
|
PP = $48.46
|
|
MB = $50.88
|
Most Recent Note - 6/7/2012 3:41:43 PM
Y - Quietly consolidating above prior highs in the $48 area which define important chart support. Market conditions argue against new buying efforts until a FTD from at least one of the major averages confirms a new rally. Color code is changed to yellow while one may consider a secondary buy point from its successful test of the 10 week average up to +5% above the recent high. Disciplined investors always limit losses by selling if a stock falls more than -7% from their buy price.
>>> The latest Featured Stock Update with an annotated graph appeared on 6/4/2012. Click here.
View all notes |
Alert me of new notes |
CANSLIM.net Company Profile |
SEC |
Zacks Reports |
StockTalk |
News |
Chart |
Request a new note
C
A N
S L
I M
|
WFM
-
NASDAQ
Whole Foods Market Inc
RETAIL - Grocery Stores
|
$90.27
|
-0.56
-0.62% |
$91.22
|
1,529,282
85.47% of 50 DAV
50 DAV is 1,789,300
|
$91.50
-1.34%
|
5/3/2012
|
$90.28
|
PP = $86.45
|
|
MB = $90.77
|
Most Recent Note - 6/6/2012 6:14:17 PM
Y - Today's gain on average volume led to a best-ever close near its 52-week high. Color code was changed to yellow based on recent resilience while no new pivot point was cited. The high-ranked Retail - Super/Mini Markets firm found prompt support near its 50 DMA line after damaging losses negated the latest technical breakout. Confirming gains backed by higher volume, and a FTD from at least one of the major averages would be important and reassuring signs worth watching for.
>>> The latest Featured Stock Update with an annotated graph appeared on 5/11/2012. Click here.
View all notes |
Alert me of new notes |
CANSLIM.net Company Profile |
SEC |
Zacks Reports |
StockTalk |
News |
Chart |
Request a new note
C
A N
S L
I M
|
Symbol/Exchange
Company Name
Industry Group |
PRICE |
CHANGE
(%Change) |
Day High |
Volume
(% DAV)
(% 50 day avg vol) |
52 Wk Hi
% From Hi |
Featured
Date |
Price
Featured |
Pivot Featured |
|
Max Buy |
|
|
|
THESE ARE NOT BUY RECOMMENDATIONS!
Comments contained in the body of this report are technical
opinions only. The material herein has been obtained
from sources believed to be reliable and accurate, however,
its accuracy and completeness cannot be guaranteed.
This site is not an investment advisor, hence it does
not endorse or recommend any securities or other investments.
Any recommendation contained in this report may not
be suitable for all investors and it is not to be deemed
an offer or solicitation on our part with respect to
the purchase or sale of any securities. All trademarks,
service marks and trade names appearing in this report
are the property of their respective owners, and are
likewise used for identification purposes only.
This report is a service available
only to active Paid Premium Members.
You may opt-out of receiving report notifications
at any time. Questions or comments may be submitted
by writing to Premium Membership Services 665 S.E. 10 Street, Suite 201 Deerfield Beach, FL 33441-5634 or by calling 1-800-965-8307
or 954-785-1121.
|
|
|

