You are not logged in.
This means you
CAN ONLY VIEW reports that were published prior to Monday, April 14, 2025.
You
MUST UPGRADE YOUR MEMBERSHIP if you want to see any current reports.
AFTER MARKET UPDATE - MONDAY, JUNE 7TH, 2010
Previous After Market Report Next After Market Report >>>
|
|
|
|
DOW |
-115.48 |
9,816.49 |
-1.16% |
|
Volume |
1,426,342,280 |
-13% |
|
Volume |
2,147,222,350 |
-6% |
|
NASDAQ |
-45.27 |
2,173.90 |
-2.04% |
|
Advancers |
812 |
26% |
|
Advancers |
467 |
17% |
|
S&P 500 |
-14.41 |
1,050.47 |
-1.35% |
|
Decliners |
2,242 |
71% |
|
Decliners |
2,253 |
80% |
|
Russell 2000 |
-15.48 |
618.49 |
-2.44% |
|
52 Wk Highs |
20 |
|
|
52 Wk Highs |
9 |
|
|
S&P 600 |
-7.81 |
331.72 |
-2.30% |
|
52 Wk Lows |
92 |
|
|
52 Wk Lows |
152 |
|
|
 |
Breadth Poor As Indices Fall On Lighter Volume
Adam Sarhan, Contributing Writer,
The major averages negatively reversed on Monday (opened higher but closed lower) as the euro slid to a fresh 4-year low. Volume, an important indicator of institutional sponsorship, was lower than Friday's levels. Decliners trumped advancers by almost a 3-to-1 ratio on the NYSE and by nearly a 5-to-1 ratio on the Nasdaq exchange. There were only 4 high-ranked companies from the CANSLIM.net Leaders List that made a new 52-week high and appeared on the CANSLIM.net BreakOuts Page, lower than the 6 issues that appeared on the prior session. New 52-week lows outnumbered new 52-week highs on the NYSE and the Nasdaq exchange.
Overnight the euro slid to $1.188, a fresh 4-year low, sparking more concerns that the EU contagion woes will worsen. A host of Asian markets also fell on the first trading day since the US jobs report was released on Friday. This set a negative tone for Monday's session. After a slightly positive open, the bears quickly showed up and sent stocks lower after a slew of market leaders traded in the red. Apple Inc. (AAPL -1.96%) fell even as Steve Jobs released the new iPhone. The new phone sports a clearer screen and the ability for video chat, among other upgrades. Elsewhere, Goldman Sachs (GS -2.51%) got smacked after it received a subpoena from the Financial Crisis Inquiry Commission (FCIS) due to its failure to comply with requests for documents.
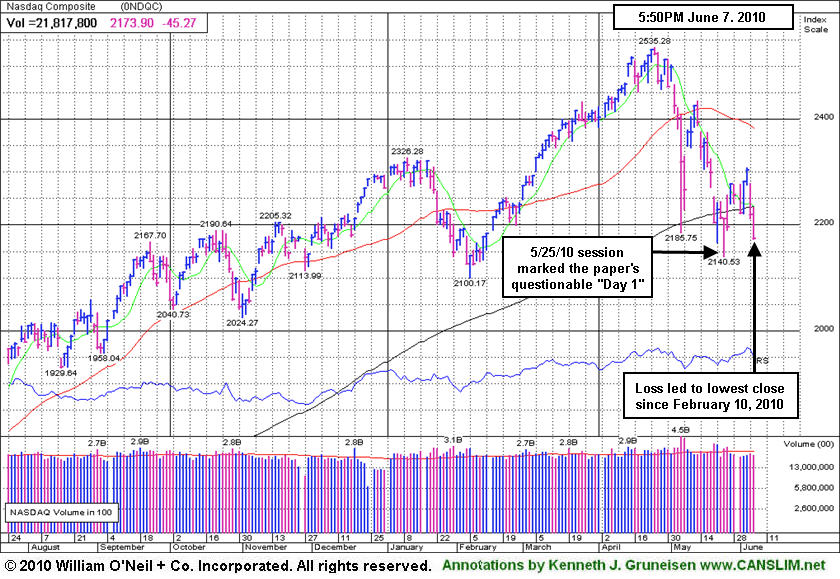
From our vantage point, the latest three day rally failed, evidenced by a new 2010 low close for the Dow Jones Industrial Average & benchmark S&P 500 Index. The author of "How To Make Money In Stocks", the book that explains the fact-based investment system, has observed in the past that a market should not be considered to be in "healthy" shape unless at least 2 of the 3 major averages are trading above their rising 200-day moving average (DMA) lines. This played a pivotal role in our view in recent weeks. As of Monday's close, The Nasdaq Composite, Dow Jones Industrial Average, S&P 500 and small-cap Russell 2000 Index unanimously closed below their respective 200 DMA lines. Therefore, the bears will likely remain in control until these popular averages close above those important levels.
Professional Money Management Services - Free Portfolio Review:
If your portfolio is greater than $100,000 and you would like a free portfolio review, click here to get connected with one of our portfolio managers. ** Serious inquires only, please.
PICTURED: The Nasdaq Composite Index's loss on Monday led to its lowest close since February 10, 2010. The annotated chart points out the 5/25/10 session which marked the paper's questionable "Day 1" of a new rally effort.
|
|
|
 |
Tech and Financial Shares Get Smacked Again
Kenneth J. Gruneisen - Passed the CAN SLIM® Master's Exam
The Gold & Silver Index ($XAU +1.89%) was a lone standout in the plus column while most groups ended lower on Monday. The tech sector slumped as the Semiconductor Index ($SOX -3.63%), Networking Index ($NWX -2.54%), Internet Index ($IIX -1.93%), and Biotechnology Index ($BTK -1.46%) ended unanimously lower. The Broker/Dealer Index ($XBD -2.97%), Bank Index ($BKX -2.31%) and the Retail Index ($RLX -1.71%) also influenced the major indices with their negative bias. The Healthcare Index ($HMO -1.06%) and energy-related shares also faced pressure as the Oil Services Index ($OSX -1.54%) and Integrated Oil Index ($XOI -0.41%) started the week with losses.
Charts courtesy www.stockcharts.com
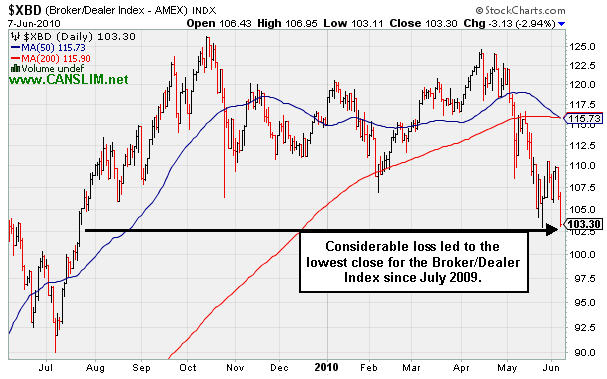
PICTURED: The Broker/Dealer Index ($XBD -2.97%) suffered another considerable loss, leading to its lowest close since July 2009.
| Oil Services |
$OSX |
162.29 |
-2.54 |
-1.54% |
-16.74% |
| Healthcare |
$HMO |
1,500.04 |
-16.14 |
-1.06% |
+1.84% |
| Integrated Oil |
$XOI |
911.21 |
-3.78 |
-0.41% |
-14.70% |
| Semiconductor |
$SOX |
335.84 |
-12.64 |
-3.63% |
-6.69% |
| Networking |
$NWX |
222.59 |
-5.79 |
-2.54% |
-3.67% |
| Internet |
$IIX |
229.67 |
-4.52 |
-1.93% |
-1.79% |
| Broker/Dealer |
$XBD |
103.27 |
-3.16 |
-2.97% |
-10.24% |
| Retail |
$RLX |
419.64 |
-7.30 |
-1.71% |
+2.07% |
| Gold & Silver |
$XAU |
172.25 |
+3.19 |
+1.89% |
+2.38% |
| Bank |
$BKX |
46.53 |
-1.10 |
-2.31% |
+8.94% |
| Biotech |
$BTK |
1,028.86 |
-15.19 |
-1.46% |
+9.21% |
|
|
|
 |
Recent Chart Lows Define Next Support Level
Kenneth J. Gruneisen - Passed the CAN SLIM® Master's Exam
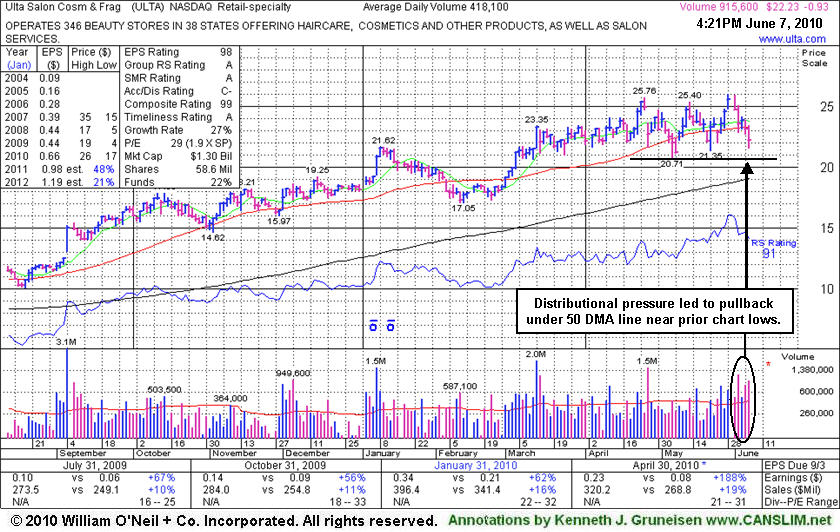
Ulta Salon Cosmetics & Fragrance, Inc. (ULTA -$0.93 or -4.02% to $22.23) sank below its 50-day moving average (DMA) line today, falling again with more above average volume behind the damage. For now it remains an ideal candidate for investors' watch lists, but the distributional pressure raises concerns while quickly pressuring it near prior chart lows. In the past it proved resilient and promptly rebounded above its short-term average. Meanwhile, the recent chart low ($20.71) defines the next important support level to watch, where any violations would raise more serious concerns and trigger additional technical sell signals. ULTA made very little headway since the detailed Stock Bulletin with annotated graph was published soon after it was featured in the 3/12/10 mid-day report (read here) as a considerable gain with heavy volume helped it reach a new 52-week high. It was noted as it rose from an 8-week cup shaped base following stronger results for the quarter ended January 31, 2010.
This high-ranked leader in the Retail - Misc group which has shown accelerating sales revenues increases. Strong quarterly earnings increases above the +25% guideline in the 3 latest quarterly comparisons satisfies the C criteria. The number of top-rated funds with an ownership interest has grown from 49 funds in March '09 to 78 funds as of Mar '10 which is an encouraging sign of increasing institutional interest (the I criteria). Management's 51% ownership stake keeps the company's directors very motivated to look after and build shareholder value.
|
|
|
Color Codes Explained :
Y - Better candidates highlighted by our
staff of experts.
G - Previously featured
in past reports as yellow but may no longer be buyable under the
guidelines.
***Last / Change / Volume data in this table is the closing quote data***
Symbol/Exchange
Company Name
Industry Group |
PRICE |
CHANGE
(%Change) |
Day High |
Volume
(% DAV)
(% 50 day avg vol) |
52 Wk Hi
% From Hi |
Featured
Date |
Price
Featured |
Pivot Featured |
|
Max Buy |
APEI
-
NASDAQ
American Public Educ Inc
DIVERSIFIED SERVICES - Education and Training Services
|
$46.46
|
+0.22
0.46% |
$48.17
|
403,370
284.26% of 50 DAV
50 DAV is 141,900
|
$47.23
-1.64%
|
6/7/2010
|
$46.60
|
PP = $46.29
|
|
MB = $48.60
|
 Most Recent Note - 6/7/2010 5:01:58 PM
Y - Finished in the lower half of its intra-day range, yet its gain and close above its pivot point with above average volume triggered a technical buy signal. Featured in the mid-day report (read here) as it spiked up to a new all-time high today with its 4th consecutive gain, rallying straight up from the bottom of a "double bottom" type base. This high-ranked leader has shown strong quarterly sales revenues and earnings growth and it has a great annual earnings (A criteria) history. Based on poor technical action it was dropped from the Featured Stocks list back on 10/08/08. 
>>> The latest Featured Stock Update with an annotated graph appeared on 9/17/2008. Click here.
View all notes |
Alert me of new notes |
CANSLIM.net Company Profile |
SEC |
Zacks Reports |
StockTalk |
News |
Chart |
Request a new note
C
A N
S L
I M


|
BIDU
-
NASDAQ
Baidu Inc Ads
INTERNET - Internet Information Providers
|
$69.81
|
-3.39
-4.63% |
$74.23
|
10,269,867
67.24% of 50 DAV
50 DAV is 15,272,600
|
$82.29
-15.17%
|
1/13/2010
|
$43.13
|
PP = $42.68
|
|
MB = $44.81
|
Most Recent Note - 6/7/2010 3:25:42 PM
G - Down on light volume today, consolidating toward its 50 DMA line, still extended from any sound base. A worrisome negative reversal from its all-time high on 5/13/10 followed a 10:1 stock split.
>>> The latest Featured Stock Update with an annotated graph appeared on 6/1/2010. Click here.
View all notes |
Alert me of new notes |
CANSLIM.net Company Profile |
SEC |
Zacks Reports |
StockTalk |
News |
Chart |
Request a new note
C
A N
S L
I M
|
BRLI
-
NASDAQ
Bio Reference Labs Inc
HEALTH SERVICES - Medical Laboratories and Researc
|
$22.30
|
-0.06
-0.27% |
$22.86
|
186,294
96.43% of 50 DAV
50 DAV is 193,200
|
$24.67
-9.62%
|
2/12/2010
|
$39.02
|
PP = $20.49
|
|
MB = $21.51
|
Most Recent Note - 6/7/2010 5:05:06 PM
G - It remains trading below its 50 DMA line. Consolidating for about 7 weeks since a 2:1 stock split effective on 4/22/10.
>>> The latest Featured Stock Update with an annotated graph appeared on 5/26/2010. Click here.
View all notes |
Alert me of new notes |
CANSLIM.net Company Profile |
SEC |
Zacks Reports |
StockTalk |
News |
Chart |
Request a new note
C
A N
S L
I M
|
CRM
-
NYSE
Salesforce.Com Inc
INTERNET - Internet Software and Services
|
$87.90
|
-1.74
-1.94% |
$91.49
|
2,699,571
114.68% of 50 DAV
50 DAV is 2,354,000
|
$96.35
-8.77%
|
6/2/2010
|
$88.44
|
PP = $89.60
|
|
MB = $94.08
|
Most Recent Note - 6/7/2010 5:10:39 PM
Y - Loss today raised concern as it finishing under its pivot point and prior high closes following a negative reversal on 6/04/10 after reaching a new all-time high. Its "breakaway gap" on 6/03/10 triggered a technical buy signal.
>>> The latest Featured Stock Update with an annotated graph appeared on 6/2/2010. Click here.
View all notes |
Alert me of new notes |
CANSLIM.net Company Profile |
SEC |
Zacks Reports |
StockTalk |
News |
Chart |
Request a new note
C
A N
S L
I M
|
LL
-
NYSE
Lumber Liquidators Hldgs
RETAIL - Home Improvement Stores
|
$27.83
|
+0.01
0.04% |
$28.32
|
281,928
80.87% of 50 DAV
50 DAV is 348,600
|
$33.41
-16.70%
|
4/22/2010
|
$29.87
|
PP = $29.03
|
|
MB = $30.48
|
Most Recent Note - 6/7/2010 5:13:21 PM
G - It remains trading below its 50 DMA line and December '09 highs. A rally back above its short-term average would help its outlook improve. A "negative reversal" on 4/26/10 marked its all-time high.
>>> The latest Featured Stock Update with an annotated graph appeared on 6/4/2010. Click here.
View all notes |
Alert me of new notes |
CANSLIM.net Company Profile |
SEC |
Zacks Reports |
StockTalk |
News |
Chart |
Request a new note
C
A N
S L
I M
|
Symbol/Exchange
Company Name
Industry Group |
PRICE |
CHANGE
(%Change) |
Day High |
Volume
(% DAV)
(% 50 day avg vol) |
52 Wk Hi
% From Hi |
Featured
Date |
Price
Featured |
Pivot Featured |
|
Max Buy |
LOPE
-
NASDAQ
Grand Canyon Education
DIVERSIFIED SERVICES - Education and; Training Services
|
$23.65
|
-0.47
-1.95% |
$24.36
|
632,363
150.03% of 50 DAV
50 DAV is 421,500
|
$28.46
-16.90%
|
4/13/2010
|
$27.71
|
PP = $27.33
|
|
MB = $28.70
|
Most Recent Note - 6/7/2010 5:16:04 PM
G - Loss today on higher volume led to its close just a penny below its 4/29/10 low of $23.66 previously noted as "important technical chart support."
>>> The latest Featured Stock Update with an annotated graph appeared on 5/27/2010. Click here.
View all notes |
Alert me of new notes |
CANSLIM.net Company Profile |
SEC |
Zacks Reports |
StockTalk |
News |
Chart |
Request a new note
C
A N
S L
I M
|
MELI
-
NASDAQ
Mercadolibre Inc
INTERNET - Internet Software and; Services
|
$51.02
|
-3.03
-5.61% |
$54.00
|
790,804
118.15% of 50 DAV
50 DAV is 669,300
|
$56.16
-9.15%
|
5/13/2010
|
$54.21
|
PP = $55.85
|
|
MB = $58.64
|
Most Recent Note - 6/7/2010 5:16:55 PM
Y - Pulled back toward its 50 DMA line today. Its latest rally effort fell short of producing a powerful gain above its pivot point with volume sufficient to trigger a proper technical buy signal.
>>> The latest Featured Stock Update with an annotated graph appeared on 5/28/2010. Click here.
View all notes |
Alert me of new notes |
CANSLIM.net Company Profile |
SEC |
Zacks Reports |
StockTalk |
News |
Chart |
Request a new note
C
A N
S L
I M
|
ROVI
-
NASDAQ
Rovi Corp
COMPUTER SOFTWARE andamp; SERVICES - Security Software andamp; Services
|
$36.29
|
-1.37
-3.64% |
$37.74
|
1,118,961
84.94% of 50 DAV
50 DAV is 1,317,300
|
$40.06
-9.41%
|
6/3/2010
|
$38.70
|
PP = $40.16
|
|
MB = $42.17
|
Most Recent Note - 6/7/2010 5:23:21 PM
G - Loss today on light volume, slumping under its 50 DMA line again. Color code is changed to green. It would need to rally back above its short-term average for its outlook to improve.
>>> The latest Featured Stock Update with an annotated graph appeared on 5/24/2010. Click here.
View all notes |
Alert me of new notes |
CANSLIM.net Company Profile |
SEC |
Zacks Reports |
StockTalk |
News |
Chart |
Request a new note
C
A N
S L
I M
|
SUMR
-
NASDAQ
Summer Infant Inc
CONSUMER NON-DURABLES - Personal Products
|
$7.15
|
-0.44
-5.80% |
$7.76
|
122,182
169.70% of 50 DAV
50 DAV is 72,000
|
$8.42
-15.08%
|
5/4/2010
|
$6.85
|
PP = $7.09
|
|
MB = $7.44
|
Most Recent Note - 6/7/2010 5:24:51 PM
G - Today marked its 4th loss with above average volume in the span of 5 sessions. Enduring moderate distributional pressure, it finished near prior chart highs and its 50 DMA line - important chart support levels.
>>> The latest Featured Stock Update with an annotated graph appeared on 5/21/2010. Click here.
View all notes |
Alert me of new notes |
CANSLIM.net Company Profile |
SEC |
Zacks Reports |
StockTalk |
News |
Chart |
Request a new note
C
A N
S L
I M
|
THOR
-
NASDAQ
Thoratec Corp
HEALTH SERVICES - Medical Instruments and Supplies
|
$42.75
|
-0.06
-0.14% |
$43.75
|
970,060
107.41% of 50 DAV
50 DAV is 903,100
|
$46.50
-8.06%
|
6/3/2010
|
$44.38
|
PP = $45.35
|
|
MB = $47.62
|
Most Recent Note - 6/7/2010 5:41:16 PM
Y - Held its ground today after 2 consecutive losses entirely erased its latest breakout.
>>> The latest Featured Stock Update with an annotated graph appeared on 6/3/2010. Click here.
View all notes |
Alert me of new notes |
CANSLIM.net Company Profile |
SEC |
Zacks Reports |
StockTalk |
News |
Chart |
Request a new note
C
A N
S L
I M
|
Symbol/Exchange
Company Name
Industry Group |
PRICE |
CHANGE
(%Change) |
Day High |
Volume
(% DAV)
(% 50 day avg vol) |
52 Wk Hi
% From Hi |
Featured
Date |
Price
Featured |
Pivot Featured |
|
Max Buy |
ULTA
-
NASDAQ
Ulta Salon Cosm & Frag
SPECIALTY RETAIL - Specialty Retail, Other
|
$22.23
|
-0.93
-4.02% |
$23.48
|
924,298
221.07% of 50 DAV
50 DAV is 418,100
|
$26.00
-14.50%
|
5/28/2010
|
$25.58
|
PP = $25.86
|
|
MB = $27.15
|
Most Recent Note - 6/7/2010 5:42:47 PM
G - Slumped below its 50 DMA line today, raising concerns while slumping near prior chart lows.
>>> The latest Featured Stock Update with an annotated graph appeared on 6/7/2010. Click here.
View all notes |
Alert me of new notes |
CANSLIM.net Company Profile |
SEC |
Zacks Reports |
StockTalk |
News |
Chart |
Request a new note
C
A N
S L
I M
|
|
|
|
THESE ARE NOT BUY RECOMMENDATIONS!
Comments contained in the body of this report are technical
opinions only. The material herein has been obtained
from sources believed to be reliable and accurate, however,
its accuracy and completeness cannot be guaranteed.
This site is not an investment advisor, hence it does
not endorse or recommend any securities or other investments.
Any recommendation contained in this report may not
be suitable for all investors and it is not to be deemed
an offer or solicitation on our part with respect to
the purchase or sale of any securities. All trademarks,
service marks and trade names appearing in this report
are the property of their respective owners, and are
likewise used for identification purposes only.
This report is a service available
only to active Paid Premium Members.
You may opt-out of receiving report notifications
at any time. Questions or comments may be submitted
by writing to Premium Membership Services 665 S.E. 10 Street, Suite 201 Deerfield Beach, FL 33441-5634 or by calling 1-800-965-8307
or 954-785-1121.
|
|
|


