You are not logged in.
This means you
CAN ONLY VIEW reports that were published prior to Monday, April 14, 2025.
You
MUST UPGRADE YOUR MEMBERSHIP if you want to see any current reports.
AFTER MARKET UPDATE - THURSDAY, JUNE 6TH, 2013
Previous After Market Report Next After Market Report >>>
|
|
|
|
DOW |
+80.03 |
15,040.62 |
+0.53% |
|
Volume |
799,612,880 |
+8% |
|
Volume |
1,732,090,520 |
-1% |
|
NASDAQ |
+22.57 |
3,424.05 |
+0.66% |
|
Advancers |
2,371 |
76% |
|
Advancers |
1,752 |
68% |
|
S&P 500 |
+13.66 |
1,622.56 |
+0.85% |
|
Decliners |
670 |
21% |
|
Decliners |
734 |
28% |
|
Russell 2000 |
+11.30 |
979.46 |
+1.17% |
|
52 Wk Highs |
25 |
|
|
52 Wk Highs |
73 |
|
|
S&P 600 |
+5.32 |
549.88 |
+0.98% |
|
52 Wk Lows |
63 |
|
|
52 Wk Lows |
27 |
|
|
 |
Major Averages Managed a Positive Reversal
Kenneth J. Gruneisen - Passed the CAN SLIM® Master's Exam
The major averages overcame early losses and rose on Thursday. The volume totals were reported mixed, slightly higher than the prior session total on the NYSE and lower on the Nasdaq exchange. Breadth was positive as advancers led decliners by more than a 3-1 margin on the NYSE and by more than 2-1 on the Nasdaq exchange. There were 15 high-ranked companies from the CANSLIM.net Leaders List making new 52-week highs and appearing on the CANSLIM.net BreakOuts Page, versus the prior session total of 9 stocks. New 52-week lows outnumbered new 52-week highs on the NYSE, meanwhile on the Nasdaq exchange new 52-week highs still outnumbered new 52-week lows. There were gains for 9 of the 12 high-ranked companies currently included on the Featured Stocks Page.
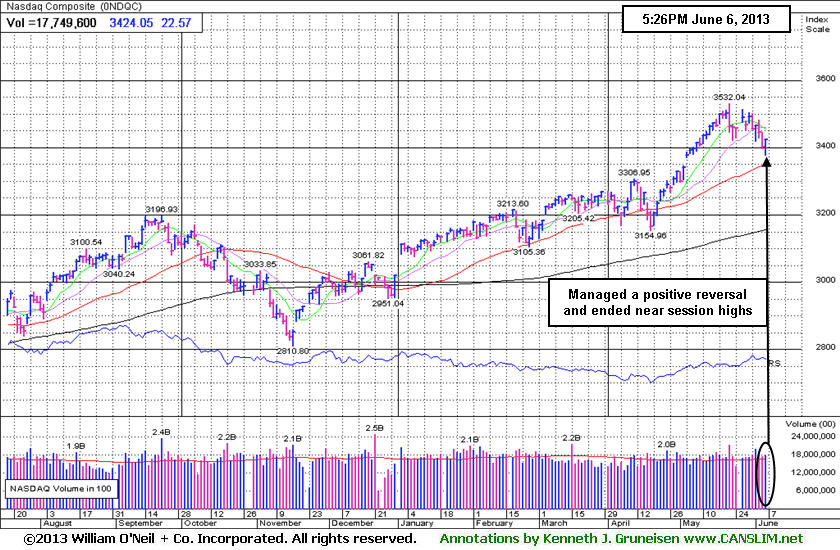
The major averages ended the choppy trading session higher ahead of Friday's employment report. Expectations are non-farm payrolls added 165,000 jobs in May while the unemployment rate remained steady at 7.5%. Before the open, a report showed weekly initial jobless claims fell 11,000 to 346,000, essentially in-line with consensus estimates. The market also searched for direction after the European Central Bank maintained its benchmark interest rates at record low levels.
Defensive sectors were outperforming in the session with telecom and utilities among the best performing groups. Verizon Communications Inc (VZ +3.46%) and shares of PG&E Corp (PCG +2.27%) rose. Technology was the worst performing as Oracle Corp (ORCL -2.26%) retreated and Apple Inc (AAPL -1.49%) declined. On the earnings front, network equipment maker Ciena Corp (CIEN +17.41%) rallied after posting positive quarterly results. J.M. Smucker (SJM -3.9%) fell after fourth-quarter sales fell short of consensus projections.
The market (M criteria) uptrend clearly came under pressure as May drew to a close, and the ongoing weakness is threatening to become a full blown "correction". However, lighter volume totals are a sign that institutional volume has not been intensifying while the major averages have retreated. As more damaging losses mount in the broader market this can serve as a reminder for investors to be protective of any gains and to limit losses by being especially watchful for any individual issues flashing technical sell signals. It is vitally important to your success with the fact-based investment system to reduce exposure and preserve cash during market downdrafts.
As always, watch upcoming CANSLIM.net reports for new action-worthy leaders best matching the winning models to be covered as they emerge and then included on the Featured Stocks Page - with our Certified experts' latest notes and links to additional resources including detailed analysis with annotated graphs. The Premium Member Homepage - includes "dynamic archives" to all prior pay reports published. Watch for an announcement via email concerning the next WEBCAST.
PICTURED: The Nasdaq Composite Index managed a "positive reversal" and finished near the session high. It remains well above its 50-day moving average (DMA) line.
|
 Kenneth J. Gruneisen started out as a licensed stockbroker in August 1987, a couple of months prior to the historic stock market crash that took the Dow Jones Industrial Average down -22.6% in a single day. He has published daily fact-based fundamental and technical analysis on high-ranked stocks online for two decades. Through FACTBASEDINVESTING.COM, Kenneth provides educational articles, news, market commentary, and other information regarding proven investment systems that work in good times and bad.
Comments contained in the body of this report are technical opinions only and are not necessarily those of Gruneisen Growth Corp. The material herein has been obtained from sources believed to be reliable and accurate, however, its accuracy and completeness cannot be guaranteed. Our firm, employees, and customers may effect transactions, including transactions contrary to any recommendation herein, or have positions in the securities mentioned herein or options with respect thereto. Any recommendation contained in this report may not be suitable for all investors and it is not to be deemed an offer or solicitation on our part with respect to the purchase or sale of any securities. |
|
 |
Retail, Financial, Tech and Defensive Groups Rallied
Kenneth J. Gruneisen - Passed the CAN SLIM® Master's Exam
The Retail Index ($RLX +1.21%) and the financial indexes posted influential gains as the Broker/Dealer Index ($XBD +2.11%) and Bank Index ($BKX +1.15%) rose. The Networking Index ($NWX +3.15%) and Biotechnology Index ($BTK +2.29%) led the tech sector higher while the Internet Index ($IIX +1.04%) posted a smaller gain, but the Semiconductor Index ($SOX -0.14%) lagged. Energy-related shares edged higher as the Integrated Oil Index ($XOI +0.53%) and the Oil Services Index ($OSX +0.99%). Defensive groups including the Healthcare Index ($HMO +0.90%) and the Gold & Silver Index ($XAU +1.30%) rose.
Charts courtesy www.stockcharts.com
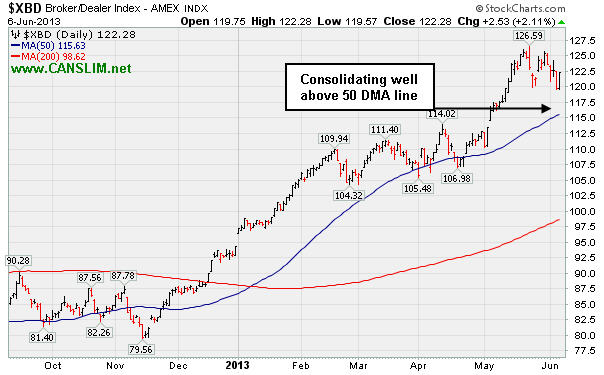
PICTURED: The Broker/Dealer Index ($XBD +2.11%) is consolidating well above its 50-day moving average line.
| Oil Services |
$OSX |
255.02 |
+2.50 |
+0.99% |
+15.83% |
| Healthcare |
$HMO |
3,029.33 |
+27.07 |
+0.90% |
+20.49% |
| Integrated Oil |
$XOI |
1,376.24 |
+7.20 |
+0.53% |
+10.82% |
| Semiconductor |
$SOX |
464.66 |
-0.63 |
-0.14% |
+20.99% |
| Networking |
$NWX |
259.97 |
+7.93 |
+3.15% |
+14.75% |
| Internet |
$IIX |
377.36 |
+3.90 |
+1.04% |
+15.40% |
| Broker/Dealer |
$XBD |
122.28 |
+2.53 |
+2.11% |
+29.63% |
| Retail |
$RLX |
781.07 |
+9.34 |
+1.21% |
+19.60% |
| Gold & Silver |
$XAU |
109.90 |
+1.41 |
+1.30% |
-33.64% |
| Bank |
$BKX |
60.64 |
+0.69 |
+1.15% |
+18.25% |
| Biotech |
$BTK |
1,915.92 |
+42.84 |
+2.29% |
+23.84% |
|
|
|
 |
Retreating Toward 10-Week Moving Average
Kenneth J. Gruneisen - Passed the CAN SLIM® Master's Exam
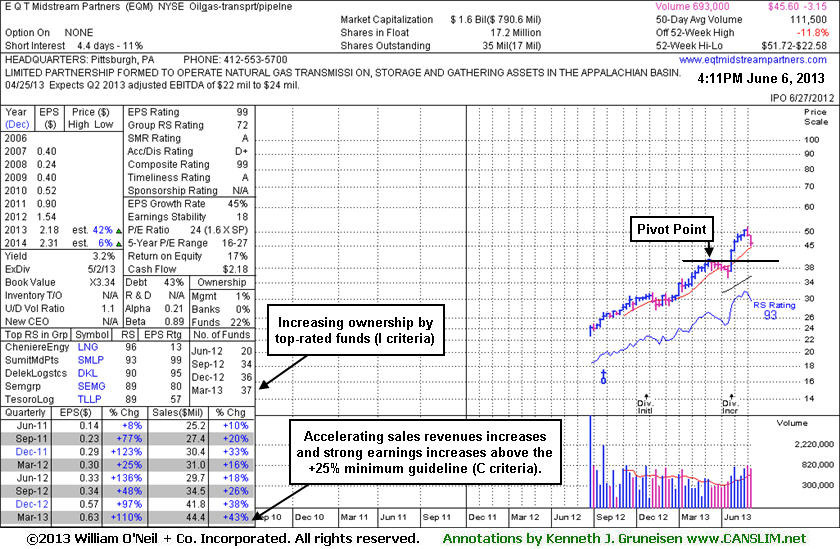
E Q T Midstream Partners (EQM +$0.16 or +0.35% to $45.60) halted its slide today after 4 consecutive losses and clear signs of distributional pressure. It has been retreating since a "negative reversal" on 5/28/13 at its 52-week high. It is still well above its 50-day moving average (DMA) line defining important near-term chart support.
The weekly chart below shows it currently in the 7th week of trading since previous technical breakout, and it is slumping back toward its 10-week moving average (WMA) line, an important chart support level to watch. A valid secondary buy point may come into play upon a successful test of support at the 10 WMA, then up to as much as +5% above the latest high. As always, disciplined investors sell if a stock falls more than -7% from their purchase price. EQM was last shown in this FSU section on 5/16/13 with an annotated graph under the headline, "Big Gains in First Few Weeks After Breakout Bode Well". Having rallied more than +20% in the first 2-3 weeks after its breakout, the investment system rules suggest holding such winners for a minimum of 8 weeks. This rule is because many of the investment system's biggest winners and best examples among the winning models were those companies that had tallied big gains shortly after their breakouts, then went on to produce dramatic gains.
This MLP in the Natural Gas business has reported strong results for the Mar '13 quarter, and quarterly earnings increases above the +25% minimum guideline (C criteria). Accelerating sales revenues increases are very reassuring, as its sales revenues increased by +18%, +26%, +38%, and +43% in the Jun, Sep, Dec '12 and Mar '13 quarters versus the year-ago periods, respectively. The number of top-rated funds owning its shares rose from 20 in Jun '12 to 37 in Mar '13, a reassuring sign concerning the I criteria. However, all bets are off if the major averages fall into an ugly correction, since 3 out of 4 stocks follow the direction of the major averages (M criteria). If there is a technical breakdown in any individual stock you do not have to wait until you are down -7% to sell it, it may be wise to sell it sooner and preserve a small gain, or walk away with an even smaller loss of just a few percentage points.
|
|
|
Color Codes Explained :
Y - Better candidates highlighted by our
staff of experts.
G - Previously featured
in past reports as yellow but may no longer be buyable under the
guidelines.
***Last / Change / Volume data in this table is the closing quote data***
Symbol/Exchange
Company Name
Industry Group |
PRICE |
CHANGE
(%Change) |
Day High |
Volume
(% DAV)
(% 50 day avg vol) |
52 Wk Hi
% From Hi |
Featured
Date |
Price
Featured |
Pivot Featured |
|
Max Buy |
AL
-
NYSE
Air Lease Corp Cl A
DIVERSIFIED SERVICES - Rental and Leasing Services
|
$27.60
|
+0.45
1.66% |
$27.61
|
404,567
71.81% of 50 DAV
50 DAV is 563,400
|
$31.00
-10.97%
|
5/9/2013
|
$30.95
|
PP = $29.38
|
|
MB = $30.85
|
Most Recent Note - 6/4/2013 12:18:58 PM
G - Consolidating near its 50 DMA line now, it completed a Secondary Offering on 5/31/13. Often times companies attract additional institutional interest (I criteria) with the help of underwriters when Secondary Offerings are completed, however they can typically be a short-term hindrance to price progress.
>>> The latest Featured Stock Update with an annotated graph appeared on 5/30/2013. Click here.
View all notes |
Alert me of new notes |
CANSLIM.net Company Profile |
SEC |
Zacks Reports |
StockTalk |
News |
Chart |
Request a new note
C
A N
S L
I M


|
AMBA
-
NASDAQ
Ambarella Inc
ELECTRONICS - Semiconductor - Specialized
|
$16.35
|
-0.30
-1.80% |
$17.20
|
1,456,914
159.75% of 50 DAV
50 DAV is 912,000
|
$17.90
-8.66%
|
5/6/2013
|
$15.31
|
PP = $16.10
|
|
MB = $16.91
|
 Most Recent Note - 6/6/2013 11:59:44 AM
Y - Pulling back today. It finished in the lower third of its intra-day range on the prior session, encountering distributional pressure after gapping up and challenging its 52-week high. Reported earnings +129% on +31% sales revenues for the April '13 quarter versus the year ago period. Its 50 DMA line ($14.58 now) defines important chart support to watch.
>>> The latest Featured Stock Update with an annotated graph appeared on 5/29/2013. Click here.
View all notes |
Alert me of new notes |
CANSLIM.net Company Profile |
SEC |
Zacks Reports |
StockTalk |
News |
Chart |
Request a new note
C
A N
S L
I M
|
EQM
-
NYSE
E Q T Midstream Partners
ENERGY - Oil and Gas Pipelines
|
$45.60
|
+0.16
0.35% |
$45.68
|
48,593
43.58% of 50 DAV
50 DAV is 111,500
|
$51.72
-11.83%
|
4/25/2013
|
$40.16
|
PP = $40.84
|
|
MB = $42.88
|
Most Recent Note - 6/6/2013 5:41:13 PM
G - Halted its slide today after encountering distributional pressure and retreating since a "negative reversal" on 5/28/13 at its 52-week high. See the latest FSU analysis for more details and a new annotated graph. Its 50 DMA line defines important near-term chart support.
>>> The latest Featured Stock Update with an annotated graph appeared on 6/6/2013. Click here.
View all notes |
Alert me of new notes |
CANSLIM.net Company Profile |
SEC |
Zacks Reports |
StockTalk |
News |
Chart |
Request a new note
C
A N
S L
I M
|
FLT
-
NYSE
Fleetcor Technologies
DIVERSIFIED SERVICES - Business/Management Services
|
$85.42
|
+1.29
1.53% |
$85.49
|
1,000,713
113.16% of 50 DAV
50 DAV is 884,300
|
$88.83
-3.84%
|
5/29/2013
|
$86.02
|
PP = $85.66
|
|
MB = $89.94
|
Most Recent Note - 5/31/2013 7:33:26 PM
Y- Was last noted in the mid-day report on 5/29/13 with a new pivot point cited based on its 5/03/13 high, and it rose from an advanced "3-weeks tight" base with a gain on the session backed by +56% above average volume. It may go on to produce more climactic gains, however this was a riskier "late-stage" base. See the latest FSU analysis for more details and a new annotated graph.
>>> The latest Featured Stock Update with an annotated graph appeared on 5/31/2013. Click here.
View all notes |
Alert me of new notes |
CANSLIM.net Company Profile |
SEC |
Zacks Reports |
StockTalk |
News |
Chart |
Request a new note
C
A N
S L
I M
|
LOPE
-
NASDAQ
Grand Canyon Education
DIVERSIFIED SERVICES - Education and; Training Services
|
$31.85
|
+0.35
1.11% |
$32.02
|
284,284
70.84% of 50 DAV
50 DAV is 401,300
|
$34.07
-6.52%
|
5/10/2013
|
$29.03
|
PP = $27.28
|
|
MB = $28.64
|
Most Recent Note - 6/3/2013 5:43:15 PM
G - Volume totals have been cooling while holding its ground stubbornly perched at its 52-week high, very extended from its previous base. Prior highs in the $27 area define support to watch on pullbacks. Gains of greater than +20% in the first 2-3 weeks following its "breakaway gap" suggest holding for a minimum of 8 week under the fact-based investment system's rules. See the latest FSU analysis for more details and a new annotated graph.
>>> The latest Featured Stock Update with an annotated graph appeared on 6/3/2013. Click here.
View all notes |
Alert me of new notes |
CANSLIM.net Company Profile |
SEC |
Zacks Reports |
StockTalk |
News |
Chart |
Request a new note
C
A N
S L
I M
|
Symbol/Exchange
Company Name
Industry Group |
PRICE |
CHANGE
(%Change) |
Day High |
Volume
(% DAV)
(% 50 day avg vol) |
52 Wk Hi
% From Hi |
Featured
Date |
Price
Featured |
Pivot Featured |
|
Max Buy |
MRLN
-
NASDAQ
Marlin Business Services
DIVERSIFIED SERVICES - Rental and Leasing Services
|
$23.32
|
+0.31
1.35% |
$23.38
|
27,732
118.01% of 50 DAV
50 DAV is 23,500
|
$25.97
-10.20%
|
3/15/2013
|
$22.29
|
PP = $23.18
|
|
MB = $24.34
|
Most Recent Note - 6/3/2013 2:02:46 PM
G - Slumping under its 50 DMA line and its color code is changed to green. The recent low ($21.49 on 5/23/13) defines important near-term support below that short-term average where a violation would raise more serious concerns.
>>> The latest Featured Stock Update with an annotated graph appeared on 5/23/2013. Click here.
View all notes |
Alert me of new notes |
CANSLIM.net Company Profile |
SEC |
Zacks Reports |
StockTalk |
News |
Chart |
Request a new note
C
A N
S L
I M
|
NSM
-
NYSE
Nationstar Mtg Hldgs Inc
FINANCIAL SERVICES - Credit Services
|
$41.55
|
+0.90
2.21% |
$41.62
|
583,943
47.19% of 50 DAV
50 DAV is 1,237,500
|
$46.91
-11.43%
|
5/7/2013
|
$39.71
|
PP = $42.34
|
|
MB = $44.46
|
Most Recent Note - 6/3/2013 4:30:52 PM
Y - Volume was below average behind today's gain following a spurt of damaging losses marked by above average volume. Weak action recently negated its prior breakout and raised concerns. Disciplined investors always limit losses if any stock falls more than -7% from their purchase price.
>>> The latest Featured Stock Update with an annotated graph appeared on 5/28/2013. Click here.
View all notes |
Alert me of new notes |
CANSLIM.net Company Profile |
SEC |
Zacks Reports |
StockTalk |
News |
Chart |
Request a new note
C
A N
S L
I M
|
PRAA
-
NASDAQ
Portfolio Recovery Assoc
DIVERSIFIED SERVICES - Business/Management Services
|
$150.16
|
+0.92
0.62% |
$150.24
|
72,241
105.00% of 50 DAV
50 DAV is 68,800
|
$153.85
-2.40%
|
5/1/2013
|
$130.77
|
PP = $127.88
|
|
MB = $134.27
|
Most Recent Note - 5/30/2013 4:55:19 PM
G - Edged higher with below average volume today for a 4th consecutive gain and its best-ever close. Very extended from prior highs in the $127 area and well above its 50 DMA line defining important chart support.
>>> The latest Featured Stock Update with an annotated graph appeared on 5/22/2013. Click here.
View all notes |
Alert me of new notes |
CANSLIM.net Company Profile |
SEC |
Zacks Reports |
StockTalk |
News |
Chart |
Request a new note
C
A N
S L
I M
|
PRLB
-
NYSE
Proto Labs Inc
MANUFACTURING - Small Tools and Accessories
|
$54.41
|
+2.89
5.61% |
$54.41
|
260,507
48.53% of 50 DAV
50 DAV is 536,800
|
$59.84
-9.07%
|
5/3/2013
|
$54.77
|
PP = $54.01
|
|
MB = $56.71
|
Most Recent Note - 6/6/2013 5:39:41 PM
Y - Up today with below average volume, rallying from support at its 50 DMA line. A subsequent violation may trigger a technical sell signal.
>>> The latest Featured Stock Update with an annotated graph appeared on 5/24/2013. Click here.
View all notes |
Alert me of new notes |
CANSLIM.net Company Profile |
SEC |
Zacks Reports |
StockTalk |
News |
Chart |
Request a new note
C
A N
S L
I M
|
RRTS
-
NYSE
Roadrunner Trans Systems
TRANSPORTATION - Air Delivery and Freight Service
|
$26.93
|
-0.20
-0.74% |
$27.15
|
80,531
38.64% of 50 DAV
50 DAV is 208,400
|
$28.24
-4.64%
|
4/3/2013
|
$22.77
|
PP = $23.75
|
|
MB = $24.94
|
Most Recent Note - 6/4/2013 6:54:11 PM
G - Volume totals have been cooling while hovering at all-time highs. Fundamental concerns were raised by its sub par earnings increase in the Mar '13 quarter, below the +25% minimum guideline (C criteria). See the latest FSU analysis for more details and a new annotated graph.
>>> The latest Featured Stock Update with an annotated graph appeared on 6/4/2013. Click here.
View all notes |
Alert me of new notes |
CANSLIM.net Company Profile |
SEC |
Zacks Reports |
StockTalk |
News |
Chart |
Request a new note
C
A N
S L
I M
|
Symbol/Exchange
Company Name
Industry Group |
PRICE |
CHANGE
(%Change) |
Day High |
Volume
(% DAV)
(% 50 day avg vol) |
52 Wk Hi
% From Hi |
Featured
Date |
Price
Featured |
Pivot Featured |
|
Max Buy |
VRX
-
NYSE
Valeant Pharmaceuticals
DRUGS - Drug Manufacturers - Other
|
$84.87
|
+0.71
0.84% |
$85.03
|
1,100,376
59.62% of 50 DAV
50 DAV is 1,845,500
|
$96.25
-11.82%
|
4/30/2013
|
$60.24
|
PP = $76.66
|
|
MB = $80.49
|
Most Recent Note - 6/4/2013 6:56:15 PM
G- Ended near the session low with a loss on average volume. It is extended from prior highs and prior reports cautioned - "Sub par earnings for the Mar '13 quarter below the +25% minimum guideline (C criteria) raised fundamental concerns."
>>> The latest Featured Stock Update with an annotated graph appeared on 5/17/2013. Click here.
View all notes |
Alert me of new notes |
CANSLIM.net Company Profile |
SEC |
Zacks Reports |
StockTalk |
News |
Chart |
Request a new note
C
A N
S L
I M
|
|
|
|
THESE ARE NOT BUY RECOMMENDATIONS!
Comments contained in the body of this report are technical
opinions only. The material herein has been obtained
from sources believed to be reliable and accurate, however,
its accuracy and completeness cannot be guaranteed.
This site is not an investment advisor, hence it does
not endorse or recommend any securities or other investments.
Any recommendation contained in this report may not
be suitable for all investors and it is not to be deemed
an offer or solicitation on our part with respect to
the purchase or sale of any securities. All trademarks,
service marks and trade names appearing in this report
are the property of their respective owners, and are
likewise used for identification purposes only.
This report is a service available
only to active Paid Premium Members.
You may opt-out of receiving report notifications
at any time. Questions or comments may be submitted
by writing to Premium Membership Services 665 S.E. 10 Street, Suite 201 Deerfield Beach, FL 33441-5634 or by calling 1-800-965-8307
or 954-785-1121.
|
|
|

