You are not logged in.
This means you
CAN ONLY VIEW reports that were published prior to Monday, April 14, 2025.
You
MUST UPGRADE YOUR MEMBERSHIP if you want to see any current reports.
AFTER MARKET UPDATE - WEDNESDAY, JUNE 6TH, 2012
Previous After Market Report Next After Market Report >>>
|
|
|
|
DOW |
+286.84 |
12,414.79 |
+2.37% |
|
Volume |
863,716,290 |
+21% |
|
Volume |
1,703,466,920 |
+10% |
|
NASDAQ |
+66.61 |
2,844.72 |
+2.40% |
|
Advancers |
2,737 |
86% |
|
Advancers |
2,091 |
79% |
|
S&P 500 |
+29.63 |
1,315.13 |
+2.30% |
|
Decliners |
377 |
12% |
|
Decliners |
447 |
17% |
|
Russell 2000 |
+19.08 |
765.17 |
+2.56% |
|
52 Wk Highs |
59 |
|
|
52 Wk Highs |
35 |
|
|
S&P 600 |
+10.35 |
429.28 |
+2.47% |
|
52 Wk Lows |
18 |
|
|
52 Wk Lows |
17 |
|
|
 |
Indices Post Gains Ahead of Window for Proper Follow-Though Day
Kenneth J. Gruneisen - Passed the CAN SLIM® Master's Exam
The major averages posted large gains on Wednesday's session. The volume totals were reported higher than the prior session totals on the Nasdaq exchange and on the NYSE. Breadth was positive as advancers led decliners by more than 7-1 on the NYSE and by more than 4-1 on the Nasdaq exchange. The total number of new 52-week highs outnumbered new 52-week lows on the NYSE and on the Nasdaq exchange both for the first time since since May 10th. There were 18 high-ranked companies from the CANSLIM.net Leaders List made new 52-week highs and appeared on the CANSLIM.net BreakOuts Page, triple the prior session total of 6 stocks. There were unanimous gains for the 15 high-ranked companies currently included on the Featured Stocks Page.
Stocks continually added to their early morning gains as investors looked to capitalize on the recent sell-off. In Europe, ECB President Mario Draghi announced that the central bank would not take further action, but was aware of the crisis and would respond if necessary. On our shores, economic data was mixed. First quarter non-farm productivity fell more than expected on an annualized basis and labor cost increased less than expected. Investors now await Thursday's speech from Fed Chairman Ben Bernanke.
All ten sectors on the S&P were higher, led financial stocks. Citigroup Inc (C +5.40%) and Bank of America Corp (BAC +7.61%) surged. The economically sensitive industrial and material sectors were also higher. Aluminum maker Alcoa Inc (AA +2.19%) was in the green and shares of Caterpillar Inc (CAT +3.60%) and Exxon Mobile Corp (XOM +3.32%) also powered their way higher amid a strong rally in energy. In other news, Barnes and Noble Inc (BKS -1.43%) fell after billionaire investor Ron Burkle sold nearly his entire stake in the company.
In bondland, Treasuries were lower along the curve. The benchmark 10-year note was off 13/16 to yield 1.66% and the 30-year bond was off over a point and a half to yield 2.74%.
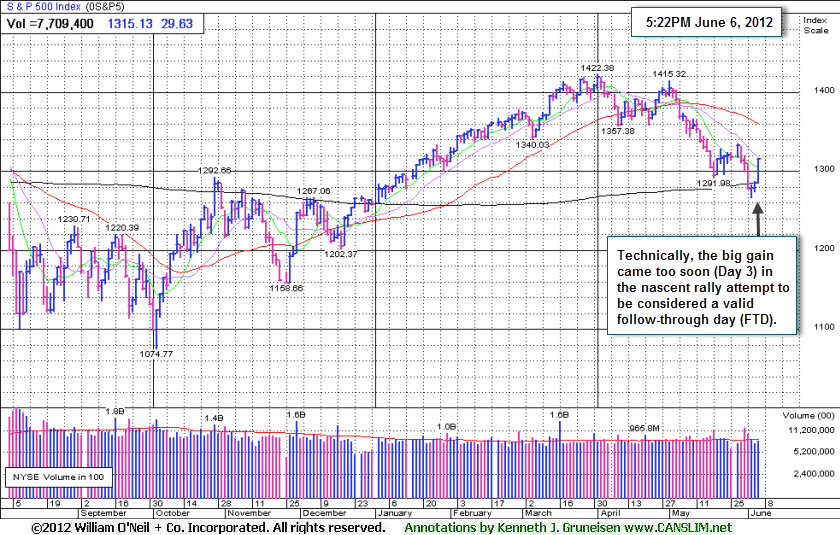
Technically, the session's big gains by the major averages were too soon (Day 3) in the nascent rally attempt to be considered a valid follow-through day (FTD). The expansion in leadership (new highs) and the major indices' rebounds above their respective 200-day moving average (DMA) lines with gains on higher volume were encouraging signs.
The major averages (M criteria) are technically still considered to be in a rally attempt within an ongoing correction, and stocks may still be vulnerable to greater downside. Historical studies suggest that the most constructive market rallies produced a solid follow-through day (FTD) between Days 4-7 of a new rally effort. Gains of +1.4% or greater by at least one of the major indexes should be backed by higher volume (preferably above average volume) coupled with an expansion in the number of stocks hitting new highs. Only fresh technical proof may give fact-based investors the clearance to begin with new buying efforts strictly in sound buy candidates. Meanwhile, investors should keep up a watchlist of worthy buy candidates while remaining protective of capital.
PICTURED: The S&P 500 Index posted a 3rd consecutive gain. Volume increased behind the gain as it and the other major indices rebounded above their respective 200-day moving average (DMA) lines.
|
 Kenneth J. Gruneisen started out as a licensed stockbroker in August 1987, a couple of months prior to the historic stock market crash that took the Dow Jones Industrial Average down -22.6% in a single day. He has published daily fact-based fundamental and technical analysis on high-ranked stocks online for two decades. Through FACTBASEDINVESTING.COM, Kenneth provides educational articles, news, market commentary, and other information regarding proven investment systems that work in good times and bad.
Comments contained in the body of this report are technical opinions only and are not necessarily those of Gruneisen Growth Corp. The material herein has been obtained from sources believed to be reliable and accurate, however, its accuracy and completeness cannot be guaranteed. Our firm, employees, and customers may effect transactions, including transactions contrary to any recommendation herein, or have positions in the securities mentioned herein or options with respect thereto. Any recommendation contained in this report may not be suitable for all investors and it is not to be deemed an offer or solicitation on our part with respect to the purchase or sale of any securities. |
|
 |
Financial, Energy, Retail, Healthcare, and Tech Indexes Rose
Kenneth J. Gruneisen - Passed the CAN SLIM® Master's Exam
The Gold & Silver Index ($XAU +0.18%) was a clear laggard on a session marked by widespread gains from all industry groups. Energy-related shares posted big gains as the Oil Services Index ($OSX +2.50%) and Integrated Oil Index ($XOI +3.47%) spurted higher. Financials shares were a positive influence on the major averages as the Bank Index ($BKX +3.00%) fought back from below its 200-day moving average (DMA) line and the Broker/Dealer Index ($XBD +3.46%) fought back from 2012 lows with a 2nd consecutive gain. The Retail Index ($RLX +2.42%) and Healthcare Index ($HMO +2.61%) traded up amid widespread gains. The tech sector was led higher by the Networking Index ($NWX +3.73%), Semiconductor Index ($SOX +3.35%), and the Internet Index ($IIX +2.78%), followed by the Biotechnology Index ($BTK +1.21%).
Charts courtesy www.stockcharts.com
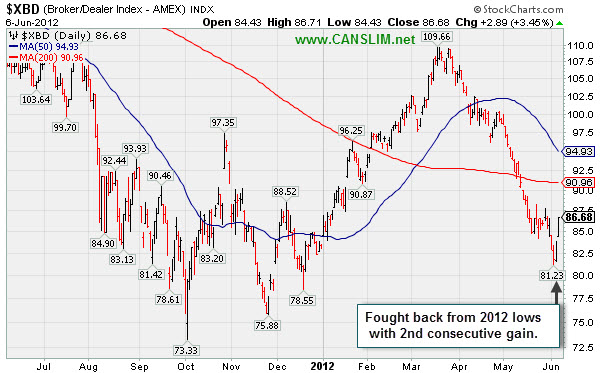
PICTURED: The Broker/Dealer Index ($XBD +3.46%) fought back from 2012 lows with a 2nd consecutive gain.
| Oil Services |
$OSX |
203.78 |
+4.97 |
+2.50% |
-5.78% |
| Healthcare |
$HMO |
2,336.80 |
+59.50 |
+2.61% |
+2.42% |
| Integrated Oil |
$XOI |
1,120.57 |
+37.62 |
+3.47% |
-8.83% |
| Semiconductor |
$SOX |
372.57 |
+12.07 |
+3.35% |
+2.23% |
| Networking |
$NWX |
210.16 |
+7.54 |
+3.72% |
-2.33% |
| Internet |
$IIX |
298.14 |
+7.99 |
+2.75% |
+5.82% |
| Broker/Dealer |
$XBD |
86.68 |
+2.89 |
+3.45% |
+4.09% |
| Retail |
$RLX |
607.30 |
+14.33 |
+2.42% |
+16.07% |
| Gold & Silver |
$XAU |
165.69 |
+0.29 |
+0.18% |
-8.28% |
| Bank |
$BKX |
42.86 |
+1.25 |
+3.00% |
+8.84% |
| Biotech |
$BTK |
1,414.81 |
+16.86 |
+1.21% |
+29.63% |
|
|
|
 |
Consolidating Just Above 50-Day Moving Average Line
Kenneth J. Gruneisen - Passed the CAN SLIM® Master's Exam
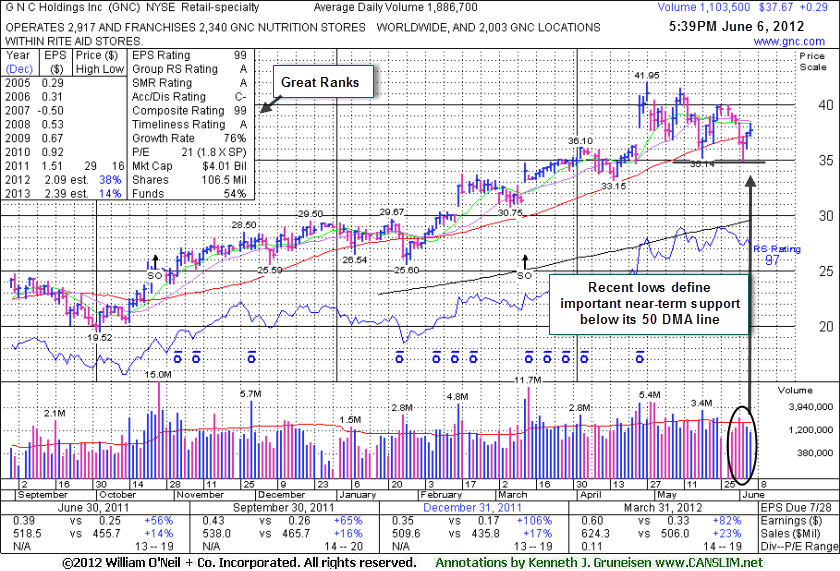
GNC Holdings Inc (GNC +$0.29 or +0.78% to $37.67) posted a small gain on lighter volume today. The prior session's gain on below average volume helped it rebound to a close above its 50-day moving average (DMA) line, helping its technical stance improve slightly following a streak of 6 consecutive losses. It could be forming a "double bottom" base, but it is in the 7th week of its consolidation from its high. That basic base pattern should be a minimum of 8-weeks in duration to be considered valid. Meanwhile, more damaging losses below recent lows could raise serious concerns.
It was last shown in the FSU section with an annotated graph on 4/26/12 under the headline, "Gap Up Followed Another Strong Earnings Report", following a considerable gap up and volume-driven gain for a new all-time high. It reported earnings +82% on +23% sales revenues for the quarter ended March 31, 2012 versus the year ago period. Volume-driven gains into new high territory, especially gaps up, were recognized as very reassuring signs of institutional accumulation.
GNC completed Secondary Offerings on 10/25/11 and 3/13/12 after making steady progress following its 4/01/11 IPO.New institutional owners are often attracted when a company has the help of underwriters in placing shares during offerings. The number of top-rated funds owning its shares rose from 147 in Jun '11 to 354 in Mar '12, a reassuring sign concerning the I criteria. Its strong quarterly earnings increases with accelerating sales growth and a great annual earnings history satisfies the C and A criteria and helped it earn stellar ranks.
|
|
|
Color Codes Explained :
Y - Better candidates highlighted by our
staff of experts.
G - Previously featured
in past reports as yellow but may no longer be buyable under the
guidelines.
***Last / Change / Volume data in this table is the closing quote data***
Symbol/Exchange
Company Name
Industry Group |
PRICE |
CHANGE
(%Change) |
Day High |
Volume
(% DAV)
(% 50 day avg vol) |
52 Wk Hi
% From Hi |
Featured
Date |
Price
Featured |
Pivot Featured |
|
Max Buy |
ALXN
-
NASDAQ
Alexion Pharmaceuticals
DRUGS - Drug Manufacturers - Other
|
$90.84
|
+1.04
1.16% |
$90.98
|
1,364,032
66.10% of 50 DAV
50 DAV is 2,063,700
|
$95.01
-4.39%
|
5/1/2012
|
$91.73
|
PP = $95.11
|
|
MB = $99.87
|
 Most Recent Note - 6/6/2012 6:18:47 PM
Y - Color code is changed to yellow after a 3rd consecutive gain today backed by light volume helped it rebound above its 50 DMA line. No new pivot point is being cited, and it faces near-term resistance in the $94-95 area.
>>> The latest Featured Stock Update with an annotated graph appeared on 5/31/2012. Click here.
View all notes |
Alert me of new notes |
CANSLIM.net Company Profile |
SEC |
Zacks Reports |
StockTalk |
News |
Chart |
Request a new note
C
A N
S L
I M


|
ASPS
-
NASDAQ
Altisource Ptf Sltns Sa
REAL ESTATE - Property Management/Developmen
|
$64.40
|
+1.90
3.04% |
$64.66
|
203,312
155.20% of 50 DAV
50 DAV is 131,000
|
$65.71
-1.99%
|
6/5/2012
|
$60.01
|
PP = $63.00
|
|
MB = $66.15
|
Most Recent Note - 6/6/2012 6:11:51 PM
Y - Today's 3rd consecutive gain backed by +55% above average volume helped it rally above the pivot point cited based on its 4/26/12 high. Technically it triggered a buy signal, however the major averages (M criteria) also need to confirm a new rally with a solid follow-through day before any new buying efforts are justified under the fact-based investment system.
>>> The latest Featured Stock Update with an annotated graph appeared on 6/5/2012. Click here.
View all notes |
Alert me of new notes |
CANSLIM.net Company Profile |
SEC |
Zacks Reports |
StockTalk |
News |
Chart |
Request a new note
C
A N
S L
I M
|
CERN
-
NASDAQ
Cerner Corp
COMPUTER SOFTWARE and SERVICES - Healthcare Information Service
|
$78.22
|
+1.49
1.94% |
$78.44
|
1,510,196
121.60% of 50 DAV
50 DAV is 1,241,900
|
$84.10
-6.99%
|
4/27/2012
|
$77.23
|
PP = $78.63
|
|
MB = $82.56
|
Most Recent Note - 6/6/2012 6:20:27 PM
Y - Color code is changed to yellow after today's 3rd consecutive gain backed by above average volume helped it rebound back above its 50 DMA line.
>>> The latest Featured Stock Update with an annotated graph appeared on 5/1/2012. Click here.
View all notes |
Alert me of new notes |
CANSLIM.net Company Profile |
SEC |
Zacks Reports |
StockTalk |
News |
Chart |
Request a new note
C
A N
S L
I M
|
CMCSA
-
NASDAQ
Comcast Corp Cl A
MEDIA - CATV Systems
|
$29.76
|
+0.73
2.50% |
$29.77
|
13,231,897
101.65% of 50 DAV
50 DAV is 13,017,400
|
$30.88
-3.63%
|
5/2/2012
|
$30.04
|
PP = $30.51
|
|
MB = $32.04
|
Most Recent Note - 6/6/2012 6:16:38 PM
Y - Today's 3rd consecutive gain helped it rally above its 50 DMA line helping its technical stance improve. Color code is changed to yellow based on its resilience while no new pivot point is being cited. The prior low ($28.09 on 5/21/12) defines important near-term support to watch where further deterioration would raise more serious concerns.
>>> The latest Featured Stock Update with an annotated graph appeared on 5/7/2012. Click here.
View all notes |
Alert me of new notes |
CANSLIM.net Company Profile |
SEC |
Zacks Reports |
StockTalk |
News |
Chart |
Request a new note
C
A N
S L
I M
|
COO
-
NYSE
Cooper Companies Inc
HEALTH SERVICES - Medical Instruments and Supplies
|
$82.15
|
+0.90
1.11% |
$82.34
|
448,285
96.03% of 50 DAV
50 DAV is 466,800
|
$89.31
-8.02%
|
3/9/2012
|
$83.05
|
PP = $81.02
|
|
MB = $85.07
|
Most Recent Note - 6/5/2012 4:49:23 PM
G - Posted a gain today on near average volume. It faces resistance due to overhead supply up through the $89 area after a streak of damaging losses with heavy volume violated its 50 DMA line and violated prior highs triggering worrisome technical sell signals.
>>> The latest Featured Stock Update with an annotated graph appeared on 5/18/2012. Click here.
View all notes |
Alert me of new notes |
CANSLIM.net Company Profile |
SEC |
Zacks Reports |
StockTalk |
News |
Chart |
Request a new note
C
A N
S L
I M
|
Symbol/Exchange
Company Name
Industry Group |
PRICE |
CHANGE
(%Change) |
Day High |
Volume
(% DAV)
(% 50 day avg vol) |
52 Wk Hi
% From Hi |
Featured
Date |
Price
Featured |
Pivot Featured |
|
Max Buy |
DG
-
NYSE
Dollar General Corp
RETAIL - Discount, Variety Stores
|
$48.70
|
+1.94
4.15% |
$48.98
|
22,697,366
751.84% of 50 DAV
50 DAV is 3,018,900
|
$49.50
-1.62%
|
5/7/2012
|
$48.51
|
PP = $47.69
|
|
MB = $50.07
|
Most Recent Note - 6/6/2012 12:15:42 PM
G - Gapped up today, rallying from its 50 DMA line again. Proposed another Secondary Offering on 6/04/12, its 4th Secondary Offering since September '11. Reported earnings +31% on +13% sales revenues for the quarter ended April 30, 2012 versus the year ago period. The broader market (M criteria) has yet to confirm a new rally, however, and without a solid follow-through day from at least one of the major averages all new buying efforts are discouraged under the fact-based investment system.
>>> The latest Featured Stock Update with an annotated graph appeared on 5/9/2012. Click here.
View all notes |
Alert me of new notes |
CANSLIM.net Company Profile |
SEC |
Zacks Reports |
StockTalk |
News |
Chart |
Request a new note
C
A N
S L
I M
|
EXPE
-
NASDAQ
Expedia Inc
INTERNET - Internet Information Providers
|
$46.69
|
+1.51
3.34% |
$46.96
|
2,392,026
50.34% of 50 DAV
50 DAV is 4,752,200
|
$46.49
0.43%
|
4/27/2012
|
$41.80
|
PP = $35.57
|
|
MB = $37.35
|
Most Recent Note - 6/6/2012 6:06:19 PM
G - Hit another new 52-week high today with a gain backed by very light volume, its 3rd consecutive gain with below average volume, getting more extended from its prior highs in the $43 area.
>>> The latest Featured Stock Update with an annotated graph appeared on 5/3/2012. Click here.
View all notes |
Alert me of new notes |
CANSLIM.net Company Profile |
SEC |
Zacks Reports |
StockTalk |
News |
Chart |
Request a new note
C
A N
S L
I M
|
GNC
-
NYSE
G N C Holdings Inc
RETAIL - Drug Stores
|
$37.67
|
+0.29
0.78% |
$38.28
|
1,106,278
58.64% of 50 DAV
50 DAV is 1,886,700
|
$41.95
-10.20%
|
1/19/2012
|
$28.99
|
PP = $29.60
|
|
MB = $31.08
|
Most Recent Note - 6/6/2012 5:59:10 PM
G - Posted a 2nd consecutive gain on below average volume after halting its slide following a 50 DMA line violation and streak of 6 consecutive losses. Recent lows define important near-term support while it could be forming a "double bottom" base. See the latest FSU analysis for more details and a new annotated graph.
>>> The latest Featured Stock Update with an annotated graph appeared on 6/6/2012. Click here.
View all notes |
Alert me of new notes |
CANSLIM.net Company Profile |
SEC |
Zacks Reports |
StockTalk |
News |
Chart |
Request a new note
C
A N
S L
I M
|
NTES
-
NASDAQ
Netease Inc Adr
INTERNET - Internet Information Providers
|
$63.08
|
+3.87
6.54% |
$63.72
|
960,225
131.45% of 50 DAV
50 DAV is 730,500
|
$63.07
0.02%
|
3/19/2012
|
$56.18
|
PP = $55.10
|
|
MB = $57.86
|
Most Recent Note - 6/6/2012 5:03:49 PM
G - Rallied with above average volume to a new 52-week high today. It had not formed a sound base pattern. Recent lows near the $55 area define important chart support to watch where a violation may trigger a worrisome technical sell signal.
>>> The latest Featured Stock Update with an annotated graph appeared on 5/24/2012. Click here.
View all notes |
Alert me of new notes |
CANSLIM.net Company Profile |
SEC |
Zacks Reports |
StockTalk |
News |
Chart |
Request a new note
C
A N
S L
I M
|
SWI
-
NYSE
Solarwinds Inc
COMPUTER SOFTWARE and SERVICES - Application Software
|
$44.21
|
+1.40
3.27% |
$44.27
|
847,272
74.19% of 50 DAV
50 DAV is 1,142,100
|
$48.64
-9.11%
|
4/26/2012
|
$45.15
|
PP = $42.32
|
|
MB = $44.44
|
Most Recent Note - 6/6/2012 6:07:53 PM
G - Posted a 2nd consecutive gain on lighter volume today after halting its 4-session slide at its 50 DMA line. A damaging violation of that short-term average and the prior session's low ($41.24) would trigger a more worrisome technical sell signal.
>>> The latest Featured Stock Update with an annotated graph appeared on 5/21/2012. Click here.
View all notes |
Alert me of new notes |
CANSLIM.net Company Profile |
SEC |
Zacks Reports |
StockTalk |
News |
Chart |
Request a new note
C
A N
S L
I M
|
Symbol/Exchange
Company Name
Industry Group |
PRICE |
CHANGE
(%Change) |
Day High |
Volume
(% DAV)
(% 50 day avg vol) |
52 Wk Hi
% From Hi |
Featured
Date |
Price
Featured |
Pivot Featured |
|
Max Buy |
SXCI
-
NASDAQ
S X C Health Solutions
COMPUTER SOFTWARE and SERVICES - Healthcare Information Service
|
$93.50
|
+3.68
4.10% |
$93.86
|
966,985
80.21% of 50 DAV
50 DAV is 1,205,600
|
$100.50
-6.97%
|
2/23/2012
|
$68.24
|
PP = $66.05
|
|
MB = $69.35
|
Most Recent Note - 6/6/2012 6:09:06 PM
G - Posted a 2nd consecutive gain today on below average volume after halting its slide at its 50 DMA line, important support for chart readers. Completed a new Public Offering on 5/10/12. It may be forming a new base, however the M criteria argues against new buying efforts without a confirmed rally with a solid FTD from at least one of the major averages.
>>> The latest Featured Stock Update with an annotated graph appeared on 5/17/2012. Click here.
View all notes |
Alert me of new notes |
CANSLIM.net Company Profile |
SEC |
Zacks Reports |
StockTalk |
News |
Chart |
Request a new note
C
A N
S L
I M
|
TDG
-
NYSE
Transdigm Group Inc
AEROSPACE/DEFENSE - Aerospace/Defense Products and; Services
|
$126.74
|
+5.93
4.91% |
$126.74
|
552,633
103.68% of 50 DAV
50 DAV is 533,000
|
$132.69
-4.48%
|
2/29/2012
|
$120.10
|
PP = $118.93
|
|
MB = $124.88
|
Most Recent Note - 6/6/2012 6:00:26 PM
G - Considerable gain today on near average volume, rallying from important support at its 50 DMA line. Its prior low ($118.43 on 5/18/12) defines the next important near-term chart support level to watch.
>>> The latest Featured Stock Update with an annotated graph appeared on 5/23/2012. Click here.
View all notes |
Alert me of new notes |
CANSLIM.net Company Profile |
SEC |
Zacks Reports |
StockTalk |
News |
Chart |
Request a new note
C
A N
S L
I M
|
UA
-
NYSE
Under Armour Inc Cl A
CONSUMER NON-DURABLES - Textile - Apparel Clothing
|
$101.35
|
+2.29
2.31% |
$101.58
|
704,834
75.66% of 50 DAV
50 DAV is 931,600
|
$102.86
-1.47%
|
2/15/2012
|
$85.77
|
PP = $84.86
|
|
MB = $89.10
|
Most Recent Note - 6/6/2012 6:02:59 PM
G - Rose near its 52-week high and best-ever close today with a 3rd consecutive gain on below average volume. No resistance remains due to overhead supply. Fundamental concerns remain after a slightly sub par earnings increase in the Dec '11 quarter.
>>> The latest Featured Stock Update with an annotated graph appeared on 5/29/2012. Click here.
View all notes |
Alert me of new notes |
CANSLIM.net Company Profile |
SEC |
Zacks Reports |
StockTalk |
News |
Chart |
Request a new note
C
A N
S L
I M
|
VSI
-
NYSE
Vitamin Shoppe Inc
SPECIALTY RETAIL - Specialty Retail, Other
|
$51.06
|
+0.70
1.39% |
$51.92
|
302,777
64.86% of 50 DAV
50 DAV is 466,800
|
$55.29
-7.65%
|
4/25/2012
|
$47.77
|
PP = $48.46
|
|
MB = $50.88
|
Most Recent Note - 6/5/2012 4:51:52 PM
G - Posted a solid gain today with near average volume, rallying after a slump near its 50 DMA line and prior highs in the $48 area defining important chart support.
>>> The latest Featured Stock Update with an annotated graph appeared on 6/4/2012. Click here.
View all notes |
Alert me of new notes |
CANSLIM.net Company Profile |
SEC |
Zacks Reports |
StockTalk |
News |
Chart |
Request a new note
C
A N
S L
I M
|
WFM
-
NASDAQ
Whole Foods Market Inc
RETAIL - Grocery Stores
|
$90.83
|
+2.44
2.76% |
$90.98
|
1,841,486
103.63% of 50 DAV
50 DAV is 1,777,000
|
$91.50
-0.73%
|
5/3/2012
|
$90.28
|
PP = $86.45
|
|
MB = $90.77
|
Most Recent Note - 6/6/2012 6:14:17 PM
Y - Today's gain on average volume led to a best-ever close near its 52-week high. Color code was changed to yellow based on recent resilience while no new pivot point was cited. The high-ranked Retail - Super/Mini Markets firm found prompt support near its 50 DMA line after damaging losses negated the latest technical breakout. Confirming gains backed by higher volume, and a FTD from at least one of the major averages would be important and reassuring signs worth watching for.
>>> The latest Featured Stock Update with an annotated graph appeared on 5/11/2012. Click here.
View all notes |
Alert me of new notes |
CANSLIM.net Company Profile |
SEC |
Zacks Reports |
StockTalk |
News |
Chart |
Request a new note
C
A N
S L
I M
|
Symbol/Exchange
Company Name
Industry Group |
PRICE |
CHANGE
(%Change) |
Day High |
Volume
(% DAV)
(% 50 day avg vol) |
52 Wk Hi
% From Hi |
Featured
Date |
Price
Featured |
Pivot Featured |
|
Max Buy |
|
|
|
THESE ARE NOT BUY RECOMMENDATIONS!
Comments contained in the body of this report are technical
opinions only. The material herein has been obtained
from sources believed to be reliable and accurate, however,
its accuracy and completeness cannot be guaranteed.
This site is not an investment advisor, hence it does
not endorse or recommend any securities or other investments.
Any recommendation contained in this report may not
be suitable for all investors and it is not to be deemed
an offer or solicitation on our part with respect to
the purchase or sale of any securities. All trademarks,
service marks and trade names appearing in this report
are the property of their respective owners, and are
likewise used for identification purposes only.
This report is a service available
only to active Paid Premium Members.
You may opt-out of receiving report notifications
at any time. Questions or comments may be submitted
by writing to Premium Membership Services 665 S.E. 10 Street, Suite 201 Deerfield Beach, FL 33441-5634 or by calling 1-800-965-8307
or 954-785-1121.
|
|
|

