You are not logged in.
This means you
CAN ONLY VIEW reports that were published prior to Monday, April 14, 2025.
You
MUST UPGRADE YOUR MEMBERSHIP if you want to see any current reports.
AFTER MARKET UPDATE - THURSDAY, JUNE 5TH, 2014
Previous After Market Report Next After Market Report >>>
|
|
|
|
DOW |
+98.58 |
16,836.11 |
+0.59% |
|
Volume |
614,603,700 |
+6% |
|
Volume |
1,792,957,560 |
+19% |
|
NASDAQ |
+44.58 |
4,296.23 |
+1.05% |
|
Advancers |
2,408 |
76% |
|
Advancers |
2,238 |
77% |
|
S&P 500 |
+12.58 |
1,940.46 |
+0.65% |
|
Decliners |
668 |
21% |
|
Decliners |
608 |
21% |
|
Russell 2000 |
+22.72 |
1,153.94 |
+2.01% |
|
52 Wk Highs |
300 |
|
|
52 Wk Highs |
117 |
|
|
S&P 600 |
+13.16 |
665.40 |
+2.02% |
|
52 Wk Lows |
19 |
|
|
52 Wk Lows |
43 |
|
|
 |
Dow and S&P 500 Index Hit New Record Highs With Higher Volume
Kenneth J. Gruneisen - Passed the CAN SLIM® Master's Exam
The Dow Jones Industrial Average rose 98 points to a new all-time of high of 16,836. The S&P 500 Index closed at a record high for the 17th time this year as it gained 12 points to 1,940. The Nasdaq Composite Index increased 44 points to 4,296. The volume was reported higher than the prior session totals on the NYSE and on the Nasdaq exchange, a sign of institutional buying demand on the rise. Advancers led decliners by more than a 3-1 margin on Nasdaq exchange and on the NYSE. Leadership expanded as there were 85 high-ranked companies from the CANSLIM.net Leaders List that made new 52-week highs and appeared on the CANSLIM.net BreakOuts Page, up from the total of 62 stocks on the prior session. New 52-week highs easily outnumbered new 52-week lows on the NYSE and Nasdaq with more new 52-week highs on the Nasdaq exchange than any session since April 2nd. There were gains for 7 of the 10 high-ranked companies currently included on the Featured Stocks Page. The S&P 500 Index and Dow Jones Industrial Average continued their surges into new high territory. The expansion in leadership (new 52-week highs) is a reassuring signal that the market direction (M criteria) is in a "confirmed uptrend". Any new buying efforts should be selective and focused in stocks meeting all key criteria of the fact-based investment system.
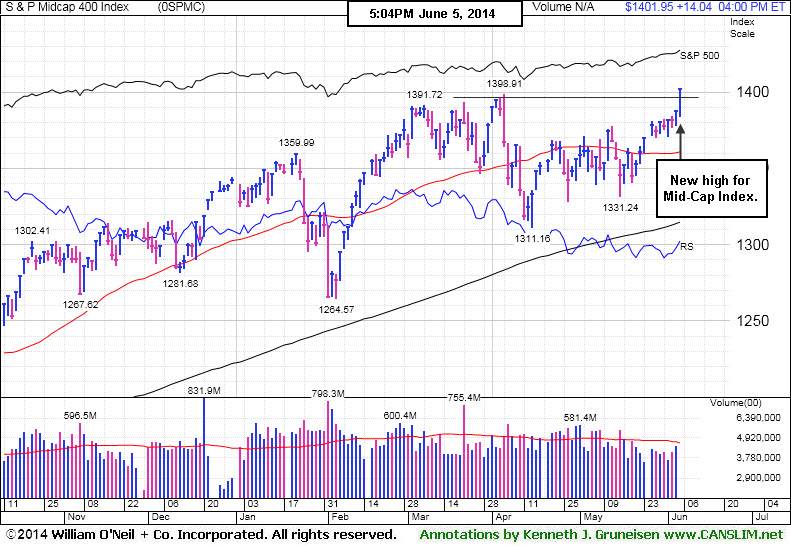
PICTURED: The Mid-Cap S&P 400 Index rallied to new all-time highs.
Accommodative monetary policy helped lift the market. The European Central Bank became the first major central bank to take interest rates below zero by cutting its deposit rate to -0.10%. The bank also lowered its main interest rate to a record low of +0.15% and announced further stimulus measures to promote growth. This helped overshadow a larger-than-anticipated rise in jobless claims as filings increased by 8,000 last week to 312,000. Now the focus turns to Friday's monthly employment update. Non-farm payrolls are expected to increase by 215,000 in May following the largest gain in more than two years.
All 10 S&P 500 sectors finished in positive territory. Industrials and financials paced the advance. Joy Global (JOY +6.7%) rose after posting a better-than-expected quarterly profit. Shares of JPMorgan (JPM +1.7%) also gained ground. Technology was also one of the best performing groups as Microsoft (MSFT +2.2%) rose.
Treasury prices rose for the first time in six sessions. The 10-year note gained 5/32 to yield 2.58%.
The CANSLIM.net Featured Stocks Page shows the most action-worthy candidates and their latest notes and a Headline Link directs members to the latest detailed analysis with data-packed graphs annotated by a Certified expert along with links to additional resources. The Premium Member Homepage includes "dynamic archives" to all prior pay reports published. Watch for an announcement via email concerning the next WEBCAST.
|
 Kenneth J. Gruneisen started out as a licensed stockbroker in August 1987, a couple of months prior to the historic stock market crash that took the Dow Jones Industrial Average down -22.6% in a single day. He has published daily fact-based fundamental and technical analysis on high-ranked stocks online for two decades. Through FACTBASEDINVESTING.COM, Kenneth provides educational articles, news, market commentary, and other information regarding proven investment systems that work in good times and bad.
Comments contained in the body of this report are technical opinions only and are not necessarily those of Gruneisen Growth Corp. The material herein has been obtained from sources believed to be reliable and accurate, however, its accuracy and completeness cannot be guaranteed. Our firm, employees, and customers may effect transactions, including transactions contrary to any recommendation herein, or have positions in the securities mentioned herein or options with respect thereto. Any recommendation contained in this report may not be suitable for all investors and it is not to be deemed an offer or solicitation on our part with respect to the purchase or sale of any securities. |
|
 |
Financial, Retail, Tech, and Commodity-Linked Groups Rose
Kenneth J. Gruneisen - Passed the CAN SLIM® Master's Exam
The Broker/Dealer Index ($XBD +0.87%) and the Bank Index ($BKX +1.02%) both posted influential gains on Thursday along with the Retail Index ($RLX +1.17%) and most other groups. The Networking Index ($NWX +2.91%) led the tech sector while the Biotechnology Index ($BTK +1.08%) and the Semiconductor Index ($SOX +0.52%) posted smaller gains. The Gold & Silver Index ($XAU +1.90%) tallied a solid gain while there were smaller gains from the energy-related groups as the Oil Services Index ($OSX +0.61%) and the Integrated Oil Index ($XOI +0.69%) edged higher.
Charts courtesy www.stockcharts.com
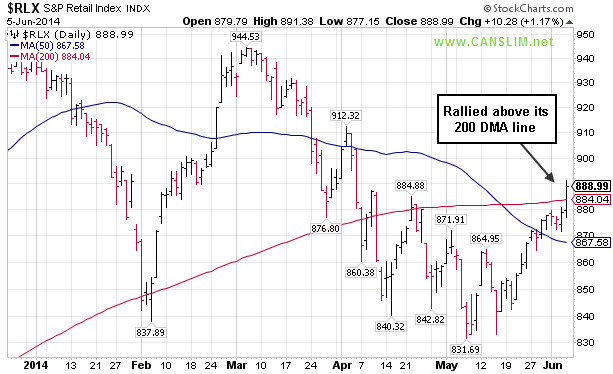
PICTURED: The Retail Index ($RLX +1.17%) rallied above its 200-day moving average (DMA) line, an encouraging improvement in its technical stance.
| Oil Services |
$OSX |
293.78 |
+1.79 |
+0.61% |
+4.54% |
| Integrated Oil |
$XOI |
1,630.29 |
+11.11 |
+0.69% |
+8.46% |
| Semiconductor |
$SOX |
614.30 |
+3.16 |
+0.52% |
+14.82% |
| Networking |
$NWX |
341.38 |
+9.64 |
+2.91% |
+5.38% |
| Broker/Dealer |
$XBD |
155.24 |
+1.34 |
+0.87% |
-3.31% |
| Retail |
$RLX |
888.99 |
+10.28 |
+1.17% |
-5.41% |
| Gold & Silver |
$XAU |
86.66 |
+1.62 |
+1.90% |
+2.98% |
| Bank |
$BKX |
70.26 |
+0.71 |
+1.02% |
+1.44% |
| Biotech |
$BTK |
2,664.20 |
+28.44 |
+1.08% |
+14.32% |
|
|
|
 |
Gain With Above Average Volume an Encouraging Sign
Kenneth J. Gruneisen - Passed the CAN SLIM® Master's Exam
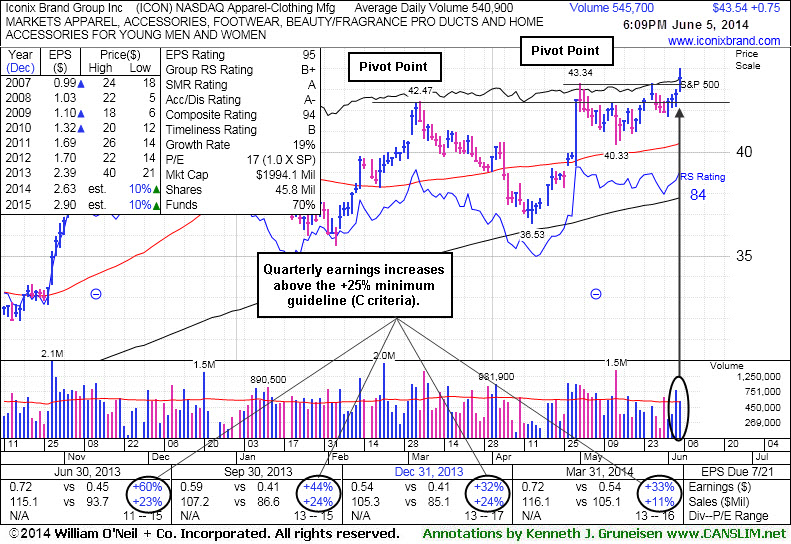
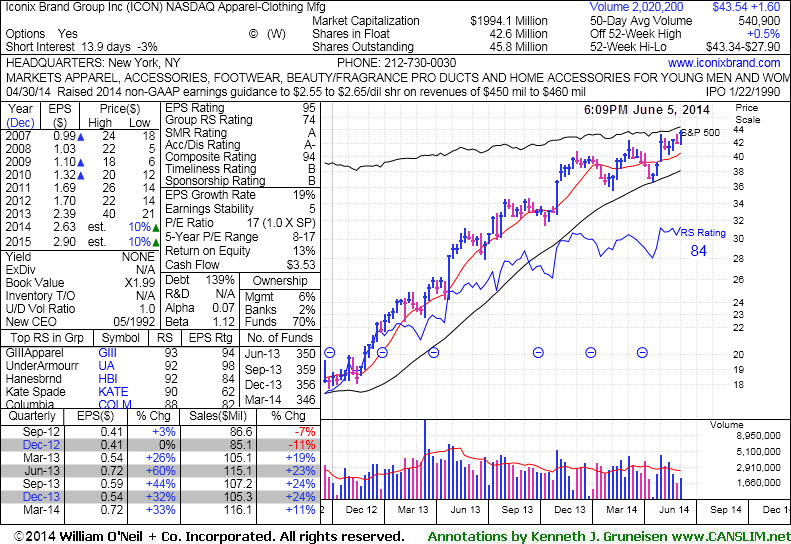
Iconix Brand Group Inc (ICON +$0.75 or +1.75% to $43.54) hit new all-time highs with today's gain on average volume. The gain on the prior session was backed by +50% above average volume as it rallied for a new high close and triggered a new (or add-on) technical buy signal. It had stalled after rallying to new highs before, and the gain marked its first volume-backed gain above its previously cited pivot point.
The stock was last shown in this FSU section on 5/20/14 with annotated graphs under the headline, "Consolidating Above 50 DMA Line Still Perched Near 52-Week High". Its 50-day moving average (DMA) line defines near-term support. A violation of that short-term average would raise concerns and trigger a technical sell signal. It reported earnings +33% on +11% sales revenues for the Mar '14 quarter, continuing its streak of earning increases above the +25% minimum guideline (C criteria).
A new pivot point has been cited based on its 5/01/14 high plus 10 cents as is has built a short "square box" base. Subsequent gains above the new pivot point with at least +40% above average volume would be a welcome reassurance it was attracting serious fresh institutional buying demand and triggering a new (or add-on) technical buy signal.
Keep in mind that 3 out of 4 stocks tend to move in the same direction of the major averages (M criteria) and the broader market is strong. Members are reminded that disciplined investors always limit losses by selling any stock that falls more than -7% from their purchase price.
Fundamentals remain strong for the high-ranked Apparel - Clothing Manufacturing firm. Its annual earnings (A criteria) history has been steady. It has earned a 95 Earnings Per Share Rating (EPS) which suggests that its recent earnings growth history has been stellar. Its Relative Strength rating is 84, above the 80+ minimum rank for buy candidates under the fact-based system. The number of top-rated funds owning its shares fell from 359 in Sep '13 to 346 in Mar '14, not a reassuring sign concerning the I criteria.
|
|
|
Color Codes Explained :
Y - Better candidates highlighted by our
staff of experts.
G - Previously featured
in past reports as yellow but may no longer be buyable under the
guidelines.
***Last / Change / Volume data in this table is the closing quote data***
Symbol/Exchange
Company Name
Industry Group |
PRICE |
CHANGE
(%Change) |
Day High |
Volume
(% DAV)
(% 50 day avg vol) |
52 Wk Hi
% From Hi |
Featured
Date |
Price
Featured |
Pivot Featured |
|
Max Buy |
AFSI
-
NASDAQ
Amtrust Financial Svcs
INSURANCE - Property and; Casualty Insurance
|
$42.01
|
-0.15
-0.36% |
$42.49
|
553,154
81.83% of 50 DAV
50 DAV is 676,000
|
$47.10
-10.81%
|
5/21/2014
|
$44.85
|
PP = $44.85
|
|
MB = $47.09
|
Most Recent Note - 6/2/2014 6:34:47 PM
G - Finished near the session high today after testing support at its 50 DMA line but tallied a 6th consecutive loss. Disciplined investors always limit losses by selling any stock that falls more than -7% from their purchase price.
>>> FEATURED STOCK ARTICLE : Finished Strong With Gain From Advanced Base Pattern - 5/21/2014
View all notes |
Set NEW NOTE alert |
CANSLIM.net Company Profile |
SEC
News |
Chart |
Request a new note
C
A N
S L
I M


|
AL
-
NYSE
Air Lease Corp Cl A
DIVERSIFIED SERVICES - Rental and Leasing Services
|
$42.38
|
+1.18
2.86% |
$42.79
|
1,455,657
181.05% of 50 DAV
50 DAV is 804,000
|
$42.12
0.62%
|
5/9/2014
|
$38.27
|
PP = $38.25
|
|
MB = $40.16
|
 Most Recent Note - 6/5/2014 12:24:20 PM
G - Hitting a new 52-week high today after stubbornly holding its ground following volume-driven gains. Prior highs near $40 define near-term support to watch on pullbacks.
>>> FEATURED STOCK ARTICLE : Finished Near Session Low and Below "Max Buy" Level After Gain on Volume - 5/28/2014
View all notes |
Set NEW NOTE alert |
CANSLIM.net Company Profile |
SEC
News |
Chart |
Request a new note
C
A N
S L
I M
|
EQM
-
NYSE
E Q T Midstream Partners
ENERGY - Oil and Gas Pipelines
|
$86.66
|
+0.67
0.78% |
$86.86
|
124,737
51.76% of 50 DAV
50 DAV is 241,000
|
$86.22
0.51%
|
12/12/2013
|
$53.17
|
PP = $56.51
|
|
MB = $59.34
|
Most Recent Note - 6/4/2014 6:08:52 PM
G - Hit yet another new 52-week high with today's 7th consecutive gain on below average volume. Fundamental concerns remain after 2 consecutive sub par quarters below the +25% minimum earnings guideline. See the latest FSU analysis for more details and new annotated graphs.
>>> FEATURED STOCK ARTICLE : New Highs Again With Light Volume Behind Streak of Gains - 6/4/2014
View all notes |
Set NEW NOTE alert |
CANSLIM.net Company Profile |
SEC
News |
Chart |
Request a new note
C
A N
S L
I M
|
GRFS
-
NASDAQ
Grifols Sa Ads
Medical-Ethical Drugs
|
$42.69
|
+0.34
0.79% |
$43.42
|
1,125,462
181.23% of 50 DAV
50 DAV is 621,000
|
$43.50
-1.86%
|
5/15/2014
|
$41.14
|
PP = $43.55
|
|
MB = $45.73
|
Most Recent Note - 6/5/2014 12:45:51 PM
Y - Found support at its 50 DMA line and it is challenging its 52-week high while on track for a 3rd consecutive volume-driven gain. Paid a Special Dividend today. A gain above its pivot point backed by at least +40% above average volume may trigger a technical buy signal.
>>> FEATURED STOCK ARTICLE : Finding Support Above 50-Day Moving Average - 6/3/2014
View all notes |
Set NEW NOTE alert |
CANSLIM.net Company Profile |
SEC
News |
Chart |
Request a new note
C
A N
S L
I M
|
ICON
-
NASDAQ
Iconix Brand Group Inc
CONSUMER NON-DURABLES - Textile - Apparel Footwear
|
$43.54
|
+0.75
1.75% |
$44.02
|
550,082
101.87% of 50 DAV
50 DAV is 540,000
|
$43.34
0.46%
|
6/5/2014
|
$43.54
|
PP = $43.44
|
|
MB = $45.61
|
Most Recent Note - 6/5/2014 6:40:25 PM
Y - Hit a new all-time high today with a gain on average volume. New pivot point is cited based on its 5/01/14 high plus 10 cents. The gain on the prior session was backed by +50% above average volume as it rallied for a new high close and triggered a new (or add-on) technical buy signal. See the latest FSU analysis for more details and new annotated graphs.
>>> FEATURED STOCK ARTICLE : Gain With Above Average Volume an Encouraging Sign - 6/5/2014
View all notes |
Set NEW NOTE alert |
CANSLIM.net Company Profile |
SEC
News |
Chart |
Request a new note
C
A N
S L
I M
|
Symbol/Exchange
Company Name
Industry Group |
PRICE |
CHANGE
(%Change) |
Day High |
Volume
(% DAV)
(% 50 day avg vol) |
52 Wk Hi
% From Hi |
Featured
Date |
Price
Featured |
Pivot Featured |
|
Max Buy |
KORS
-
NYSE
Michael Kors Hldgs Ltd
RETAIL - Apparel Stores
|
$93.36
|
-0.48
-0.51% |
$94.30
|
2,061,118
75.42% of 50 DAV
50 DAV is 2,733,000
|
$101.04
-7.60%
|
5/27/2014
|
$96.70
|
PP = $101.14
|
|
MB = $106.20
|
Most Recent Note - 6/4/2014 6:12:02 PM
Y - Relative Strength rating has improved to 83, above the 80+ minimum guideline for buy candidates. Finding support at its 50 DMA line, but deterioration below that important short-term average would raise more concerns and trigger a technical sell signal. A breakout above the pivot point with at least +40% above average volume is needed to trigger a new technical buy signal.
>>> FEATURED STOCK ARTICLE : Earnings News May Prompt Volume and Volatility - 5/27/2014
View all notes |
Set NEW NOTE alert |
CANSLIM.net Company Profile |
SEC
News |
Chart |
Request a new note
C
A N
S L
I M
|
PANW
-
NYSE
Palo Alto Networks
Computer Sftwr-Security
|
$77.00
|
+1.66
2.20% |
$78.65
|
2,916,673
145.91% of 50 DAV
50 DAV is 1,999,000
|
$80.84
-4.75%
|
5/29/2014
|
$75.95
|
PP = $72.50
|
|
MB = $76.13
|
Most Recent Note - 6/5/2014 1:05:00 PM
G - Color code is changed to green after rallying above its "max buy" level with today's gain. Little overhead supply remains up through the $80 level. Prior highs near $72 define important support above its 50 DMA line.
>>> FEATURED STOCK ARTICLE : Finish Near Session Low Following Gap Up From Double Bottom Base - 5/29/2014
View all notes |
Set NEW NOTE alert |
CANSLIM.net Company Profile |
SEC
News |
Chart |
Request a new note
C
A N
S L
I M
|
SN
-
NYSE
Sanchez Energy Corp
ENERGY - Independent Oil and Gas
|
$34.40
|
+0.46
1.36% |
$34.74
|
1,282,367
106.51% of 50 DAV
50 DAV is 1,204,000
|
$35.50
-3.10%
|
5/22/2014
|
$33.00
|
PP = $31.59
|
|
MB = $33.17
|
Most Recent Note - 6/3/2014 12:50:58 PM
G - Pulling back further today following a "negative reversal" on the prior session after touching a new 52-week high. Prior highs near $31-32 define initial support to watch on pullbacks.
>>> FEATURED STOCK ARTICLE : Finish Near Low a Sign of Distributional Pressure Following Gap Up and New High - 5/22/2014
View all notes |
Set NEW NOTE alert |
CANSLIM.net Company Profile |
SEC
News |
Chart |
Request a new note
C
A N
S L
I M
|
TRN
-
NYSE
Trinity Industries Inc
TRANSPORTATION - Railroads
|
$80.23
|
-0.03
-0.04% |
$81.45
|
2,449,572
166.07% of 50 DAV
50 DAV is 1,475,000
|
$87.89
-8.71%
|
4/30/2014
|
$75.57
|
PP = $76.05
|
|
MB = $79.85
|
Most Recent Note - 6/5/2014 12:58:47 PM
G - Trading near its "max buy" level with above average volume behind today's 5th consecutive loss. Traded up as much as +15.57% since first highlighted in yellow in the 4/30/14 mid-day report. Prior highs in the $75-76 area coincide with its 50 DMA line ($76.25) defining important support to watch.
>>> FEATURED STOCK ARTICLE : Extended From Prior Base After +15% Rally in One Month - 6/2/2014
View all notes |
Set NEW NOTE alert |
CANSLIM.net Company Profile |
SEC
News |
Chart |
Request a new note
C
A N
S L
I M
|
WLK
-
NYSE
Westlake Chemical Corp
CHEMICALS - Specialty Chemicals
|
$81.24
|
+0.04
0.05% |
$81.90
|
553,457
72.54% of 50 DAV
50 DAV is 763,000
|
$81.92
-0.83%
|
4/29/2014
|
$72.79
|
PP = $69.31
|
|
MB = $72.78
|
Most Recent Note - 6/4/2014 6:10:34 PM
G - Hit a new 52-week high with today's volume-driven gain. Recent lows near $73 define important near-term support to watch on pullbacks.
>>> FEATURED STOCK ARTICLE : Extended From Prior Base After 5 Weekly Gains - 5/30/2014
View all notes |
Set NEW NOTE alert |
CANSLIM.net Company Profile |
SEC
News |
Chart |
Request a new note
C
A N
S L
I M
|
Symbol/Exchange
Company Name
Industry Group |
PRICE |
CHANGE
(%Change) |
Day High |
Volume
(% DAV)
(% 50 day avg vol) |
52 Wk Hi
% From Hi |
Featured
Date |
Price
Featured |
Pivot Featured |
|
Max Buy |
|
|
|
THESE ARE NOT BUY RECOMMENDATIONS!
Comments contained in the body of this report are technical
opinions only. The material herein has been obtained
from sources believed to be reliable and accurate, however,
its accuracy and completeness cannot be guaranteed.
This site is not an investment advisor, hence it does
not endorse or recommend any securities or other investments.
Any recommendation contained in this report may not
be suitable for all investors and it is not to be deemed
an offer or solicitation on our part with respect to
the purchase or sale of any securities. All trademarks,
service marks and trade names appearing in this report
are the property of their respective owners, and are
likewise used for identification purposes only.
This report is a service available
only to active Paid Premium Members.
You may opt-out of receiving report notifications
at any time. Questions or comments may be submitted
by writing to Premium Membership Services 665 S.E. 10 Street, Suite 201 Deerfield Beach, FL 33441-5634 or by calling 1-800-965-8307
or 954-785-1121.
|
|
|

