You are not logged in.
This means you
CAN ONLY VIEW reports that were published prior to Monday, April 14, 2025.
You
MUST UPGRADE YOUR MEMBERSHIP if you want to see any current reports.
AFTER MARKET UPDATE - TUESDAY, JUNE 5TH, 2012
Previous After Market Report Next After Market Report >>>
|
|
|
|
DOW |
+26.49 |
12,127.95 |
+0.22% |
|
Volume |
711,570,720 |
-14% |
|
Volume |
1,550,749,650 |
-9% |
|
NASDAQ |
+18.10 |
2,778.11 |
+0.66% |
|
Advancers |
2,231 |
72% |
|
Advancers |
1,646 |
63% |
|
S&P 500 |
+7.32 |
1,285.50 |
+0.57% |
|
Decliners |
790 |
25% |
|
Decliners |
848 |
33% |
|
Russell 2000 |
+8.85 |
746.09 |
+1.20% |
|
52 Wk Highs |
34 |
|
|
52 Wk Highs |
20 |
|
|
S&P 600 |
+4.06 |
418.93 |
+0.98% |
|
52 Wk Lows |
51 |
|
|
52 Wk Lows |
65 |
|
|
 |
Indices' Gains Backed By Lighter Volume
Kenneth J. Gruneisen - Passed the CAN SLIM® Master's Exam
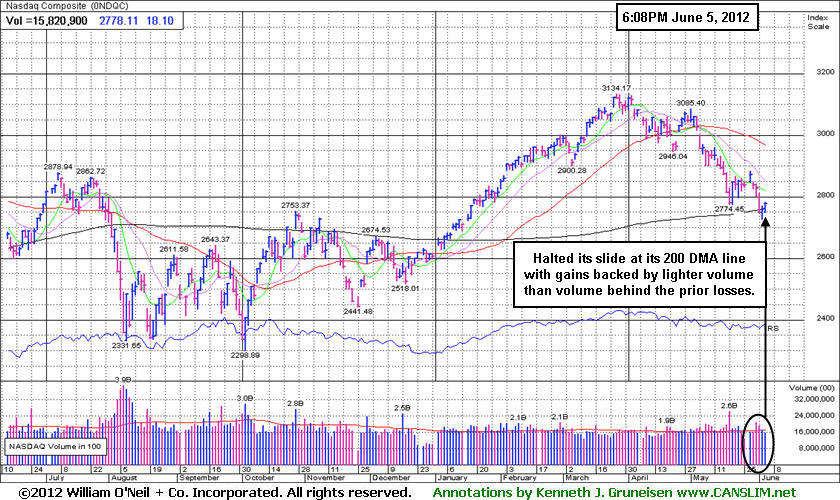
All three of the major averages posted gains on Tuesday's session. The volume totals were reported lighter than the prior session totals on the Nasdaq exchange and on the NYSE. Breadth was positive as advancers led decliners by nearly 3-1 on the NYSE and nearly 2-1 on the Nasdaq exchange. The total number of new 52-week lows still outnumbered new 52-week highs on the NYSE and on the Nasdaq exchange. There were 6 high-ranked companies from the CANSLIM.net Leaders List made new 52-week highs and appeared on the CANSLIM.net BreakOuts Page, up from the prior session total of 3 stocks. There were gains for 12 of the 16 high-ranked companies currently included on the Featured Stocks Page.
The major averages finished higher on "Day 2" of another rally attempt as positive U.S. economic data muted concerns surrounding Europe. ISM non-manufacturing data for May modestly beat expectations with the index rising to 53.7. Consensus expectations were for the index to hold firm at 53.5. G7 finance ministers did hold an emergency conference call to discuss Europe's worsening debt crisis, but no resolve was made.
JP Morgan Chase & Co (JPM +3.19%) Citigroup Inc (C +2.90%) and Bank of America Corp (BAC +3.75%) rose while financial stocks were among the session's top performers. On the earnings front, Dollar General Corp (DG -3.57%) pulled back for a 3rd consecutive loss with above average volume after reporting their quarterly earnings. Consumer stocks were among the worst performers as Target Corp (TGT -0.43%) and Wal-Mart Stores Inc (WMT -0.74%) fell. Also in the consumer space, shares of Starbucks (SBUX -2.76%) fell after the company announced they would acquire Bay Bread for $100 million in cash. In other news, shares of Google Inc (GOOG -1.41%) pulled back after Apple Inc (AAPL -0.26%) announced they would discontinue the use of Google Maps on their iPhones.
Turning to bondland, Treasuries were lower along the curve with the benchmark 10-year note off 11 ticks to yield 1.57% and the 30-year bond fell over a point to yield 2.64%.
The major averages (M criteria) are technically considered to be in a "correction" and stocks remain vulnerable to much greater downside, a point repeatedly included in bold in this commentary! Historical studies suggest that the most constructive market rallies produced a solid follow-through day (FTD) between Days 4-7 of a new rally effort. Gains of +1.4% or greater by at least one of the major indexes should be backed by higher volume (preferably above average volume) coupled with an expansion in the number of stocks hitting new highs. Only fresh technical proof may give fact-based investors the clearance to begin with new buying efforts strictly in sound buy candidates. Meanwhile, investors should keep up a watchlist of worthy buy candidates while remaining protective of capital.
PICTURED: The Nasdaq Composite Index posted a 2nd consecutive gain with lighter volume after halting its slide at its 200-day moving average (DMA) line. Its gains have come on lighter volume than the volume behind the prior losses. Volume always must increase behind a FTD to signal increasing institutional accumulation after a market correction.
|
 Kenneth J. Gruneisen started out as a licensed stockbroker in August 1987, a couple of months prior to the historic stock market crash that took the Dow Jones Industrial Average down -22.6% in a single day. He has published daily fact-based fundamental and technical analysis on high-ranked stocks online for two decades. Through FACTBASEDINVESTING.COM, Kenneth provides educational articles, news, market commentary, and other information regarding proven investment systems that work in good times and bad.
Comments contained in the body of this report are technical opinions only and are not necessarily those of Gruneisen Growth Corp. The material herein has been obtained from sources believed to be reliable and accurate, however, its accuracy and completeness cannot be guaranteed. Our firm, employees, and customers may effect transactions, including transactions contrary to any recommendation herein, or have positions in the securities mentioned herein or options with respect thereto. Any recommendation contained in this report may not be suitable for all investors and it is not to be deemed an offer or solicitation on our part with respect to the purchase or sale of any securities. |
|
 |
Financial Groups Try Making A Stand; Retail Group Lags
Kenneth J. Gruneisen - Passed the CAN SLIM® Master's Exam
The Broker/Dealer Index ($XBD +2.33%) and the Bank Index ($BKX +1.49%) tallied gains on Tuesday amid broad-based gains. The tech sector saw unanimous gains from the Semiconductor Index ($SOX +2.21%), Networking Index ($NWX +1.82%), Biotechnology Index ($BTK +1.30%), and the Internet Index ($IIX +0.93%) which helped the small-cap indexes and helped Nasdaq Composite Index outpace its peers. The Healthcare Index ($HMO +2.18%) posted a solid gain, and strength in energy-related shares boosted the Oil Services Index ($OSX +1.62%) and the Integrated Oil Index ($XOI +0.83%). The Gold & Silver Index ($XAU +0.46%) also edged higher. The Retail Index ($RLX -0.04%) stood out as a laggard by finishing flat on the widely positive session.
Charts courtesy www.stockcharts.com
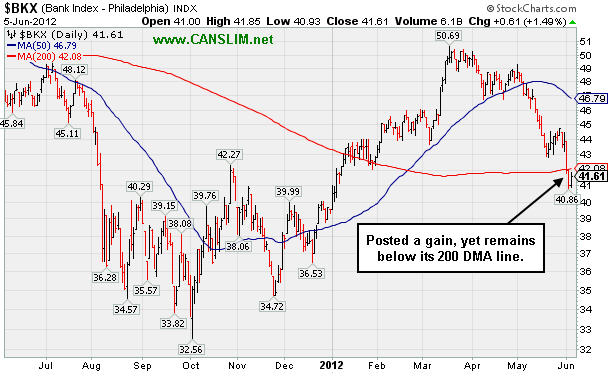
PICTURED: The Bank Index ($BKX +1.49%) posted a gain, yet remains below its 200-day moving average (DMA) line. Damaging losses over the course of 2 months have erased most of the impressive Q1 gains. Poor action from this group, viewed as a "leading indicator", does not bode well for the broader market outlook. It will be important for financial stocks to make a stand, meanwhile the major averages remain vulnerable to further technical damage.
| Oil Services |
$OSX |
198.81 |
+3.17 |
+1.62% |
-8.08% |
| Healthcare |
$HMO |
2,277.30 |
+48.67 |
+2.18% |
-0.19% |
| Integrated Oil |
$XOI |
1,082.94 |
+8.95 |
+0.83% |
-11.89% |
| Semiconductor |
$SOX |
360.50 |
+7.81 |
+2.21% |
-1.08% |
| Networking |
$NWX |
202.61 |
+3.61 |
+1.82% |
-5.83% |
| Internet |
$IIX |
290.15 |
+2.68 |
+0.93% |
+2.98% |
| Broker/Dealer |
$XBD |
83.79 |
+1.91 |
+2.33% |
+0.62% |
| Retail |
$RLX |
592.97 |
-0.25 |
-0.04% |
+13.34% |
| Gold & Silver |
$XAU |
165.40 |
+0.75 |
+0.46% |
-8.44% |
| Bank |
$BKX |
41.61 |
+0.61 |
+1.49% |
+5.66% |
| Biotech |
$BTK |
1,397.95 |
+17.93 |
+1.30% |
+28.08% |
|
|
|
 |
Additional Confirmations Needed For High-Ranked Leader
Kenneth J. Gruneisen - Passed the CAN SLIM® Master's Exam
Often, when a leading stock is setting up to breakout of a solid base it is highlighted in CANSLIM.net's Mid-Day Breakouts Report. The most relevant factors are noted in the report which alerts prudent CANSLIM oriented investors to place the issue in their watch list. After doing any necessary backup research, the investor is prepared to act after the stock triggers a technical buy signal (breaks above its pivot point on more than +50% average turnover) but before it gets too extended from a sound base. In the event the stock fails to trigger a technical buy signal and its price declines then it will simply be removed from the watch list. Disciplined investors know to buy as near as possible to the pivot point and avoid chasing stocks after they have rallied more than +5% above their pivot point. It is crucial to always limit losses whenever any stock heads the wrong direction, and disciplined investors sell if a struggling stock ever falls more than -7% from their purchase price.
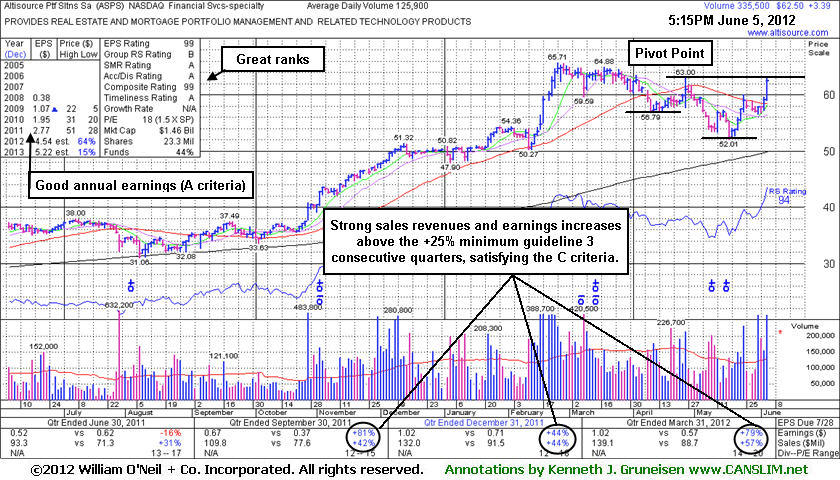
Altisource Portfolio Solutions Sa (ASPS +$3.39 or +5.74% to $62.50) was highlighted in yellow again today in the mid-day report (read here). Its recent rebound from below its 50-day moving average (DMA) line helped its technical stance improve. Today's considerable gain was backed by more than 2 times average volume as it approached its pivot point. The pivot point cited is based upon its 4/26/12 high while it is currently working on a "double bottom" base 15-weeks in length. Subsequent volume-driven gains above the pivot point are needed to trigger a technical buy signal. Disciplined investors always watch for definitive proof of heavy institutional buying demand before taking any action. Many prior examples have proven the disadvantages of getting in "early", before a proper buy signal occurs. Keep in mind also that the major averages (M criteria) also need to confirm a new rally with a solid follow-through day before any new buying efforts are justified under the fact-based investment system.
Earnings increases have been above the +25% guideline, satisfying the C criteria, and backed by solid sales revenues increases in the 3 latest quarterly comparisons through Mar '12. This Luxembourg-based Financial Services firm's small supply (S criteria) of only 15.4 million shares in the public float can contribute to greater volatility in the event of institutional buying or selling. The number of top-rated funds owning its shares rose from 100 in Jun '11 to 154 in Mar '12., a reassuring sign concerning the I criteria.
 |
|
|
Color Codes Explained :
Y - Better candidates highlighted by our
staff of experts.
G - Previously featured
in past reports as yellow but may no longer be buyable under the
guidelines.
***Last / Change / Volume data in this table is the closing quote data***
Symbol/Exchange
Company Name
Industry Group |
PRICE |
CHANGE
(%Change) |
Day High |
Volume
(% DAV)
(% 50 day avg vol) |
52 Wk Hi
% From Hi |
Featured
Date |
Price
Featured |
Pivot Featured |
|
Max Buy |
ALXN
-
NASDAQ
Alexion Pharmaceuticals
DRUGS - Drug Manufacturers - Other
|
$89.80
|
+1.41
1.60% |
$89.96
|
1,212,321
58.93% of 50 DAV
50 DAV is 2,057,200
|
$95.01
-5.48%
|
5/1/2012
|
$91.73
|
PP = $95.11
|
|
MB = $99.87
|
Most Recent Note - 6/1/2012 7:12:59 PM
G - Color code is changed to green after a 5th consecutive loss led to a close below its 50 DMA line. Faces some resistance in the $94-95 area.
>>> The latest Featured Stock Update with an annotated graph appeared on 5/31/2012. Click here.
View all notes |
Alert me of new notes |
CANSLIM.net Company Profile |
SEC |
Zacks Reports |
StockTalk |
News |
Chart |
Request a new note
C
A N
S L
I M


|
ARBA
-
NASDAQ
Territorial Bancorp Inc
INTERNET - Internet Software and Services
|
$44.53
|
-0.07
-0.16% |
$44.60
|
10,101,793
34,833.77% of 50 DAV
50 DAV is 29,000
|
$45.48
-2.09%
|
4/27/2012
|
$38.53
|
PP = $37.24
|
|
MB = $39.10
|
 Most Recent Note - 6/5/2012 5:15:53 PM
Holding its ground near its 52-week high since a considerable gain on 5/22/12 with heavy volume on news it will be bought by SAP in a $4.3 billion deal. It will be dropped from the Featured Stocks list tonight.
>>> The latest Featured Stock Update with an annotated graph appeared on 4/30/2012. Click here.
View all notes |
Alert me of new notes |
CANSLIM.net Company Profile |
SEC |
Zacks Reports |
StockTalk |
News |
Chart |
Request a new note
C
A N
S L
I M
|
ASPS
-
NASDAQ
Altisource Ptf Sltns Sa
REAL ESTATE - Property Management/Developmen
|
$62.50
|
+3.39
5.74% |
$63.10
|
335,516
266.49% of 50 DAV
50 DAV is 125,900
|
$65.71
-4.89%
|
6/5/2012
|
$60.01
|
PP = $63.00
|
|
MB = $66.15
|
Most Recent Note - 6/5/2012 6:34:21 PM
Y - Rallying from below its 50 DMA line this week, helping its technical stance improve. Featured in yellow in the earlier mid-day report with new pivot point cited based on its 4/26/12 high. Subsequent volume-driven gains above the pivot point are needed to trigger a technical buy signal. The major averages (M criteria) also need to confirm a new rally with a solid follow-through day before any new buying efforts are justified under the fact-based investment system. See the latest FSU analysis for more details and a new annotated graph.
>>> The latest Featured Stock Update with an annotated graph appeared on 6/5/2012. Click here.
View all notes |
Alert me of new notes |
CANSLIM.net Company Profile |
SEC |
Zacks Reports |
StockTalk |
News |
Chart |
Request a new note
C
A N
S L
I M
|
CERN
-
NASDAQ
Cerner Corp
COMPUTER SOFTWARE and SERVICES - Healthcare Information Service
|
$76.73
|
+0.26
0.34% |
$77.07
|
761,797
61.28% of 50 DAV
50 DAV is 1,243,100
|
$84.10
-8.76%
|
4/27/2012
|
$77.23
|
PP = $78.63
|
|
MB = $82.56
|
Most Recent Note - 6/1/2012 7:09:29 PM
G - Color code is changed to green after a gap down today and violation of its 50 DMA line and prior lows with a 2nd consecutive loss on above average volume.
>>> The latest Featured Stock Update with an annotated graph appeared on 5/1/2012. Click here.
View all notes |
Alert me of new notes |
CANSLIM.net Company Profile |
SEC |
Zacks Reports |
StockTalk |
News |
Chart |
Request a new note
C
A N
S L
I M
|
CMCSA
-
NASDAQ
Comcast Corp Cl A
MEDIA - CATV Systems
|
$29.03
|
+0.08
0.28% |
$29.10
|
13,755,796
106.55% of 50 DAV
50 DAV is 12,910,000
|
$30.88
-5.98%
|
5/2/2012
|
$30.04
|
PP = $30.51
|
|
MB = $32.04
|
Most Recent Note - 6/4/2012 12:10:41 PM
G - Still sputtering below its 50 DMA line which is now downward sloping. The prior low ($28.09 on 5/21/12) defines important near-term support to watch where further deterioration would raise more serious concerns.
>>> The latest Featured Stock Update with an annotated graph appeared on 5/7/2012. Click here.
View all notes |
Alert me of new notes |
CANSLIM.net Company Profile |
SEC |
Zacks Reports |
StockTalk |
News |
Chart |
Request a new note
C
A N
S L
I M
|
Symbol/Exchange
Company Name
Industry Group |
PRICE |
CHANGE
(%Change) |
Day High |
Volume
(% DAV)
(% 50 day avg vol) |
52 Wk Hi
% From Hi |
Featured
Date |
Price
Featured |
Pivot Featured |
|
Max Buy |
COO
-
NYSE
Cooper Companies Inc
HEALTH SERVICES - Medical Instruments and Supplies
|
$81.25
|
+1.95
2.46% |
$81.54
|
562,890
122.55% of 50 DAV
50 DAV is 459,300
|
$89.31
-9.02%
|
3/9/2012
|
$83.05
|
PP = $81.02
|
|
MB = $85.07
|
Most Recent Note - 6/5/2012 4:49:23 PM
G - Posted a gain today on near average volume. It faces resistance due to overhead supply up through the $89 area after a streak of damaging losses with heavy volume violated its 50 DMA line and violated prior highs triggering worrisome technical sell signals.
>>> The latest Featured Stock Update with an annotated graph appeared on 5/18/2012. Click here.
View all notes |
Alert me of new notes |
CANSLIM.net Company Profile |
SEC |
Zacks Reports |
StockTalk |
News |
Chart |
Request a new note
C
A N
S L
I M
|
DG
-
NYSE
Dollar General Corp
RETAIL - Discount, Variety Stores
|
$46.76
|
-1.73
-3.57% |
$47.58
|
8,515,889
293.61% of 50 DAV
50 DAV is 2,900,400
|
$49.50
-5.54%
|
5/7/2012
|
$48.51
|
PP = $47.69
|
|
MB = $50.07
|
Most Recent Note - 6/5/2012 4:44:17 PM
G - Gapped down today, retreating from all-time highs with a 3rd consecutive loss backed by above average volume and it closed just below its 50 DMA line again. Color code is changed to green based on damaging distributional action. Reported earnings +31% on +13% sales revenues for the quarter ended April 30, 2012 versus the year ago period. The broader market (M criteria) has yet to confirm a new rally, however, and without a solid follow-through day from at least one of the major averages all new buying efforts are discouraged under the fact-based investment system.
>>> The latest Featured Stock Update with an annotated graph appeared on 5/9/2012. Click here.
View all notes |
Alert me of new notes |
CANSLIM.net Company Profile |
SEC |
Zacks Reports |
StockTalk |
News |
Chart |
Request a new note
C
A N
S L
I M
|
EXPE
-
NASDAQ
Expedia Inc
INTERNET - Internet Information Providers
|
$45.18
|
+0.25
0.56% |
$45.42
|
2,754,632
58.21% of 50 DAV
50 DAV is 4,732,000
|
$46.49
-2.82%
|
4/27/2012
|
$41.80
|
PP = $35.57
|
|
MB = $37.35
|
Most Recent Note - 6/1/2012 2:04:26 PM
G - Pulling back from its 52-week high today after a spurt of 3 consecutive gains. As previously noted, heavy volume behind a considerable gain on 5/23/12 technically helped it break out from an advanced "3-weeks tight" base with no resistance remaining due to overhead supply, however no new pivot point was cited. Until the market confirms a new rally with a solid follow through day from at least one of the major averages (M criteria) the fact-based investment system argues against new buying efforts in any stocks.
>>> The latest Featured Stock Update with an annotated graph appeared on 5/3/2012. Click here.
View all notes |
Alert me of new notes |
CANSLIM.net Company Profile |
SEC |
Zacks Reports |
StockTalk |
News |
Chart |
Request a new note
C
A N
S L
I M
|
GNC
-
NYSE
G N C Holdings Inc
RETAIL - Drug Stores
|
$37.38
|
+0.88
2.41% |
$37.47
|
1,471,352
78.02% of 50 DAV
50 DAV is 1,885,800
|
$41.95
-10.89%
|
1/19/2012
|
$28.99
|
PP = $29.60
|
|
MB = $31.08
|
Most Recent Note - 6/5/2012 5:06:05 PM
G - More damaging losses below recent lows would raise serious concerns. Today's gain on below average volume helped it rebound to a close above its 50 DMA line, helping its technical stance improve following a streak of 6 consecutive losses. It could be forming a "double bottom" base, but it is in the 7th week of its consolidation from its high. That basic base pattern should be a minimum of 8-weeks in duration to be considered valid.
>>> The latest Featured Stock Update with an annotated graph appeared on 4/26/2012. Click here.
View all notes |
Alert me of new notes |
CANSLIM.net Company Profile |
SEC |
Zacks Reports |
StockTalk |
News |
Chart |
Request a new note
C
A N
S L
I M
|
NTES
-
NASDAQ
Netease Inc Adr
INTERNET - Internet Information Providers
|
$59.21
|
+0.00
0.00% |
$59.37
|
369,116
50.11% of 50 DAV
50 DAV is 736,600
|
$63.07
-6.12%
|
3/19/2012
|
$56.18
|
PP = $55.10
|
|
MB = $57.86
|
Most Recent Note - 6/5/2012 5:09:26 PM
G - Dipped under its 50 DMA line today yet finished near the intra-day high, unchanged, with very light volume. It has not formed a sound base pattern. Recent lows near the $55 area define important chart support to watch where a violation may trigger a worrisome technical sell signal.
>>> The latest Featured Stock Update with an annotated graph appeared on 5/24/2012. Click here.
View all notes |
Alert me of new notes |
CANSLIM.net Company Profile |
SEC |
Zacks Reports |
StockTalk |
News |
Chart |
Request a new note
C
A N
S L
I M
|
Symbol/Exchange
Company Name
Industry Group |
PRICE |
CHANGE
(%Change) |
Day High |
Volume
(% DAV)
(% 50 day avg vol) |
52 Wk Hi
% From Hi |
Featured
Date |
Price
Featured |
Pivot Featured |
|
Max Buy |
SWI
-
NYSE
Solarwinds Inc
COMPUTER SOFTWARE and SERVICES - Application Software
|
$42.81
|
+0.25
0.59% |
$43.10
|
975,159
85.39% of 50 DAV
50 DAV is 1,142,000
|
$48.64
-11.99%
|
4/26/2012
|
$45.15
|
PP = $42.32
|
|
MB = $44.44
|
Most Recent Note - 6/5/2012 5:12:00 PM
G - Small gain on light volume today halted its 4-session slide at its 50 DMA line. A damaging violation of that short-term average and the prior session's low ($41.24) would trigger a more worrisome technical sell signal.
>>> The latest Featured Stock Update with an annotated graph appeared on 5/21/2012. Click here.
View all notes |
Alert me of new notes |
CANSLIM.net Company Profile |
SEC |
Zacks Reports |
StockTalk |
News |
Chart |
Request a new note
C
A N
S L
I M
|
SXCI
-
NASDAQ
S X C Health Solutions
COMPUTER SOFTWARE and SERVICES - Healthcare Information Service
|
$89.82
|
+1.94
2.21% |
$89.91
|
622,116
52.04% of 50 DAV
50 DAV is 1,195,400
|
$100.50
-10.63%
|
2/23/2012
|
$68.24
|
PP = $66.05
|
|
MB = $69.35
|
Most Recent Note - 6/5/2012 5:15:07 PM
G - Gain today on light volume halted its slide at its 50 DMA line, important support for chart readers. Completed a new Public Offering on 5/10/12. It may be forming a new base, however the M criteria argues against new buying efforts without a confirmed rally with a solid FTD from at least one of the major averages.
>>> The latest Featured Stock Update with an annotated graph appeared on 5/17/2012. Click here.
View all notes |
Alert me of new notes |
CANSLIM.net Company Profile |
SEC |
Zacks Reports |
StockTalk |
News |
Chart |
Request a new note
C
A N
S L
I M
|
TDG
-
NYSE
Transdigm Group Inc
AEROSPACE/DEFENSE - Aerospace/Defense Products and; Services
|
$120.81
|
-0.92
-0.76% |
$121.80
|
491,769
93.33% of 50 DAV
50 DAV is 526,900
|
$132.69
-8.95%
|
2/29/2012
|
$120.10
|
PP = $118.93
|
|
MB = $124.88
|
Most Recent Note - 6/4/2012 1:21:13 PM
G - Slumping today near important support at its 50 DMA line. Its prior low ($118.43 on 5/18/12) defines the next important near-term chart support level to watch.
>>> The latest Featured Stock Update with an annotated graph appeared on 5/23/2012. Click here.
View all notes |
Alert me of new notes |
CANSLIM.net Company Profile |
SEC |
Zacks Reports |
StockTalk |
News |
Chart |
Request a new note
C
A N
S L
I M
|
UA
-
NYSE
Under Armour Inc Cl A
CONSUMER NON-DURABLES - Textile - Apparel Clothing
|
$99.06
|
+1.75
1.80% |
$99.50
|
522,930
56.05% of 50 DAV
50 DAV is 933,000
|
$102.86
-3.69%
|
2/15/2012
|
$85.77
|
PP = $84.86
|
|
MB = $89.10
|
Most Recent Note - 6/1/2012 1:56:38 PM
G - Slumping under its 50 DMA line today after a gap down amid widespread market weakness. Concerns were recently raised by weaker fundamentals, its first quarterly earnings increase below the +25% minimum guideline in more than 2 years.
>>> The latest Featured Stock Update with an annotated graph appeared on 5/29/2012. Click here.
View all notes |
Alert me of new notes |
CANSLIM.net Company Profile |
SEC |
Zacks Reports |
StockTalk |
News |
Chart |
Request a new note
C
A N
S L
I M
|
VSI
-
NYSE
Vitamin Shoppe Inc
SPECIALTY RETAIL - Specialty Retail, Other
|
$50.36
|
+1.32
2.69% |
$51.07
|
483,351
104.55% of 50 DAV
50 DAV is 462,300
|
$55.29
-8.92%
|
4/25/2012
|
$47.77
|
PP = $48.46
|
|
MB = $50.88
|
Most Recent Note - 6/5/2012 4:51:52 PM
G - Posted a solid gain today with near average volume, rallying after a slump near its 50 DMA line and prior highs in the $48 area defining important chart support.
>>> The latest Featured Stock Update with an annotated graph appeared on 6/4/2012. Click here.
View all notes |
Alert me of new notes |
CANSLIM.net Company Profile |
SEC |
Zacks Reports |
StockTalk |
News |
Chart |
Request a new note
C
A N
S L
I M
|
Symbol/Exchange
Company Name
Industry Group |
PRICE |
CHANGE
(%Change) |
Day High |
Volume
(% DAV)
(% 50 day avg vol) |
52 Wk Hi
% From Hi |
Featured
Date |
Price
Featured |
Pivot Featured |
|
Max Buy |
WFM
-
NASDAQ
Whole Foods Market Inc
RETAIL - Grocery Stores
|
$88.39
|
+1.84
2.13% |
$88.71
|
2,108,306
120.10% of 50 DAV
50 DAV is 1,755,400
|
$91.50
-3.40%
|
5/3/2012
|
$90.28
|
PP = $86.45
|
|
MB = $90.77
|
Most Recent Note - 6/5/2012 4:58:15 PM
Y - Perched just -3.4% off its 52-week high today and its color code is changed to yellow based on recent resilience while no new pivot point is being cited. The high-ranked Retail - Super/Mini Markets firm found prompt support near its 50 DMA line after damaging losses negated the latest technical breakout. Confirming gains backed by higher volume, and a FTD from at least one of the major averages would be reassuring signs.
>>> The latest Featured Stock Update with an annotated graph appeared on 5/11/2012. Click here.
View all notes |
Alert me of new notes |
CANSLIM.net Company Profile |
SEC |
Zacks Reports |
StockTalk |
News |
Chart |
Request a new note
C
A N
S L
I M
|
|
|
|
THESE ARE NOT BUY RECOMMENDATIONS!
Comments contained in the body of this report are technical
opinions only. The material herein has been obtained
from sources believed to be reliable and accurate, however,
its accuracy and completeness cannot be guaranteed.
This site is not an investment advisor, hence it does
not endorse or recommend any securities or other investments.
Any recommendation contained in this report may not
be suitable for all investors and it is not to be deemed
an offer or solicitation on our part with respect to
the purchase or sale of any securities. All trademarks,
service marks and trade names appearing in this report
are the property of their respective owners, and are
likewise used for identification purposes only.
This report is a service available
only to active Paid Premium Members.
You may opt-out of receiving report notifications
at any time. Questions or comments may be submitted
by writing to Premium Membership Services 665 S.E. 10 Street, Suite 201 Deerfield Beach, FL 33441-5634 or by calling 1-800-965-8307
or 954-785-1121.
|
|
|

